Sample Category Title
Australia CPI cools more than expected to 3.4%, easing near-term pressure on RBA
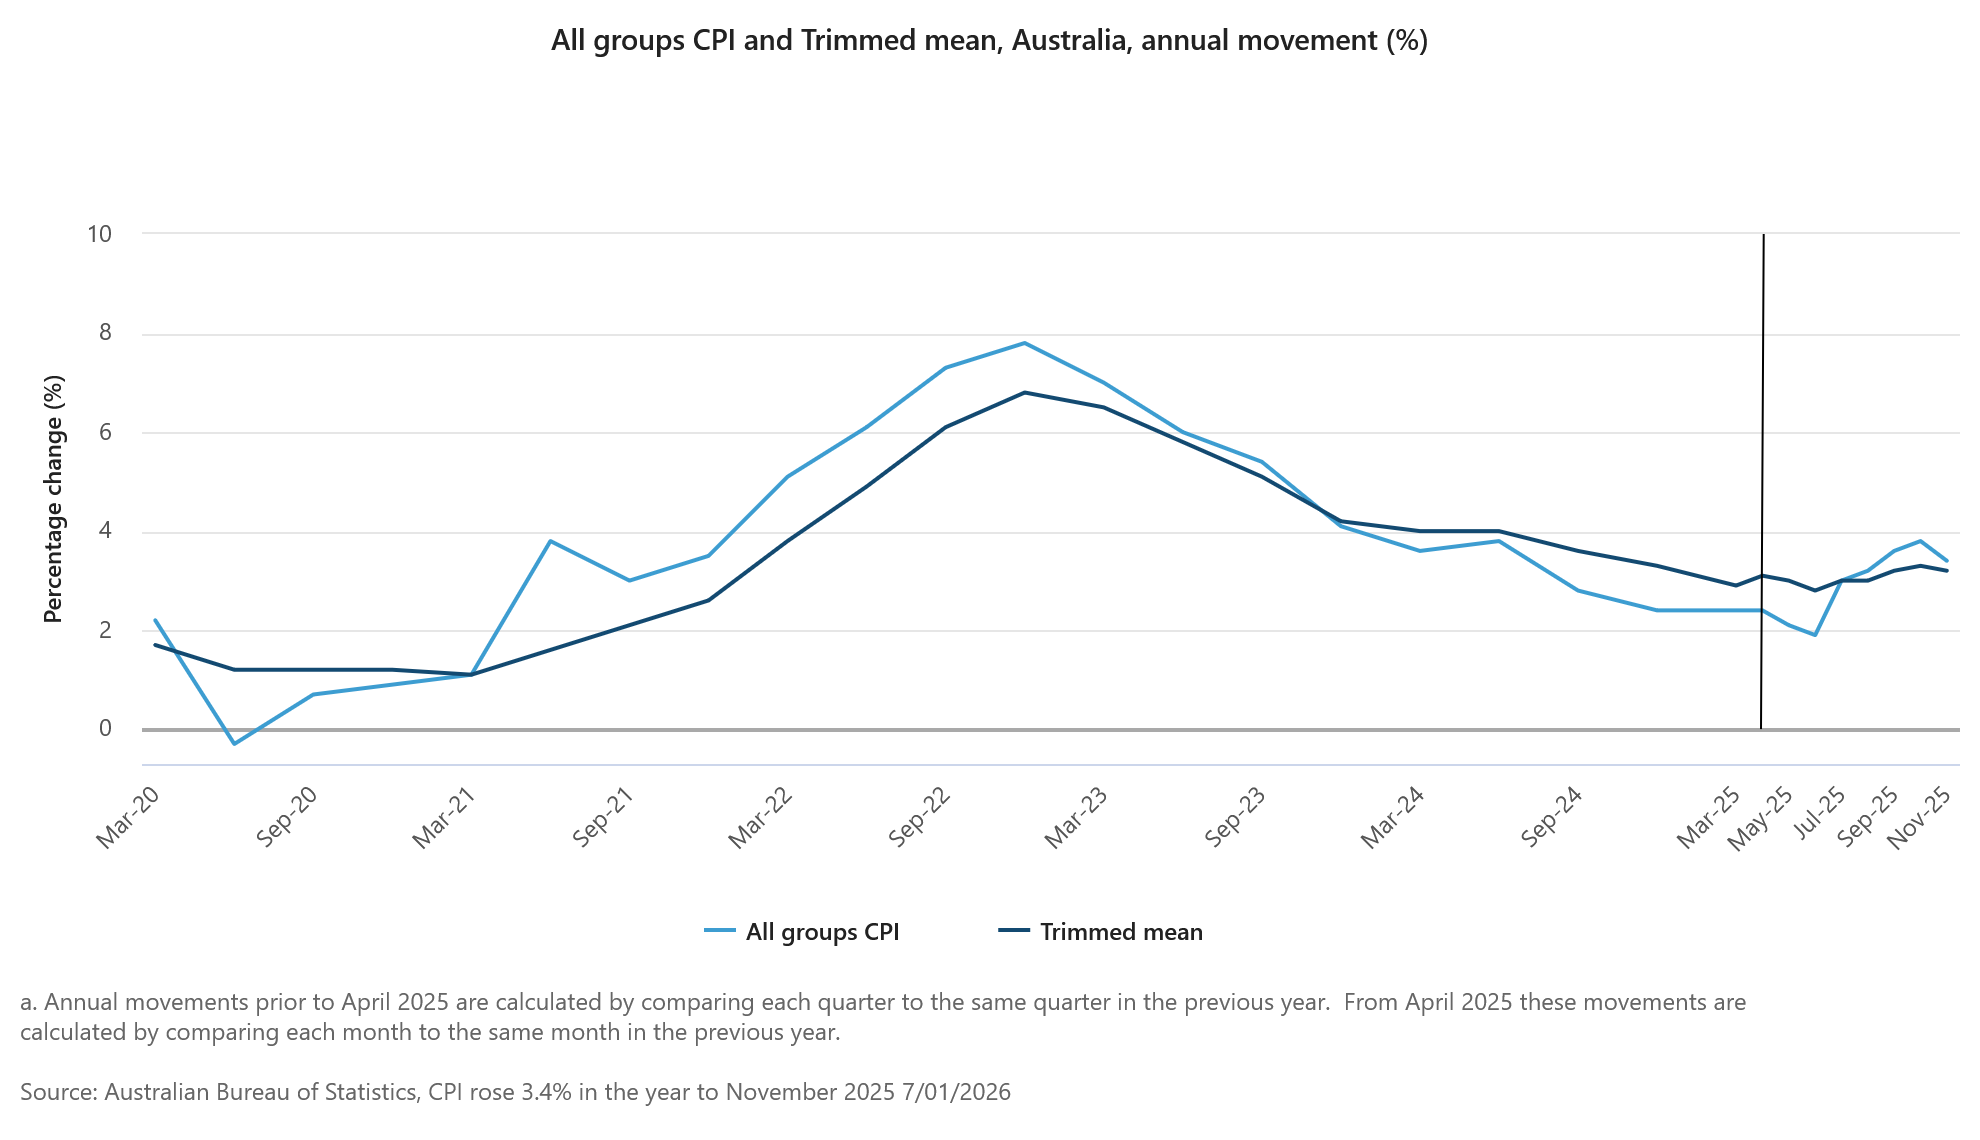
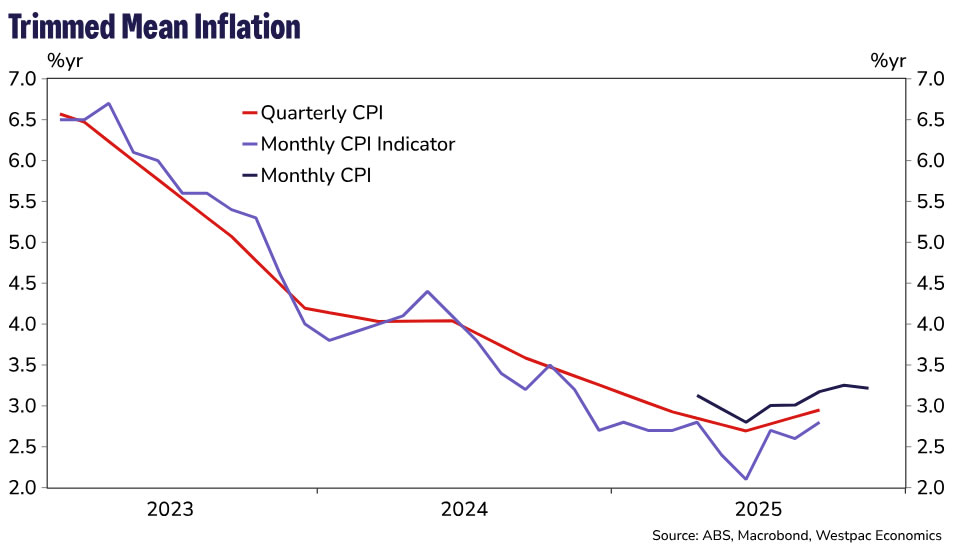
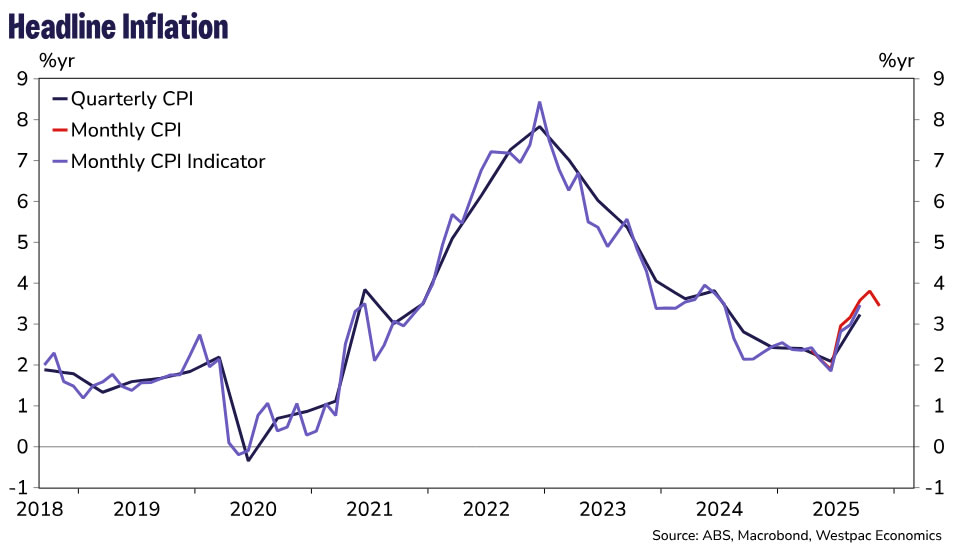
Australia’s inflation cooled more than expected in November, offering some relief after months of intensifying price pressure. Headline CPI slowed from 3.8% yoy to 3.4%, undershooting expectations of 3.6%. Trimmed mean inflation eased modestly from 3.3% yoy to 3.2%, pointing to a gradual moderation in underlying pressures.
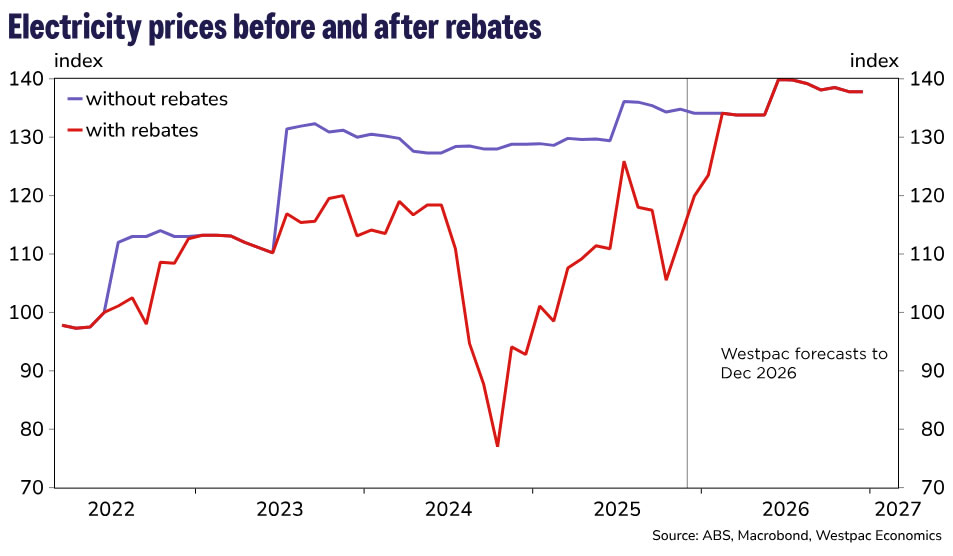
The slowdown was broad-based. Annual goods inflation fell to 3.3% yoy from 3.8%, driven largely by a sharp deceleration in electricity prices, which rose 19.7% over the year compared with 37.1% previously. Services inflation also eased, slowing to 3.6% yoy from 3.9%, helped by a pullback in domestic holiday travel costs after October’s school-holiday and major sporting-event surge.
Despite the moderation, price pressures remain elevated in key areas. Housing inflation stayed firm at 5.2% yoy, while rents and medical services continued to rise at a solid pace. The data ease immediate pressure on the RBA for rate hike. But with inflation still well above target range, policymakers are likely to remain cautious about declaring victory too early.
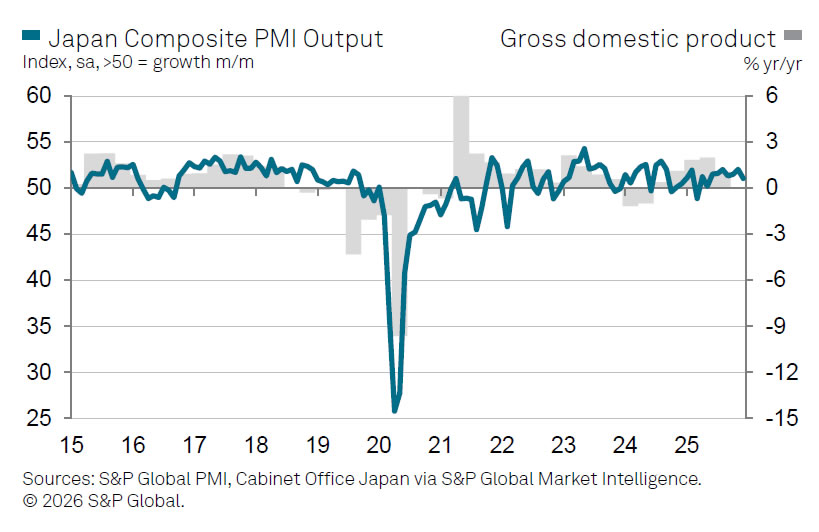
Japan PMI composite finalized at 51.1, but confidence and hiring hold up
Japan’s service sector lost some momentum at the end of 2025, with Services PMI finalized at 51.6 in December, down from 53.2 in November. Composite PMI eased to 51.1 from 52.0, marking a seven-month low.
According to S&P Global Market Intelligence Economics Associate Director Annabel Fiddes, services firms reported slower growth in activity and new orders, while manufacturing showed relative improvement. Despite softer demand signals, business confidence across Japan’s private sector remained firm, supporting a "solid and accelerated rise in employment".
Cost pressures, however, remain a key challenge. Input prices rose at the fastest pace since April, driven by higher costs, prompting firms to lift selling prices at a solid rate. With demand conditions softening slightly, companies face a "difficult balance" between passing on higher costs to protect margins and maintaining competitiveness.
US Labour Data and Euro Area Inflation in the Spotlight
In focus today
From the US, ISM Services index and ADP private sector employment report are due for release for December, and the JOLTs report for November. ADP's weekly employment estimates signalled improving jobs growth momentum towards late November and early December.
In the euro area, we expect HICP inflation to decline to 1.9% y/y in December from 2.1% y/y in November with a risk that it could round down to 1.8% y/y. We expect core inflation at 2.3% y/y. Hence, the December inflation should be seen as a dovish surprise, although sticky services inflation somewhat limits how dovishly it should be interpreted.
In Sweden, services PMI for December are released today. The November service PMI outcome for Sweden was the highest since summer 2022 and significantly stronger than the outcomes in both Europe and the US. Given that we have seen a decline in most countries for the December outcome, it would not be surprising if we also see some pullback in today's December release for Sweden.
Economic and market news
What happened overnight
China imposed a ban on the export of dual-use items to Japan for military use, escalating a diplomatic dispute over Japanese Prime Minister Takaichi's recent remarks on Taiwan. Japan has called the measure "absolutely unacceptable," as the ban includes rare earth elements critical for manufacturing. Beijing is reportedly considering broader rare earth curbs, which could significantly impact Japan's economy and key industries like automotives. Market reaction has been muted so far, though Japanese shares fell on Wednesday, led by declines in mining stocks.
Overnight, US President Trump once again rekindled his ambition to acquire Greenland, citing national security priorities in the Arctic region and the island's untapped mineral resources. While the White House stated that purchasing Greenland is being discussed, it also explicitly stated that military action to acquire it is an option. That said, WSJ also reported that Secretary of State Marco Rubio had downplayed the threats as a negotiation tactic in a recent internal briefing. European leaders and US lawmakers have expressed strong opposition, stressing respect for Denmark's sovereignty and NATO obligations, but the administration insists the goal "is not going away".
What happened yesterday
In Germany, December inflation came in weaker than expected, with HICP inflation falling to 2.0% y/y (cons: 2.2%, prior: 2.6%) and CPI inflation declining to 1.8% y/y (cons: 2.1% y/y, prior: 2.3% y/y). The surprise was driven by sharp declines in goods and food prices, while energy prices fell as anticipated. However, services inflation remained very sticky at 3.5% y/y, limiting the dovish interpretation of the weaker headline figures.
In France, HICP inflation fell to 0.7% y/y in December from 0.8% y/y in November, as expected. The decline was driven by lower energy prices, while food inflation rose and services inflation held steady at 2.2% y/y. These prints point to lower than initially expected euro area headline inflation today, which we now expect to decline to 1.9% y/y.
In the US, Federal Reserve Governor Stephen Miran argued for aggressive interest rate cuts in 2026, calling for over 100 basis points of reductions to support economic growth. Miran stated that policy remains overly restrictive despite inflation being close to the Fed's 2% target and warned that failing to lower rates could hinder robust growth expectations for the year. His term as a Fed governor ends on 31 January, and he is serving at the Fed while on leave from his role as a top economic adviser to President Trump.
In geopolitics, Venezuelan opposition leader Maria Corina Machado praised US President Trump for the capture of Nicolas Maduro and expressed confidence that her movement would win a free election. Machado escaped Venezuela in October and received the Nobel Peace Prize and now vows to return as soon as possible. However, Trump appears to be working with interim President Delcy Rodriguez, a Maduro ally, to stabilise Venezuela before an election, disappointing the opposition. International backlash against the US intervention continues, with concerns over the precedent it sets for global norms. Overnight, Trump announced plans to refine and sell up to 50 million barrels of sanctioned Venezuelan oil, with revenues controlled by the US administration to allegedly benefit both Venezuelans and Americans
In the euro area, final December services PMI was revised slightly down to 52.4 from the flash estimate of 52.6, while the composite PMI fell to 51.5 from 51.9 due to the manufacturing print being revised down. Despite the downward revisions, the euro area economy ended the year on a positive footing, with the Q4 average composite PMI significantly higher than in Q3, indicating decent growth and supporting the ECB's assessment of the economy being in a "good place".
In Norway, house prices (SA) were unchanged in December, falling short of Norges Bank's December MPR estimate of +0.8%. While this is unlikely to affect monetary policy in the short term, the data could support lower rate expectations in the market.
Equities: Global equities extended gains yesterday, marking the third consecutive positive trading day to start 2026. In Europe, the advance was more defensively led, with healthcare outperforming. Oil prices reversed lower after a brief uptick, weighing on energy stocks, which underperformed on the day.
More importantly, the first three trading days of the year have been characterised by a broadening of the equity rally. Performance has rotated away from some last year's winners (not least tech) and towards more classic deep cyclical sectors. Likewise small caps have outperformed large caps for three days in a row, reinforcing the message of broader participation. Putting this into perspective: since our last tactical shift in mid-December, the materials sector is up 8.2%, while global technology is down 1.7%.
Part of this reflects the exceptional strength in both industrial and precious metals, but the broader takeaway remains clear. Global equities are up 2.2% over the same period, despite technology underperforming. In other words, equities can rise even when tech does not lead! In the US yesterday, Dow +1.0%, S&P 500 +0.6%, Nasdaq +0.7%, and Russell 2000 +1.4%. This morning, Asian markets are mixed, and futures in both Europe and the US point to a more cautious open.
FI and FX: The USD outperformed most of the rest of the G10 currency space yesterday closely followed by the Scandies on another day marked by positive sentiment in the stock market. The bond market was overall steady with US yields inching higher and European yields lower. The DKK market came under pressure. The culprit was a rise in EUR/DKK close to past central bank FX intervention levels, which led widening of the spread between Danish and German government bonds.
Australia November CPI: Momentum Not as Strong as First Thought
The new Complete Monthly CPI printed softer than we thought presenting downside risk to our December quarter estimates.
- Headline CPI came in softer than Westpac had expected; 0.0% in the month compared to our 0.4% forecast.
- As such, this presents a downside risk to our current December quarter nearcast of 0.6%qtr for the Headline CPI and 0.8%qtr for the Trimmed Mean.
- If this is correct, it should be enough to comfort the RBA that they do not need to lift rates at the February meeting.
- Outside of administered prices, known supply shocks and items that are known to be volatile, we continue to expect the currently inflationary pulse to moderate through 2026.
The new Complete Monthly CPI gained 3.4% in the year to November, softer than Westpac’s estimate of 3.8%yr and the market estimate of 3.6%yr. At face value, this suggests downside risk to our December quarter estimates of 0.8%qtr for the Trimmed Mean (TM) and 0.6% for the CPI. However, we still need to complete a full review of the monthly data to confirm this.
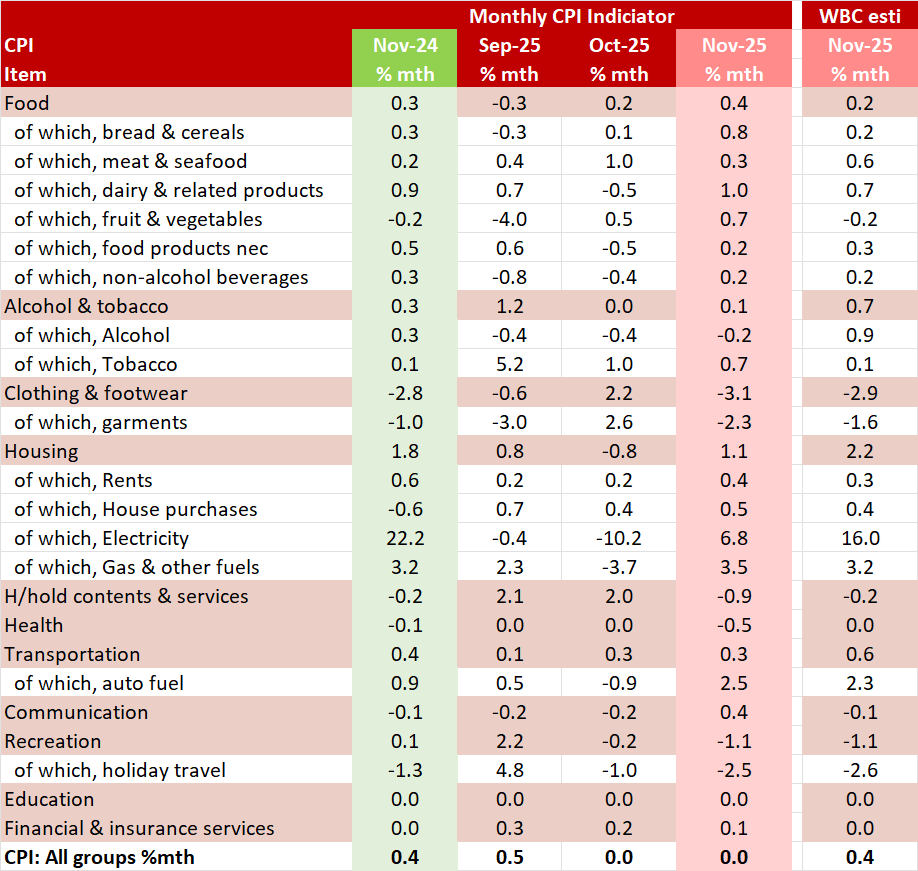
November’s headline figure was flat in the month, softer than Westpac’s published near-cast of 0.4% on the back of a smaller than expected rise in electricity (6.8% vs 16.0% estimated), a larger than expected fall in household contents & services (–0.9% vs –0.2% estimated), clothing & footwear (–3.1% vs. –2.9% estimate) and health (–0.5% vs. 0.0% expected), a smaller than expected rise in transport (0.3% vs. 0.6% forecast) to be partially offset by stronger gains in food (0.4% vs 0.2% estimated), rents (0.4% vs 0.3% estimated), dwellings (0.5% vs 0.4% estimated) and communication (0.4% vs. –0.1% estimated).
As has been the norm for some time, the energy rebates continue to have a significant impact on estimates of consumer price inflation. Electricity costs rose 19.7% in the year to November, held down by households using the Queensland State Government electricity rebate . This is a moderation from the 37.1%yr pace in October 2025 reflecting, as the ABS noted, that more households received catch-up payments of the Commonwealth Energy Bill Relief Fund (EBRF) rebate in 2024 compared to 2025.
The ABS estimates that excluding the impact of the Commonwealth and State Government electricity rebates over the past year, electricity prices rose 4.6% in the year to November compared to a 5.0% increase in the year to October. This reflects annual price reviews from energy retailers in July 2025.
The TM measure was reported to have increased 3.2% in the year to November, a slight moderation from the 3.3%yr pace in October. Due to its short history, the annual pace of monthly TM inflation can only be calculated back to April 2025. Before then the ABS noted that annual movements are calculated by comparing each quarter to the same quarter in the previous year.
The TM lifted 0.3% in the month of November, the same monthly increase it has seen for the previous four months and down from the 0.5%mth increase in July but stronger than the 0.2%mth prints from March to June.
While we note that the current annual pace of the Monthly TM, at 3.2%yr, matches our current December quarter TM estimate of 3.2%yr, we do know that the RBA will, at least for the near term, remain focused on the quarterly TM, rather than the Monthly TM. This is because the ABS does not have enough history to complete a full seasonal adjustment process for all the components of the Monthly CPI. The ABS has also noted it will take at least 18 months to gather that data so it is likely to be a year and a half before we will be able to make a more detailed assessment of core inflation directly via the monthly TM. As such, we anticipate the RBA will use the December print to guide their decision. Our expectation is that the Monetary Policy will remain cautious and pause at its next meeting in February and remain on hold for the remainder of the year.
As we have noted, see our November CPI preview, while some series did have a longer monthly history coming from the previously published monthly CPI indicator and the ABS can potentially use historical seasonal analysis we caution that some of the new data sets have a different history to the old data and as such, we expect it is going to take some time to understand the seasonal behaviour of the new data.
GBP/USD Maintains Strength, Even as Upside Momentum Pauses
Key Highlights
- GBP/USD started a fresh increase above 1.3480 and 1.3500.
- A key bullish trend line is forming with support at 1.3450 on the 4-hour chart.
- USD/JPY is consolidating above the 156.00 pivot level.
- XRP price surged over 20% and climbed above $2.30.
GBP/USD Technical Analysis
The British Pound remained supported for more gains against the US Dollar. GBP/USD climbed above 1.3450 to start another increase.
Looking at the 4-hour chart, the pair settled above 1.3450, the 100 simple moving average (red, 4-hour), and the 200 simple moving average (green, 4-hour). The pair even spiked above 1.3550 before the bears appeared.
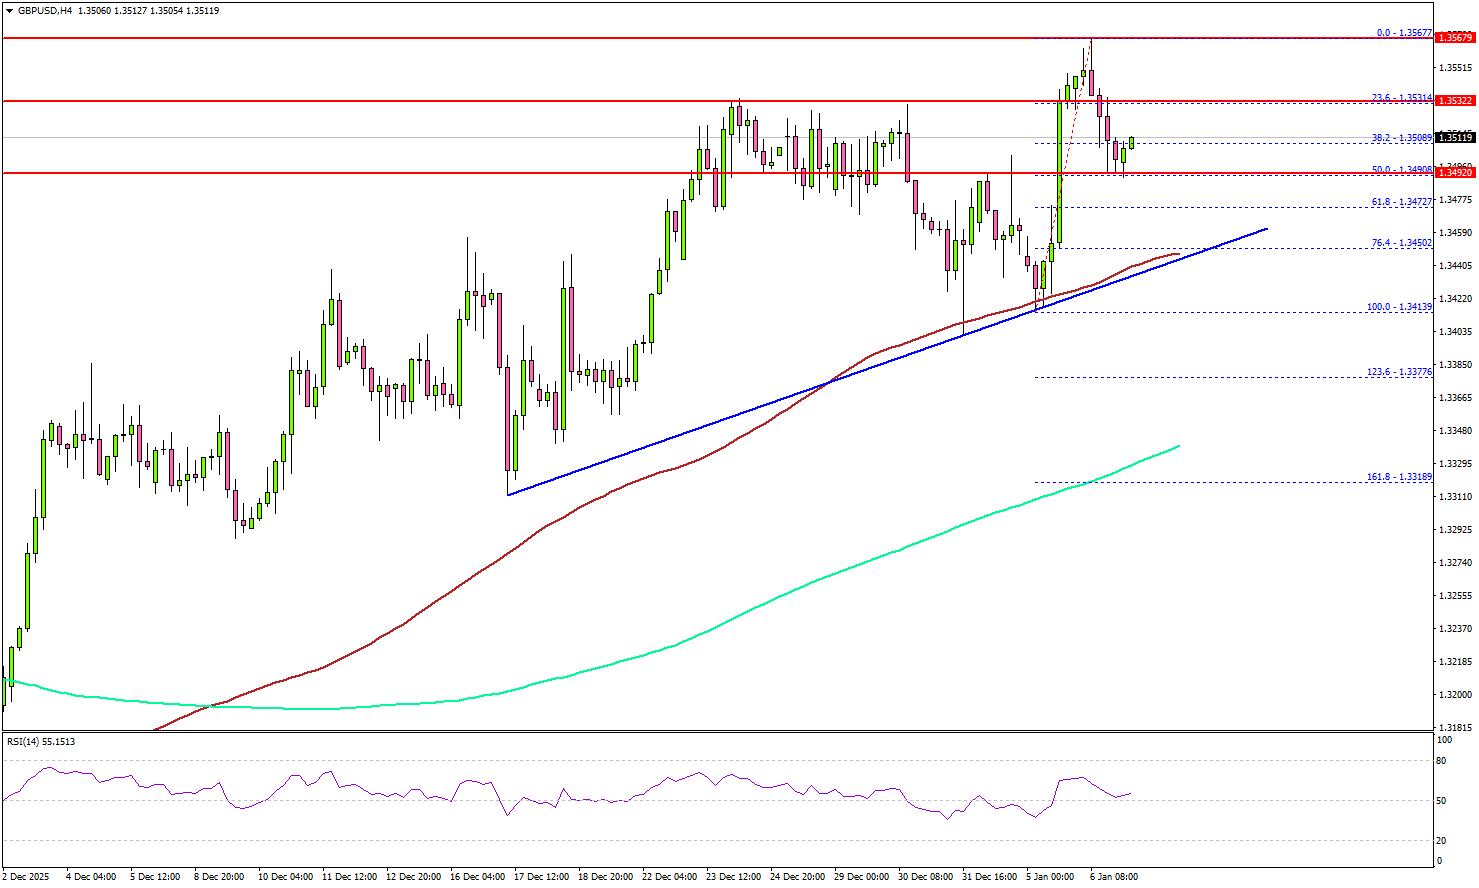
A high was formed at 1.3567, and the pair is now correcting some gains. On the downside, immediate support is near the 1.3490 level. The first major area for the bulls might be near 1.3450 and a bullish trend line.
The 100 simple moving average (red, 4-hour) is also near 1.3450. A close below 1.3450 might spark heavy bearish moves. The next support could be 1.3420, below which the bears might aim for a move toward 1.3350.
Immediate resistance sits near 1.3550. The first key hurdle is seen near 1.3565. A close above 1.3565 could open the doors for a move toward 1.3620. Any more gains could set the pace for a steady increase toward 1.3650.
Looking at XPR, the bulls took control and pushed the price above many key hurdles such as $2.20, $2.30, and $2.35.
Upcoming Key Economic Events:
- US ISM Services PMI for Dec 2025 – Forecast 52.3, versus 52.6 previous.
- US ADP Employment Change for Dec 2025 - Forecast 45K, versus -32K previous.
DAX Elliott Wave Signals Bullish Breakout Toward 25,450
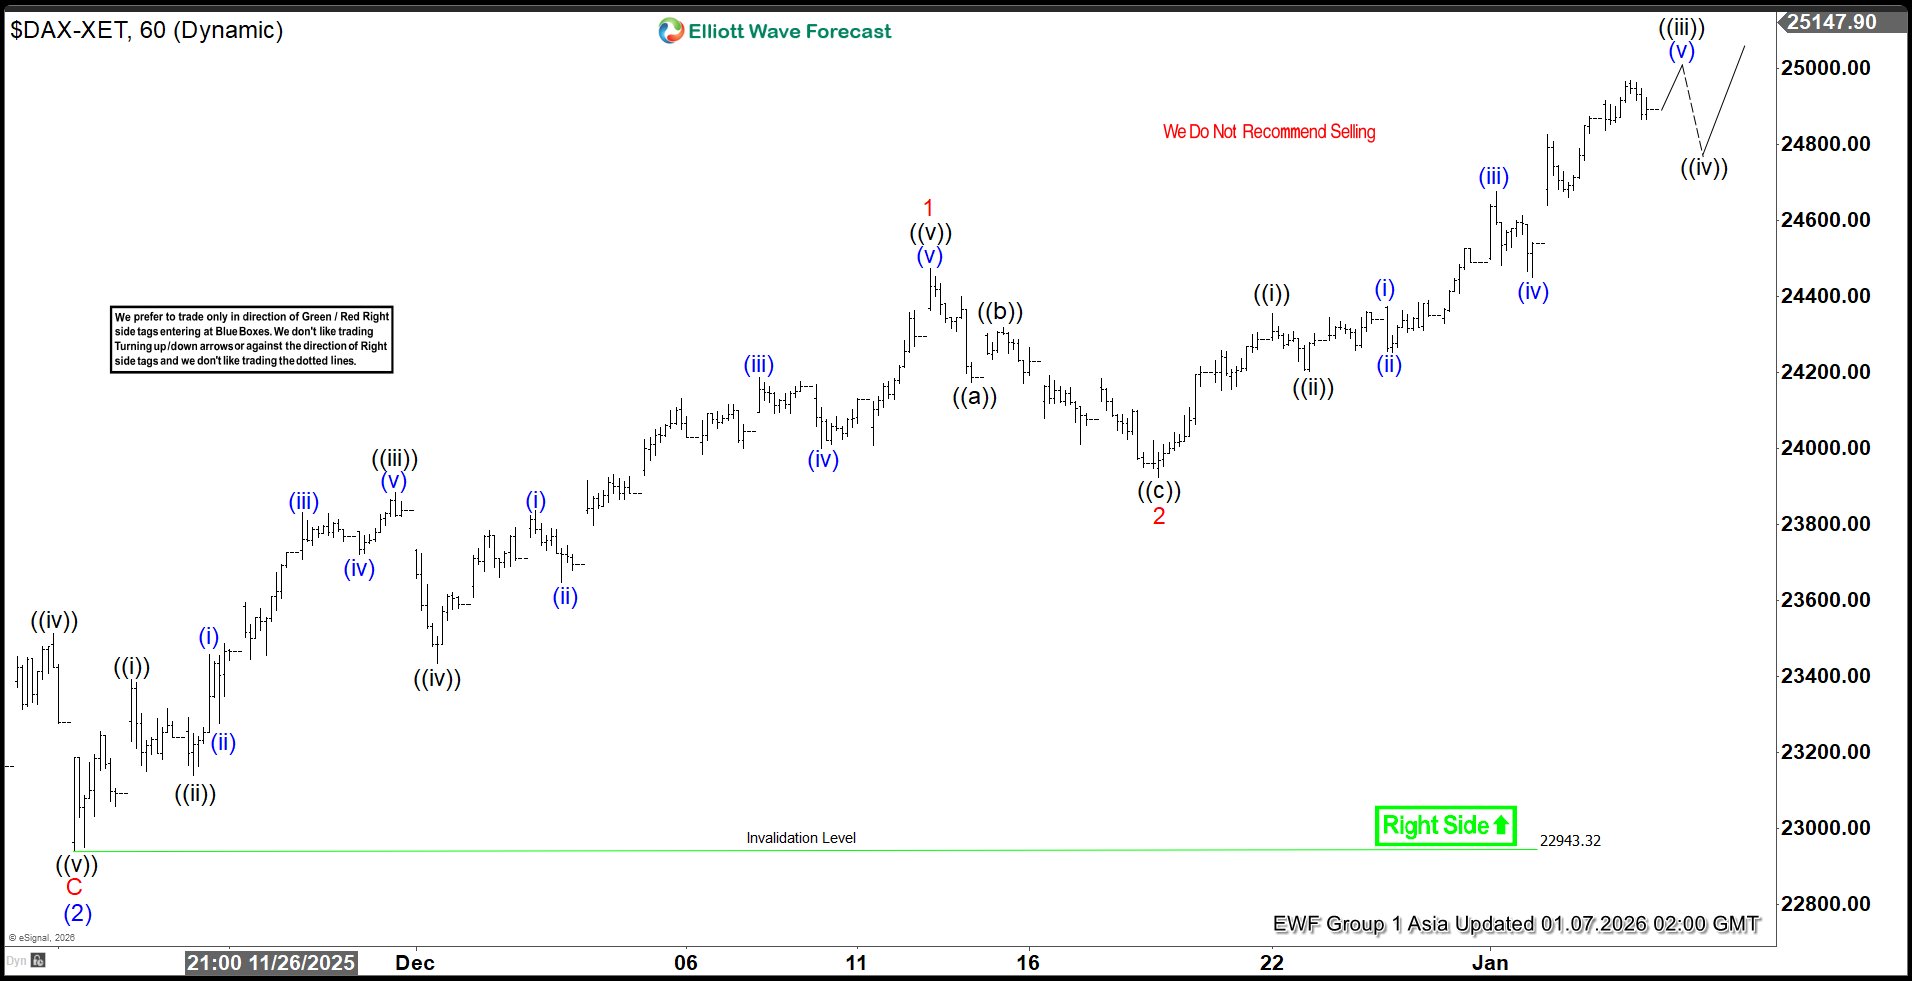
The DAX continues to advance to new highs, confirming that the right side of the market remains bullish. The decline from the November 21, 2025 low at 22,943 marked the end of wave (2). From that level, the Index began a rally in wave (3), unfolding with clear internal subdivisions consistent with an impulsive Elliott Wave structure. Wave ((i)) concluded at 23,392.2, followed by a pullback in wave ((ii)) that ended at 23,139.27. The Index then extended higher in wave ((iii)) toward 23,883.98. A corrective dip in wave ((iv)) found support at 23,433.48. The final leg, wave ((v)), carried prices to 24,474.62, completing wave 1 of a higher degree sequence.
After this advance, the Index corrected in wave 2, which unfolded as a zigzag. Wave ((a)) ended at 24,173.28, wave ((b)) at 24,318.3, and wave ((c)) at 23,923.97. This completed wave 2 and set the stage for renewed strength. The market has since resumed higher in wave 3 of (3). The potential upside target is projected at the 100% to 161.8% Fibonacci extension of wave 1, spanning 25,450 to 26,403. In the near term, as long as the pivot at 22,943.3 remains intact, pullbacks should find support within the typical three, seven, or eleven swing corrective structures, paving the way for further gains.
DAX 60 minute chart from 01.07.2026 update
DAX Elliott Wave video:
https://www.youtube.com/watch?v=8CFhDpWNchk
Chart Alert: Gold (XAU/USD) Losing Bullish Momentum Below US$4,500, Bearish Reversal Next
Key takeaways
Near-term bias turning bearish: Gold is struggling below the US$4,485–4,500 resistance zone, with price action signalling a potential short-term bearish reversal over the next 1–3 days.
Momentum and retracement warning signs: The recent rebound has reached a key Fibonacci retracement and is accompanied by bearish RSI divergence, suggesting the move is likely a countertrend bounce rather than a fresh bullish impulse.
Key levels to watch: A break below US$4,430/4,403 opens the door to deeper pullbacks toward US$4,333–4,309 and potentially US$4,267–4,243, while a clear break above US$4,500 would invalidate the bearish scenario.
Short-term trend bias (1 to 3 days): Bearish reversal
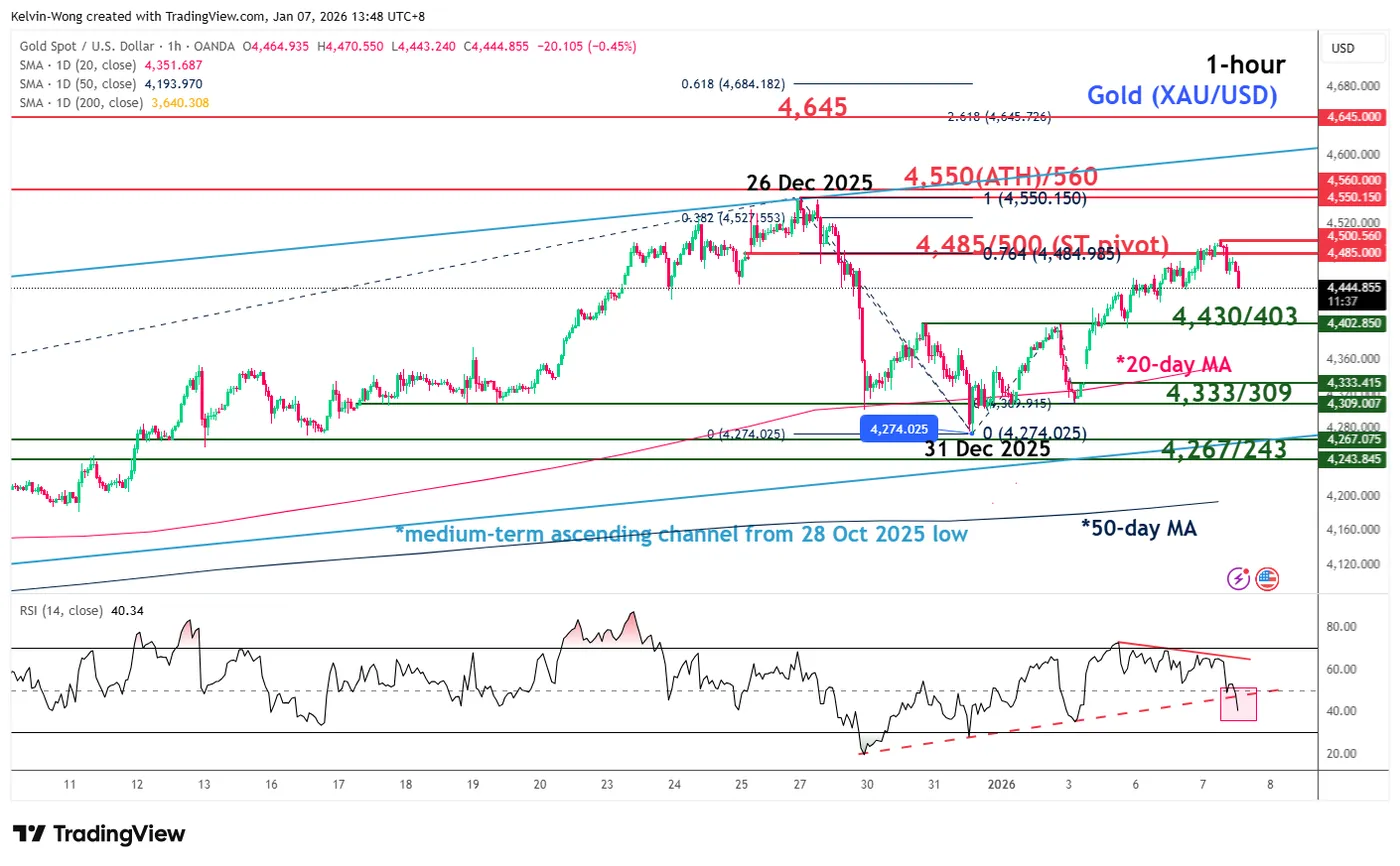
Fig. 1: Gold (XAU/USD) minor trend as of 7 Jan 2026 (Source: TradingView)
Watch the key short-term pivotal resistance at US$4,485/4,500 for a potential minor bearish reversal in the first step for Gold (XAU/USD).
A break below US$4,430/4,403 may expose further weakness towards the next intermediate supports at US$4,333/4,309, followed by the first medium-term support zone of US$4,267/4,243 (also the lower boundary of the medium-term ascending channel from 28 October 2025 low).
Key elements to support the bearish bias
- The minor up moves of 5.3% from the 31 December 2025 low of US$4,274 to today’s 7 January 2025 intraday high of US$4,500 have reached 76.4% Fibonacci retracement of the prior corrective decline from its current all-time high printed on 26 December 2025 to 31 December 2025.
- The rally since Monday, January 5, 2025, has been accompanied by a bearish divergence condition, as indicated by the hourly RSI momentum indicator, which has reached its overbought region.
- These observations suggest that the rally from 31 December 2025 is likely to be a countertrend/mean reversion rebound rather than the start of a new bullish impulsive up move sequence for Gold (XAU/USD).
Alternative trend bias (1 to days)
A clearance above US$4,485/4,500 key short-term resistance invalidates the bearish reversal scenario on Gold (XAU/USD) that allows bulls to be in control again,
Above the current all-time high of US$4,550/4,560 sees the next intermediate resistance comes in at US$4,645 (Fibonacci extension and upper boundary of the medium-term ascending channel.
Silver (XAG/USD) Explodes to $80 and Platinum (XPT/USD) Tests its All-Time Highs
For traders returning to their desks after the mid-December break, the Metals complex has been the unmissable story, aggressively grabbing market share in investor portfolios even as volumes thinned out for year-end settlement.
After a relatively calm consolidation period from October to late November, the catalyst for the next leg up arrived via a dovish pivot from NY Fed President Williams.
His comments—early but later warranted by weaker inflation data and downward revisions to US labor numbers—rocked markets and reignited the "Dollar Diversification" trade.
Initially, the rally was driven by rate cut expectations.
The Year-end buying actually pushed prices to what resembled a short-squeeze around all metals as consecutive +5% average gains across the asset class were common theme just ahead of Christmas.
When these narrative paused, geopolitical uncertainty took the baton—and that is exactly where we find ourselves today.
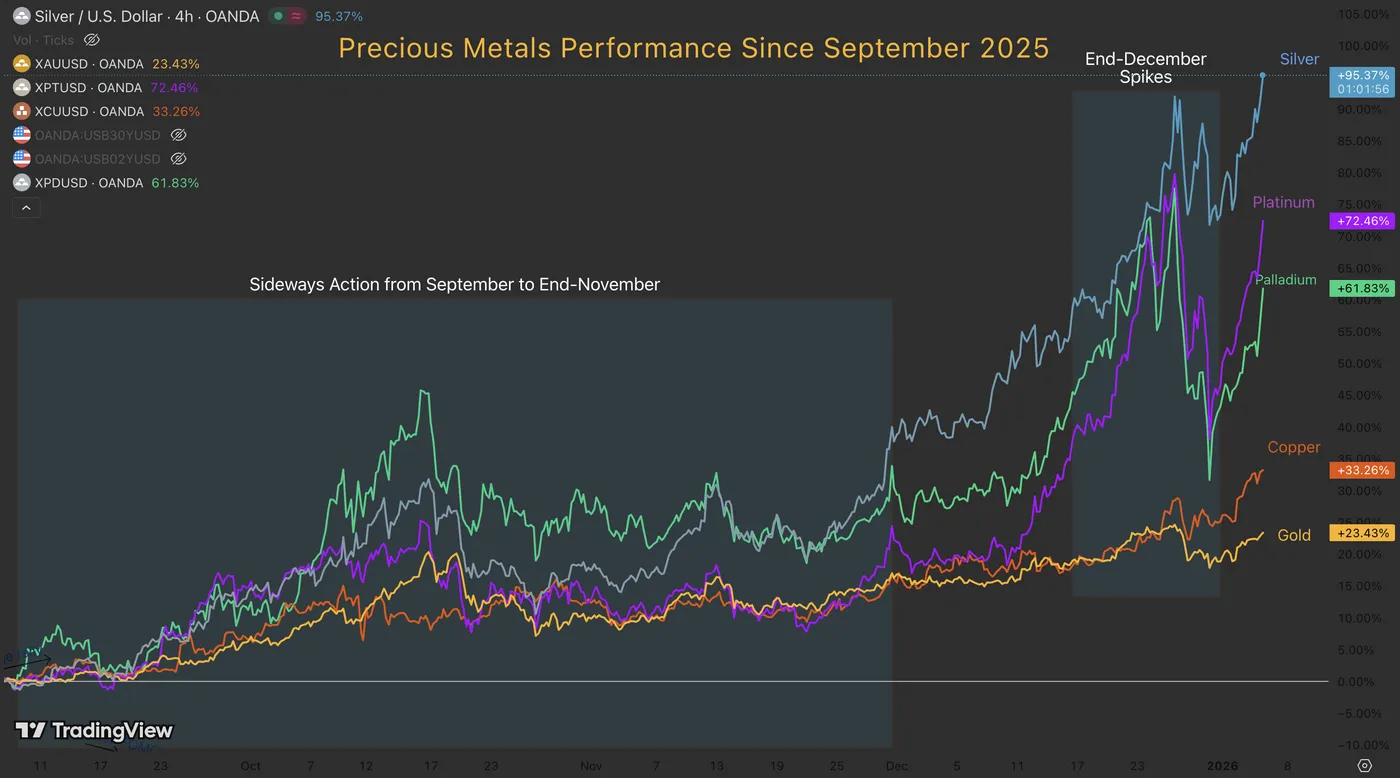
Metals Performance Since September 2025 – Source: TradingView
The latest headline shocker arrived over the weekend with the sneaky (to say the least) capture of Venezuela's Nicolas Maduro.
While a US intervention in Venezuela had been priced in to some extent, the "sci-fi" nature of the execution caught markets off guard.
The real accelerant for the renewed panic demand in metals wasn't the capture itself, but the aftermath.
In post-operation interviews, President Trump renewed threats regarding Greenland, autonomous territory of Denmark (a NATO and EU member).
This has triggered immediate concern regarding sovereign FX reserve diversification – A Major theme during 2025.
Denmark, for instance, holds approximately $90 billion in foreign currency reserves, the majority of which are denominated in US Dollars. With diplomatic tensions rising, it is safe to assume the Danish government—and other nations watching closely—are actively looking for other solution.
This is bringing yet another buying wave in Precious Metals, further driven higher by the influx of money from asset managers at the beginning of the year and confirming the end-of-December price extremes that took Gold, Silver, and Platinum to new all-time highs.
Let's dive into an intraday timeframe analysis for Silver (XAG/USD) and Platinum (XPT/USD) as ongoing buying is catching steam.
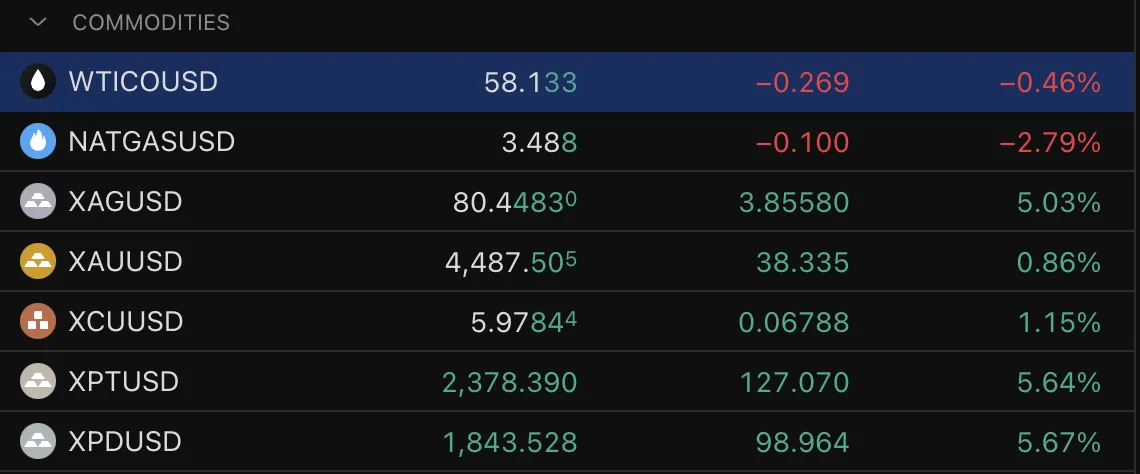
A look at the daily performance in Commodities, January 6, 2026 – Source: TradingView. XAG = Silver, XAU = Gold, XCU = Copper, XPT = Platinum, XPD = Palladium
Platinum 4H Chart and Technical Levels
Platinum (XPT/USD) 4H Chart, January 6, 2026 – Source: TradingView
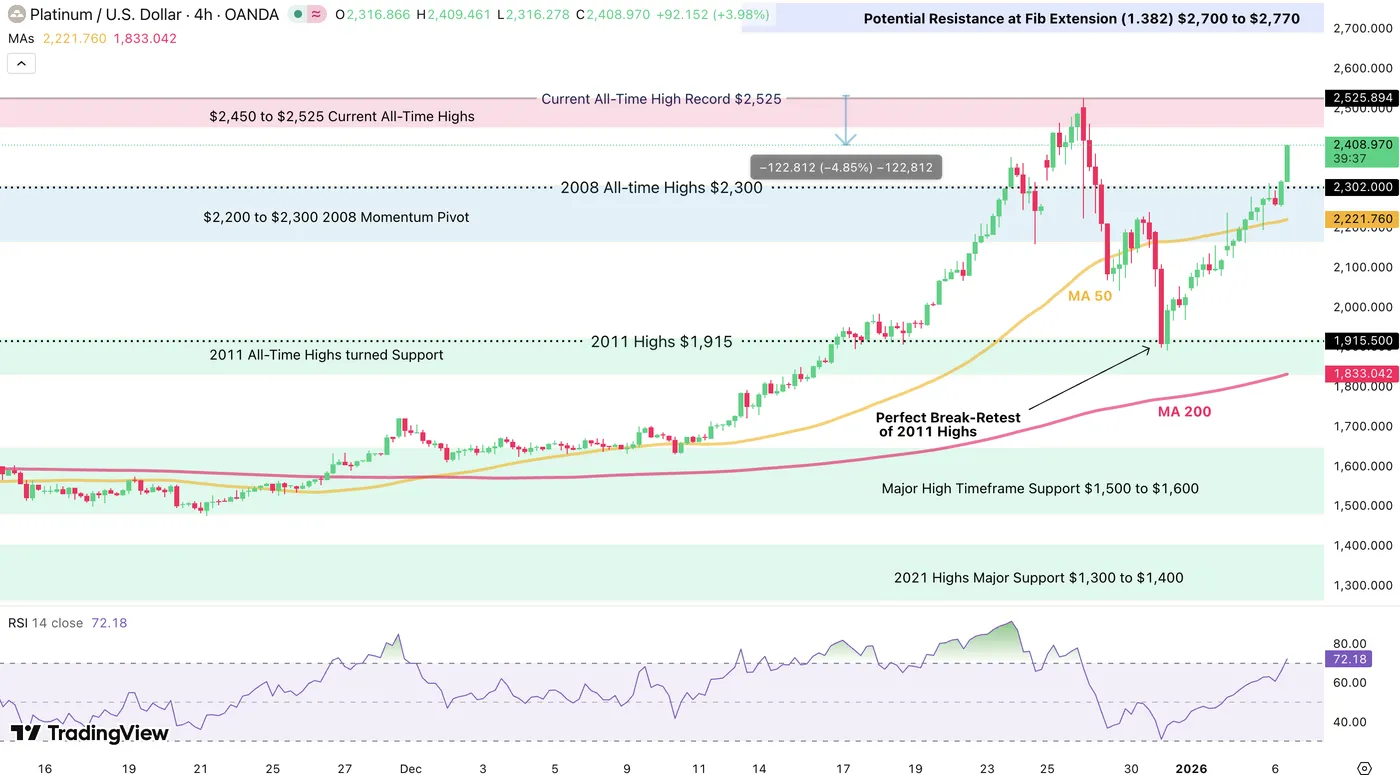
It seems that our 2026 Metals Preview was timid in terms of targets looking at the current action.
Having easily breached its 2008 preceding record during the holidays, Platinum kept on extending all the way to $2,500 where traders returning and profit-taking preceded a huge pullback.
Looking at the chart, this is a picture break-retest of 2011 highs and of previous Channel bounds, mentioned in our late-December analysis.
Keep an eye on the RSI – overall, the picture is looking very bullish and strong but buyers will have to exceed preceding highs with even more momentum to avoid the formation of divergences.
For now, they are far from showing up and momentum is strong. I expect to see at least a test of the ATH or higher for Platinum.
Platinum Technical Levels to keep on your charts:
Resistance levels
- $2,450 to $2,525 Current All-Time Highs
- Session highs $2,420
- Potential Resistance at Fib Extension (1.382) $2,700 to $2,770
- Potential Resistance 2 at Fib Extension $2,900 to $3,000
Support levels
- $2,200 to $2,300 2008 Momentum Pivot
- 2011 All-Time Highs turned Support $1,900 to $1,950
- 2013 and Current year highs $1,700 to $1,750
- $1,620 to $1,650 FOMC Support
- Major High Timeframe pivot $1,500 to $1,600
Silver 4H Chart and Technical Levels
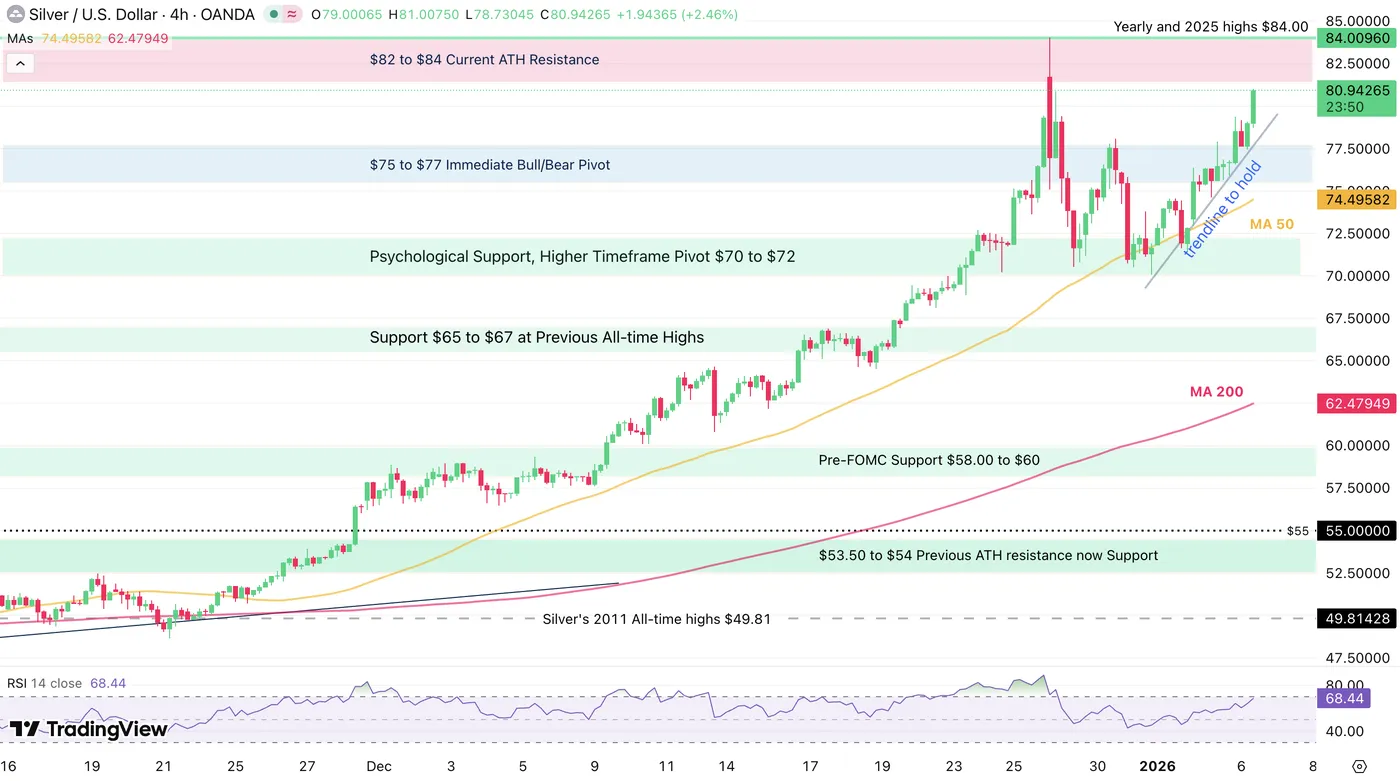
Silver (XAG/USD) 4H Chart, January 6, 2026 – Source: TradingView
Silver is going ballistic in today's action, up another 6%.
The grey metal is once again caught up into waves of thinner supply and immense demand as beginning-year orders push up demand yet again, particularly with its positive seasonals.
Immediate reactions will be interesting:
- Entering the $82 to $84 all-time High resistance Zone without slowing down (no dojis or red candles) indicates higher chances of a breakout
- Stalling at $84 could point to a double top – The way things have been, even double tops aren't enough to generate strong pullbacks, so this could point to a dip-to-buy
- Failure to breach $82 this week seems unlikely but would be a first sign of weakness for the metal.
With Momentum and Volumes coming back to Market, continuation makes sense so keep an eye on potential new records or what happens if buyers fail to push prices all the way to there.$82 to $84 Current ATH Resistance.
On the higher timeframe, watch whether Silver holds its $75 Pivot Zone and upward trendline – $70 is the next support below.
Levels to watch for Silver (XAG/USD) trading:
Resistance Levels:
- $81.01 Session Highs
- $82 to $84 Current ATH Resistance
- $87 to $88 Potential Fibonacci Resistance
- $92 Potential Fibonacci Resistance 2
Support Levels:
- $75 to $77 Immediate Bull/Bear Pivot
- Psychological Support, Higher Timeframe Pivot $70 to $72
- Support $65 to $67 at Previous All-time Highs
Safe Trades and Happy New Year!
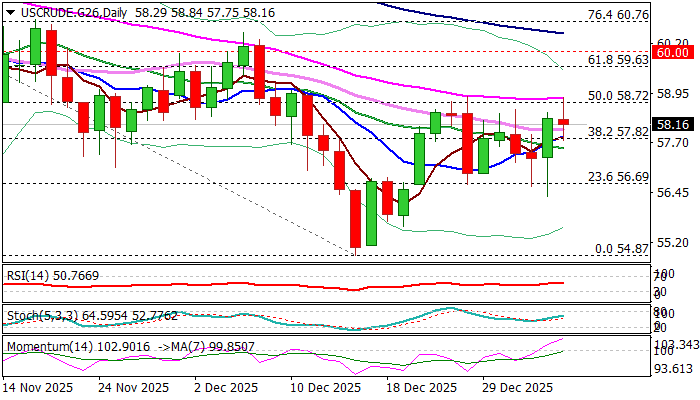
WTI Oil Retests Pivotal Barriers on Venezuela Uncertainty
WTI oil rose further on Tuesday, following US action in Venezuela, which caused uncertainty over country’s oil production and boosted demand.
Although it is still early to estimate what consequences will US unprecedented action cause on production in the country which has the biggest oil reserves, markets reacted with caution, assuming potential output disruption.
From the other hand, market observers expect sufficient oil supply in 2026, even without any intervention from OPEC, as production is expected to remain steady, while demand is likely to remain weak as most large economies struggle to accelerate economic growth.
This points to scenario that oil price would remain under pressure (unless big and unexpected changes occur) from supply and demand perspective, but very vulnerable geopolitical situation requires caution.
Technical picture on daily chart shows slight improvement (strengthening positive momentum / 10/20 DMA bull-cross) with pivotal barrier at $58.72 (50% retracement of $62.58/$54.87 descend, reinforced by 55DMA) being attacked again, but so far without firm break.
Repeated failure here, along with pressure from nearby falling thick daily Ichimoku cloud ($59.39/$618.18) would weaken near-term outlook and keep the downside vulnerable, as the price will remain within near-term consolidation range after recovery attempts from 2025 low ($54.87) have been repeatedly rejected.
However, near-term structure is expected to remain slightly bullishly aligned while the price holds above $57.82 (10DMA / broken Fibo 38.2%), while drop below $57.55 (20DMA) would risk deeper drop.
Res: 58.80; 59.63; 60.00; 60.48
Sup: 57.82; 57.55; 57.00; 56.69