
Sample Category Title
USD/CAD Daily Outlook
Daily Pivots: (S1) 1.3772; (P) 1.3794; (R1) 1.3837; More...
USD/CAD's break of 1.3804 resistance confirms short term bottoming at 1.3641. fall from 1.4139 might have completed. Intraday bias is back on the upside for 55 D EMA (now at 1.3857) and above. On the downside, below 1.3744 minor support will turn bias back to the downside for 1.3641.
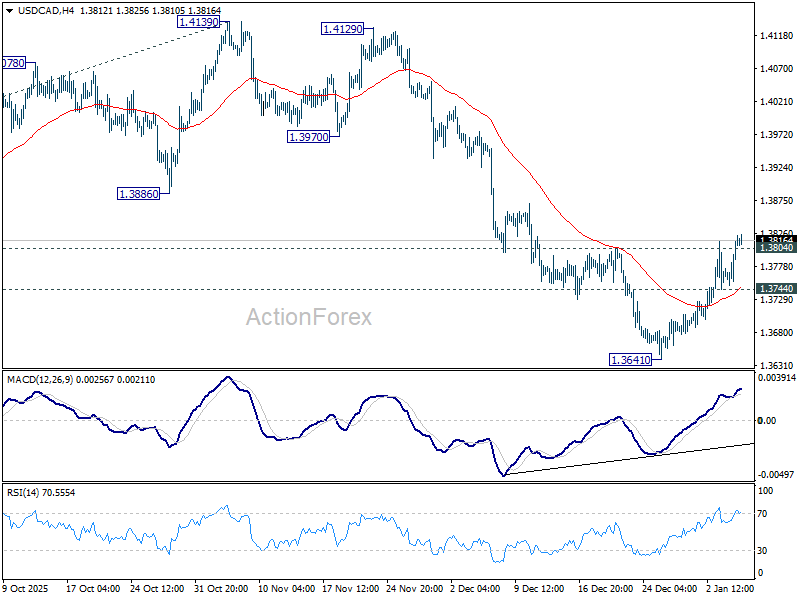
In the bigger picture, current development suggests that price actions from 1.4791 is developing into a deeper, larger scale correction. In the less bearish case, it's just correcting the rise from 1.2005 (2021 low). But even so, break of 1.3538 will pave the way to 61.8% projection of 1.4791 to 1.3538 from 1.4139 at 1.3365. This will remain the favored case as long as 1.4139 resistance holds, in case of rebound.
EUR/CHF Daily Outlook
Daily Pivots: (S1) 0.9284; (P) 0.9294; (R1) 0.9310; More....
No change in EUR/CHF's outlook and intraday bias stays neutral for more consolidations. Further fall is expected as long as 0.9315 resistance holds. Firm break of 0.9268 will resume the fall from 0.9394. Next target should be a retest of 0.9178 low. However, firm break of 0.9315 will bring stronger rise back to retest 0.9394 resistance.
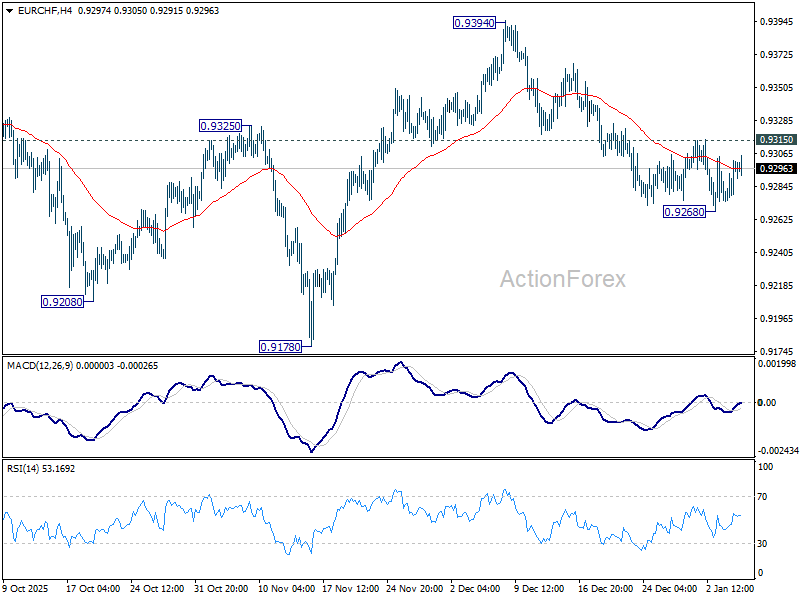
In the bigger picture, EUR/CHF has breached long term falling channel resistance as the rebound from 0.9278 extends. Considering bullish convergence condition in W MACD, sustained trading above 55 W EMA (now at 0.9366) will indicate medium term bottoming at 0.9178, and suggests that it's already in larger scale rebound. Further break of 0.9452 resistance will bring stronger medium term rally towards 0.9928 resistance next. Nevertheless, rejection by 55 W EMA will retain bearishness for another fall through 0.9178 at a later stage.
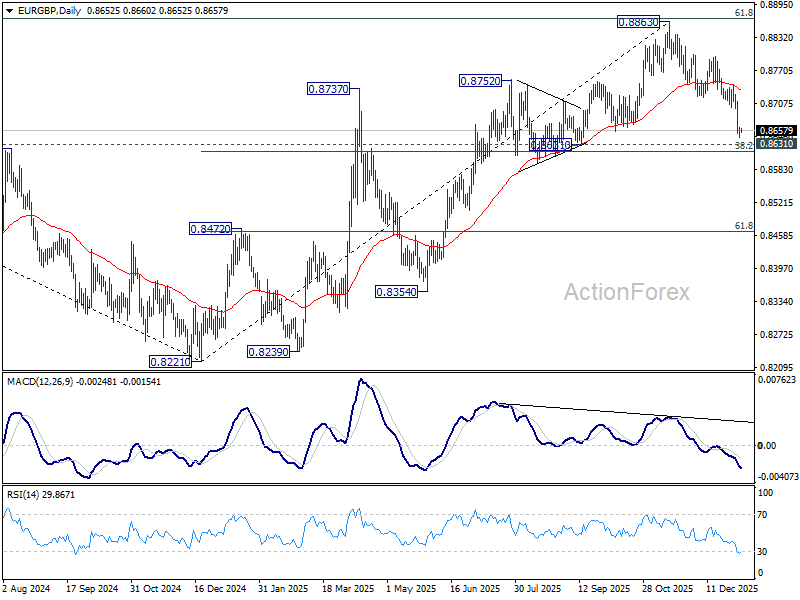
EUR/GBP Daily Outlook
Daily Pivots: (S1) 0.8646; (P) 0.8655; (R1) 0.8666; More…
Intraday bias in EUR/GBP remains mildly on the downside. Fall from 0.8863 should target 0.8631 cluster support (38.2% retracement of 0.8221 to 0.8663 at 0.8618). Decisive break there will carry larger bearish implications. For now, risk will stay on the downside as long as 0.8720 support turned resistance holds, in case of recovery.
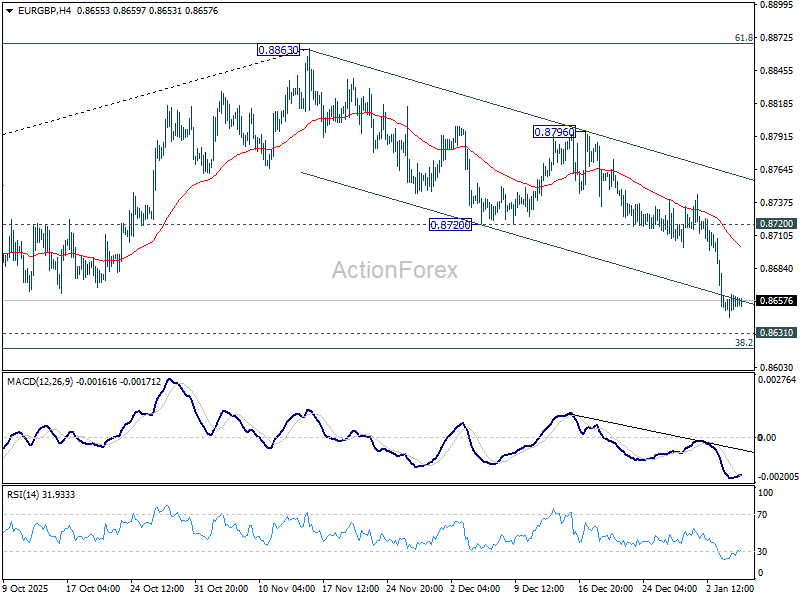
In the bigger picture, rise from 0.8221 medium term bottom is still seen as a corrective move. Upside should be limited by 61.8% retracement of 0.9267 to 0.8221 at 0.8867. Sustained trading below 55 W EMA (now at 0.8617) should confirm that this corrective bounce has completed. However, decisive break of 0.8867 will suggest that EUR/GBP is already reversing whole decline from 0.9267 (2022 high). That should pave the way back to 0.9267.
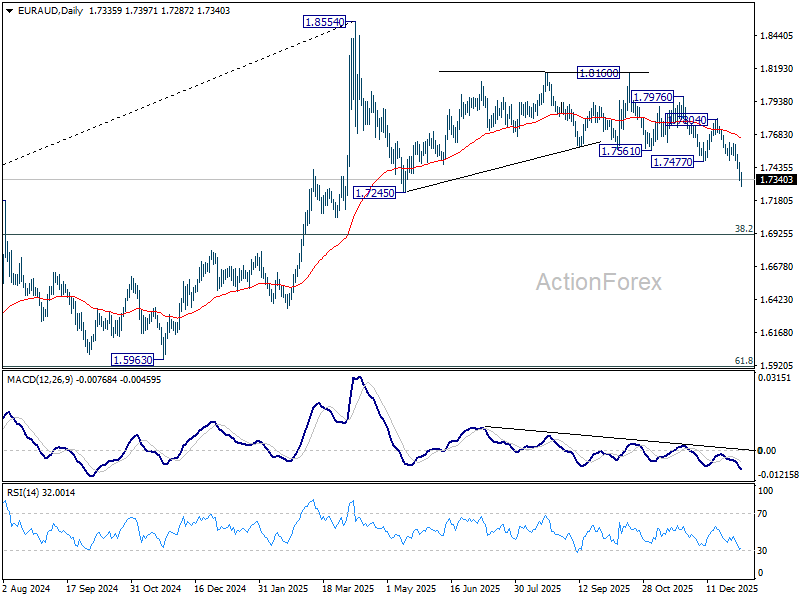
EUR/AUD Daily Outlook
Daily Pivots: (S1) 1.7298; (P) 1.7387; (R1) 1.7434; More...
EUR/AUD accelerates lower today, and intraday bias remains on the downside. Fall from 1.8160 is seen as the third leg of the pattern from 1.8554. Break of 1.7245 support will target 1.6922 fibonacci level. On the upside, break of 1.7477 support turned resistance is needed to indicate short term bottoming. Otherwise, risk will stay on the downside in case of recovery.
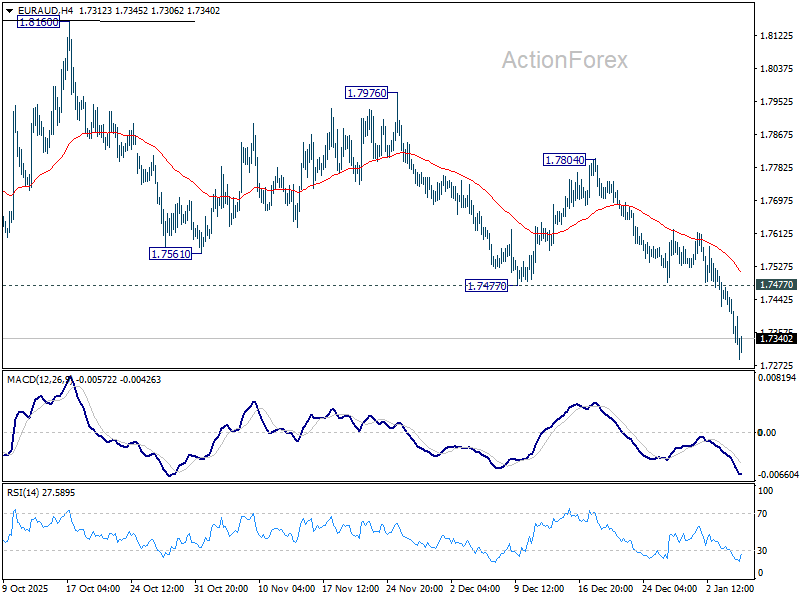
In the bigger picture, as long as 55 W EMA (now at 1.7472) holds, price actions from 1.8554 could still be a correction to rise from 1.5963 only. However, sustained break of the EMA will argue that it's already correcting the whole up trend from 1.4281 (2022 low). In this case, deeper decline would be seen to 38.2% retracement of 1.4281 to 1.8554 at 1.6922.
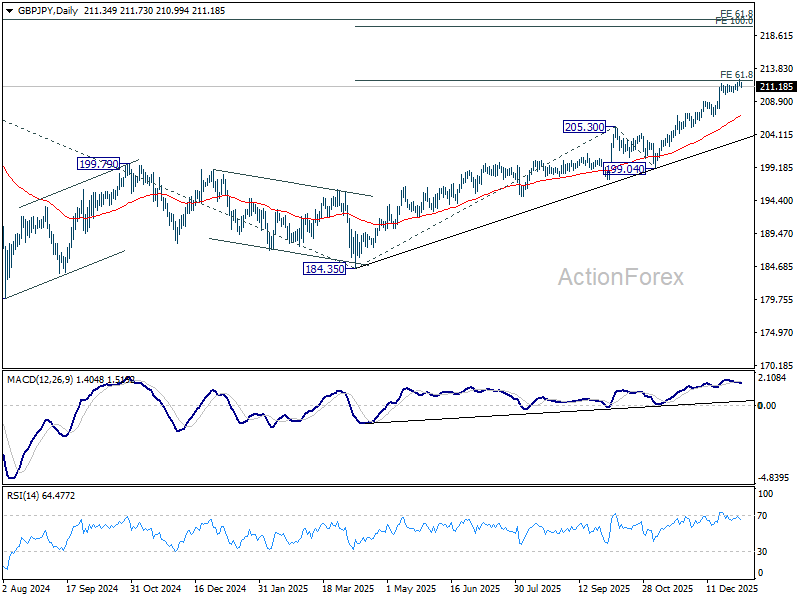
GBP/JPY Daily Outlook
Daily Pivots: (S1) 211.18; (P) 211.67; (R1) 212.03; More...
Intraday bias n GBP/JPY is turned neutral again with current retreat. Considering bearish divergence condition in 4H MACD, firm break of 210.48 support should confirm short term topping. Deeper decline would be seen to 55 D EMA (now at 206.74) as a correction. Nevertheless, sustained break of 61.8% projection of 184.35 to 205.30 from 199.04 at 211.98 will extend current up trend to 100% projection at 219.99 next.
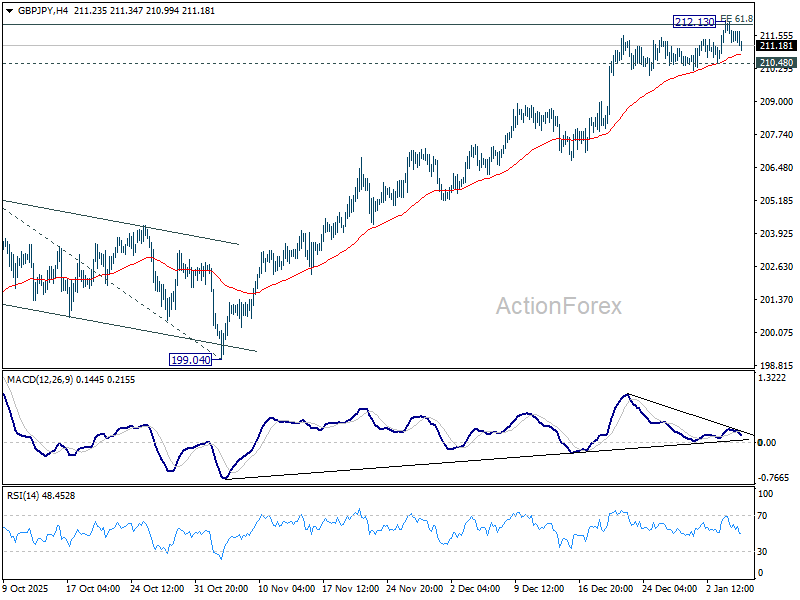
In the bigger picture, up trend from 123.94 (2020 low) is in progress. Next target is 61.8% projection of 148.93 to 208.09 from 184.35 at 220.90. On the downside, break of 205.30 resistance turned support is needed to indicate medium term topping. Otherwise, outlook will stay bullish even in case of deep pullback.
Gold Keeps Its Shine While WTI Crude Oil Slips Back Lower
Gold price remained supported and extended gains to $4,500. Crude oil is showing bearish signs and might decline below $55.00.
Important Takeaways for Gold and WTI Crude Oil Prices Analysis Today
- Gold price started a consolidation phase after a decent increase to $4,500 against the US Dollar.
- A key bullish trend line is forming with support at $4,460 on the hourly chart of gold at FXOpen.
- Crude oil prices failed to clear the $58.60 region and started a fresh decline.
- There is a connecting trend line forming with support at $55.70 on the hourly chart of XTI/USD at FXOpen.
Gold Price Technical Analysis
On the hourly chart of Gold at FXOpen, the price formed a base above $4,275. The price remained in a bullish zone and started an upward move within a range above $4,350.
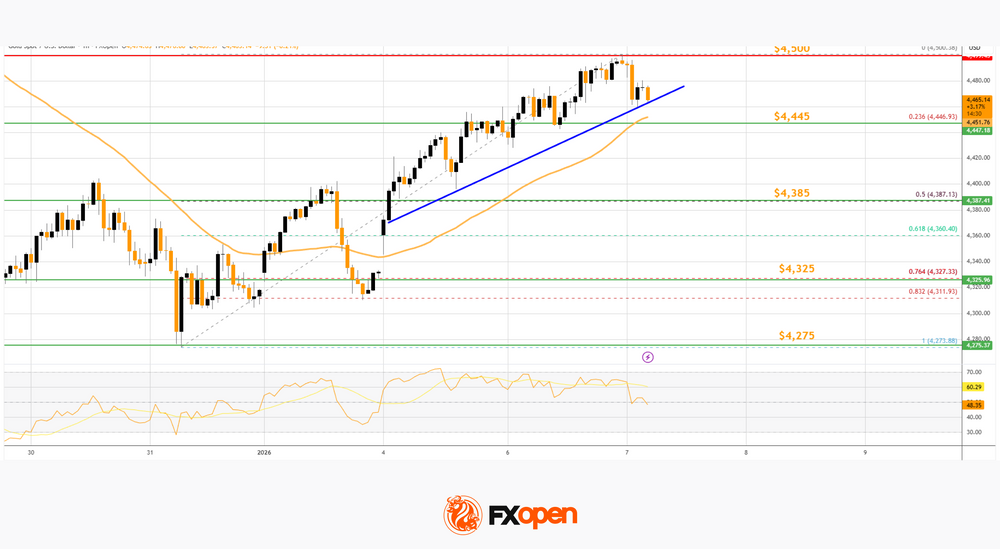
There was a decent move above the 50-hour simple moving average and $4,400. The bulls pushed the price above the $4,420 and $4,450 resistance levels. A high was formed at $4,500 before the price saw a minor pullback.
Initial support on the downside is $4,460 and a bullish trend line. The first key breakdown zone could be $4,445, the 50-hour simple moving average, and the 23.6% Fib retracement level of the upward move from the $4,273 swing low to the $4,500 high.
A close below the trend line and the $4,445 could spark a major downside correction. In the stated case, the price could test the 50% Fib retracement at $4,385. Any more losses might push the price toward $4,325.
Immediate resistance is near $4,500. The next major hurdle for the bulls is $4,520. An upside break above $4,520 could send Gold price toward $4,550. Any more gains may perhaps set the pace for an increase toward $4,600 and a new all-time high.
WTI Crude Oil Price Technical Analysis
On the hourly chart of WTI Crude Oil at FXOpen, the price struggled to clear $58.60 against the US Dollar. The price started a fresh decline below $58.00.
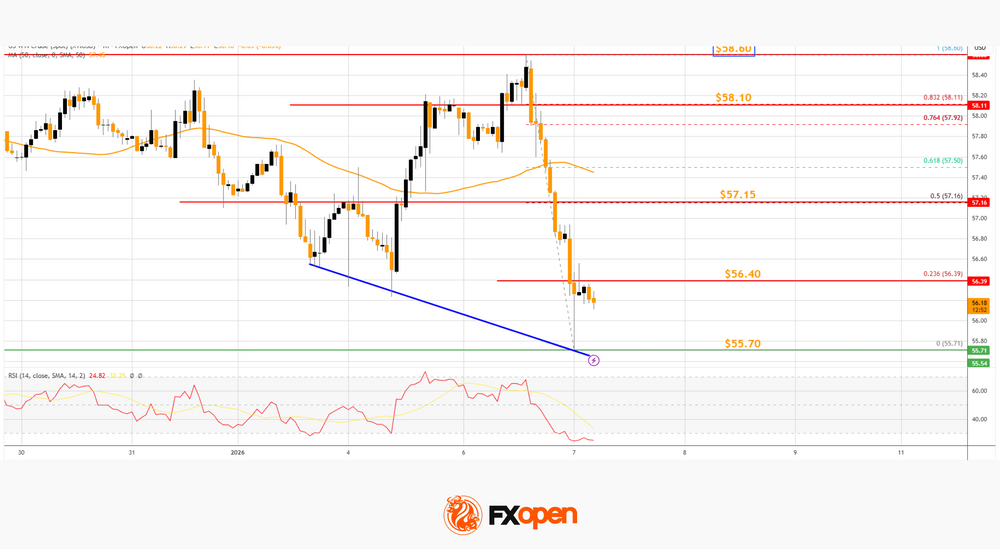
The bears gained strength and pushed the price below $57.20 and the 50-hour simple moving average. Finally, the price tested $55.70 and recently started a consolidation phase. There was a move above $56.00 and toward the 23.6% Fib retracement level of the downward move from the $58.60 swing high to the $55.71 low.
The bears are now active below $56.50. If there is a fresh increase, the price could face a barrier near $56.40. The first major hurdle is near the 50% Fib retracement at $57.15.
The next stop for the bulls could be near $58.10. Any more gains might send the price toward $58.60. Conversely, the price might start another decline and test $55.70. There is also a connecting trend line forming with support at $55.70.
The next major area of interest for the bulls on the WTI crude oil chart is $55.00. If there is a downside break, the price might decline toward $53.50. Any more losses may perhaps open the doors for a move toward $52.00.
Start trading commodity CFDs with tight spreads (additional fees may apply). Open your trading account now or learn more about trading commodity CFDs with FXOpen.
This article represents the opinion of the Companies operating under the FXOpen brand only. It is not to be construed as an offer, solicitation, or recommendation with respect to products and services provided by the Companies operating under the FXOpen brand, nor is it to be considered financial advice.
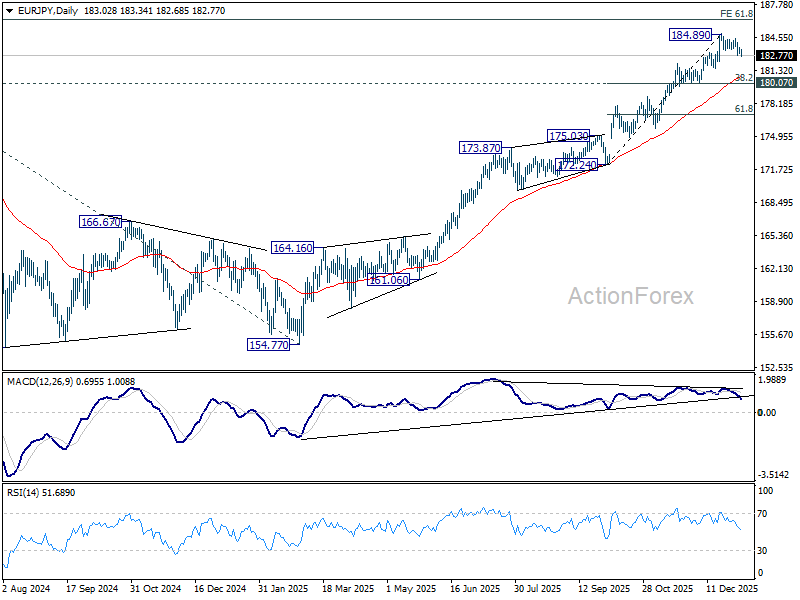
EUR/JPY Daily Outlook
Daily Pivots: (S1) 182.87; (P) 183.26; (R1) 183.53; More...
EUR/JPY edges lower today and the sustained trading below 55 4H EMA (now at 183.45) argues that fall from 184.89 short term top is already correcting the rally from 172.24. Intraday bias is mildly on the downside for 55 D EMA (now at 180.74). But strong support should emerge from 180.07 cluster (38.2% retracement of 172.24 to 184.89 at 180.05) to bring rebound. ON the upside, firm break of 184.89 will resume larger up trend to 186.31 fibonacci level.
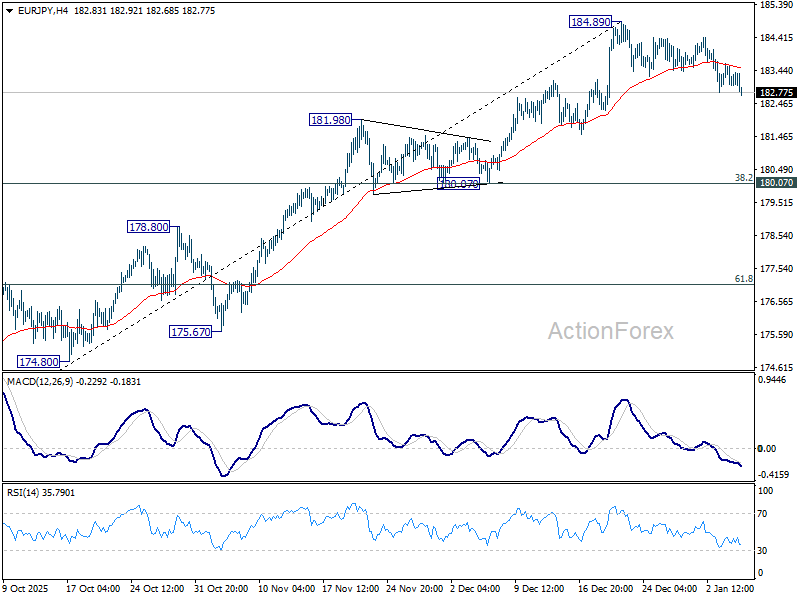
In the bigger picture, up trend from 114.42 (2020 low) is in progress and should target 61.8% projection of 124.37 to 175.41 from 154.77 at 186.31. Considering bearish divergence condition in D MACD, upside could be capped by 186.31 on first attempt. Still, outlook will stay bullish as long as 55 W EMA (now at 172.16) holds, even in case of deep pullback. Sustained break of 186.31 will pave the way to 100% projection at 205.81 next.
Yen Recovers Amid China Export Curb, Aussie Firm Despite Softer CPI
Yen recovered modestly during the Asian session as Japanese equities edged lower, but both moves lacked conviction. The pullback in the Nikkei 225 was mild, and the corresponding FX response suggests investors see little reason to reassess the broader trend.
Geopolitical developments are weighing on Japanese sentiment after China imposed export curbs on selected dual-use items destined for Japan. The measures cover goods and technologies with both civilian and military applications, including rare earths essential for chipmaking and drone production. The restrictions appear linked to comments by Prime Minister Sanae Takaichi last November on Taiwan. Beijing reacted strongly after Takaichi warned that a Chinese attack on the island could represent an existential threat to Japan, further straining already fragile ties.
Japan’s dependence on China remains significant, with around 60% of rare-earth imports sourced from country. Still, the lack of clarity on which items are affected makes it difficult to gauge the real economic impact for now. Meanwhile, some observers argue the move may be largely symbolic. China has historically avoided actions that would severely disrupt Japanese industry, and the latest step may be intended to stir domestic criticism of Takaichi rather than materially damage bilateral trade.
In contrast, Australian Dollar stayed well bid after extending gains earlier in the day, even as inflation data surprised slightly to the downside. The softer CPI reduced pressure for an immediate February hike by the RBA, but did little to derail the broader tightening narrative. Even with the softer headline outcome today, disinflation in underlying pressures remains modest. That persistence keeps the door open for rate hikes later in the year, even if February proves too soon.
Markets currently price around a two-thirds chance of a February hold, with a hike expected by June and a strong probability of a second before year-end. Nevertheless, RBA policymakers are expected to place greater weight on the full Q4 inflation report later this month. A 0.9% quarter-on-quarter or higher rise in core inflation could still push the RBA toward tightening in February.
In FX performance terms this week so far, Aussie continues to lead, followed by Sterling and Yen. Loonie sits at the bottom, with Swiss Franc and Euro also under pressure. Dollar and Kiwi are trading d in the middle. Focus now shifts to US ADP jobs and ISM Services PMI later today, though the decisive catalyst is expected to be Friday’s non-farm payrolls.
In Asia, Nikkei fell -1.06%. Hong Kong HSI is down -1.12%. China Shanghai SSE rose 0.05%. Singapore Strait Times is flat. Japan 10-year JGB yield fell -0.008 to 2.122. Overnight, DOW rose 0.99%. S&P 500 rose 0.62%. NASDAQ rose 0.65%. 10-year yield rose 0.014 to 4.179.
Australia CPI cools more than expected to 3.4%, easing near-term pressure on RBA
Australia’s inflation cooled more than expected in November, offering some relief after months of intensifying price pressure. Headline CPI slowed from 3.8% yoy to 3.4%, undershooting expectations of 3.6%. Trimmed mean inflation eased modestly from 3.3% yoy to 3.2%, pointing to a gradual moderation in underlying pressures.
The slowdown was broad-based. Annual goods inflation fell to 3.3% yoy from 3.8%, driven largely by a sharp deceleration in electricity prices, which rose 19.7% over the year compared with 37.1% previously. Services inflation also eased, slowing to 3.6% yoy from 3.9%, helped by a pullback in domestic holiday travel costs after October’s school-holiday and major sporting-event surge.
Despite the moderation, price pressures remain elevated in key areas. Housing inflation stayed firm at 5.2% yoy, while rents and medical services continued to rise at a solid pace. The data ease immediate pressure on the RBA for rate hike. But with inflation still well above target range, policymakers are likely to remain cautious about declaring victory too early.
Japan PMI composite finalized at 51.1, but confidence and hiring hold up
Japan’s service sector lost some momentum at the end of 2025, with Services PMI finalized at 51.6 in December, down from 53.2 in November. Composite PMI eased to 51.1 from 52.0, marking a seven-month low.
According to S&P Global Market Intelligence Economics Associate Director Annabel Fiddes, services firms reported slower growth in activity and new orders, while manufacturing showed relative improvement. Despite softer demand signals, business confidence across Japan’s private sector remained firm, supporting a "solid and accelerated rise in employment".
Cost pressures, however, remain a key challenge. Input prices rose at the fastest pace since April, driven by higher costs, prompting firms to lift selling prices at a solid rate. With demand conditions softening slightly, companies face a "difficult balance" between passing on higher costs to protect margins and maintaining competitiveness.
EUR/JPY Daily Outlook
Daily Pivots: (S1) 182.87; (P) 183.26; (R1) 183.53; More...
EUR/JPY edges lower today and the sustained trading below 55 4H EMA (now at 183.45) argues that fall from 184.89 short term top is already correcting the rally from 172.24. Intraday bias is mildly on the downside for 55 D EMA (now at 180.74). But strong support should emerge from 180.07 cluster (38.2% retracement of 172.24 to 184.89 at 180.05) to bring rebound. ON the upside, firm break of 184.89 will resume larger up trend to 186.31 fibonacci level.
In the bigger picture, up trend from 114.42 (2020 low) is in progress and should target 61.8% projection of 124.37 to 175.41 from 154.77 at 186.31. Considering bearish divergence condition in D MACD, upside could be capped by 186.31 on first attempt. Still, outlook will stay bullish as long as 55 W EMA (now at 172.16) holds, even in case of deep pullback. Sustained break of 186.31 will pave the way to 100% projection at 205.81 next.
Japanese Stocks Underperform Following China Imposing Export Controls
Markets
A huge block sale in the federal funds futures market yesterday offered some entertainment during an otherwise quiet trading session. The record-sized 200k single wager stands to benefit if the market prices out the remaining odds - currently around 17% - for a Fed rate cut at the January 28 policy meeting. It’s therefore not a coincidence the bet was made yesterday, ahead of key US economic data to be released as final input to that gathering. That starts today with JOLTS vacancies (November), the ADP job report (December) and the services ISM (December) and ends with the December payrolls on Friday. ADP job creation is seen at 50k, recovering from November’s unexpected 32k drop while the services ISM should hold fairly steady around 52.2. After three consecutive Fed rate cuts (Sep-Oct-Dec), markets in our view correctly so assume a break in the normalization cycle. We think it’ll take huge downside surprises in today’s data and ultimately in Friday’s payrolls for markets to flip their current thinking. Market’s timing for a resumption of rate cuts, right now June, could shift though, even in less outspoken data misses. In any case we don’t expect technical breaks to occur in US yields or the dollar today. The 2-yr tenor is supported by the October ’25 low of 3.37%. The 10-yr maturity is struggling near first resistance around 4.2%. EUR/USD is currently changing hands in the middle of the 1.14-1.19 trading range in place since last summer. DXY is holding a similar position in the 96-100 range.
Moves in other FI parts of the market showed some modest gains for Bunds. Yields grinded around 3 bps lower, with regional inflation numbers kickstarting the move and proximity of resistances zones (eg. 2.9% in the 10-yr) supporting some return action as well. They hinted at a downside surprise in the national inflation print, which eventually came in at 0.2% m/m and 2%, missing the 0.4% and 2.2% bar. Together with a slight French miss (0.1% m/m vs 0.2%, 0.7% y/y as expected), they pose some minor downside risks to today’s European-wide release. The bar is set at 0.2% m/m and 2% y/y. Even if that would occur, there’s no reason for the ECB to act. Future CPI releases will likely see inflation dropping below the 2% goal due to (energy) base effects. But policymakers the last couple of months repeatedly warned that the ECB is to look through small and temporary deviations from target. Supply today consists of Germany’s second tap this week (10-yr) along with Belgium launching a new 10-yr syndicated benchmark deal. Stock markets after a strong start of 2026 seem to be catching a breather today. Japanese stocks this morning underperform following China imposing export controls over a feud regarding Japanese PM Takaichi’s Taiwan comments (see below).
News & Views
Overall Australian price growth was unchanged in November (0% M/M) with the annual figure falling somewhat more than hoped, from 3.8% Y/Y to 3.4% Y/Y (vs 3.6% consensus). The largest contributor to annual inflation in November was housing, up 5.2%. This was followed by food and non-alcoholic beverages, up 3.3%, and transport, which rose 2.7%. Trimmed mean inflation, which ignores the most volatile price swings and is the central bank’s preferred measure for core inflation, showed prices rising by 0.3% M/M and 3.2% Y/Y (from 3.3%). Annual goods inflation slowed from 3.8% Y/Y to 3.3% Y/Y mainly because of electricity prices (19.7% Y/Y from +37.1% Y/Y). Services inflation slowed from 3.9% Y/Y to 3.6% Y/Y due to domestic holiday travel. Today’s lower inflation print doesn’t alter the market view that the RBA will be raising its policy rate by the May policy meeting. The Aussie dollar extends its (commodity-driven) good run against USD with AUD/USD moving above 0.6750 for the first time since October 2024.
The Japanese foreign ministry reacted to yesterday’s announcement of Chinese export controls for items destined for Japan that could have military uses. Broad estimates suggest that dual-use items (commercial & military) total over 40% of total Japanese goods imports from China. Japan’s Chief Cabinet Secretary Kihara said that the measures only target Japan and deviate significantly from international practice. Tensions between both countries rise high since end November when PM Takaichi suggested that Japan could use military action if China uses force to try and seize Taiwan.
Tech Rally Showing Signs of Fatigue, Supporting Rotation Trades
The year may have begun with ongoing trade tensions and fresh geopolitical uncertainties, questions around the legitimacy of Trump’s actions — both on trade and geopolitical fronts — and persisting doubts over AI valuations, but none of this has been enough to prevent the bulls from pushing toward fresh records. The S&P 500 printed its first record high of the year — likely the first of another long series — the Dow Jones marked its second record high, and the Nasdaq advanced nearly 1% after dipping below its 50-DMA a few sessions ago.
In the aftermath of the Venezuelan operation, the market’s reaction has been largely muted — and even positive for a handful of sectors, including oil, defense stocks, rare earth metals (on potential retaliation risks from China), Bitcoin (amid speculation around a 600,000+ BTC shadow reserve Venezuela is believed to be sitting on), and precious metals. Importantly, flows into the latter appear to go beyond pure safe-haven demand, as investors showed little stress over Maduro’s capture.
What’s next? While the immediate Venezuelan risk may now be behind us, the message is clear: the US is unlikely to stop here. Relations with NATO and Europe are already under strain over Greenland, which strengthens the case for maintaining — and even increasing — exposure to defense stocks. The STOXX Europe Aerospace & Defense ETF kicked off the year with a 7% jump, and there is likely more upside ahead.
Metals — precious and industrial — also remain firmly in focus. Silver is seeing large fluctuations around the $80 mark, with the rally exacerbated by China’s decision to restrict silver exports, in a similar fashion to rare earth metals. This policy took effect on January 1. From now on, each silver shipment requires government approval, and only large, state-approved companies meeting high production and compliance thresholds are allowed to export. Estimates suggest this could potentially halve China’s export capacity, removing 4’500–5’000 tonnes from annual global supply — a meaningful amount given persistent supply deficits. Because Chinese refined silver represents a large share of globally tradable supply, these restrictions tighten the global pipeline and amplify volatility. The silver market is therefore facing a structural supply squeeze, which should, in theory, continue to support prices.
Copper also hit a record high on Comex on Tuesday, driven by a different type of supply shock. A rush to ship copper into the US ahead of potential tariffs is draining supply elsewhere, leaving a hole in the global market and pushing prices higher — on top of an already constructive backdrop of strong demand and limited supply growth. Copper, too, remains one of the hottest trades at the moment and still has room to extend gains. In both cases, US dollar softness is providing additional support to the bulls.
The main risk here is that once tariff front-running fades, some of that supply dislocation could unwind — or that a sharp rebound in the US dollar could take some heat out of the move.
Speaking of the US dollar, the greenback reversed Asian losses yesterday and closed the session on a bullish note. It is lower again in Asia this morning, highlighting a lack of directional consensus between Eastern and Western trading hours. In the absence of a major macro catalyst, part of yesterday’s move likely reflected softer-than-expected inflation and PMI data. The European Central Bank (ECB) appears to have gained control over inflation, with aggregate CPI expected to have slowed to around 2% in December (final data due this morning). From here, any further slowdown in economic growth could revive the need for additional support, and easing price pressures would give the ECB more room to act. This dynamic pushed the EURUSD below the 1.17 mark yesterday, where the pair is currently consolidating.
In Australia, inflation also fell to a three-month low, yet the AUDUSD is rising nonetheless, supported by firm metal and energy prices that continue to attract capital inflows.
Elsewhere, tech appetite is weaker in Asia this morning. Memory-chip makers are pulling back after strong gains in the first few sessions of the year, the Korean Kospi is giving back early advances, and SoftBank is down around 1.5%. The move follows Nvidia’s failure to reignite investor enthusiasm at CES, despite Nvidia’s CEO Jensen Huang announcing that its Rubin chips are nearing shipment, the CFO improving its bullish revenue outlook on strong demand, and the company unveiling its Alpamayo platform — a push into physical AI that opens new revenue avenues. Alas, investors remain focused on stretched valuations, heavy leverage and the circular nature of AI-related deals. xAI has just closed a $20bn funding round, with Nvidia among the backers.
It increasingly feels like good news is no longer generating the same euphoria seen over the past three years. The tech rally is showing signs of fatigue, supporting rotation trades — a trend further reinforced by geopolitical headlines. Tech-light European and UK indices have started the year outperforming their tech-heavy US peers, with scope for further catch-up given lower valuations and their more cyclical exposure.
Zooming out, the macro backdrop remains supportive for equities (particularly cyclicals). The Federal Reserve (Fed) is expected to cut rates several times this year, while falling inflation elsewhere continues to strengthen the hand of central-bank doves globally.
This week, the US will release its latest jobs data, with the ADP report today expected to show fewer than 50k job additions last month. A weakening labour market has been a key factor behind the Fed’s willingness to look past inflation risks and refocus on employment. The US 2-year yield remains below the 3.50% mark, and Fed funds futures currently price roughly a 50-50 chance of a March rate cut.
Further weakness in labour data would reinforce this narrative and support rate-cut expectations, while stronger-than-expected figures could quickly revive the hawks.
But, but, but... It is worth noting that the inflation leg of US data remains blurred, as recent releases were distorted by statistical issues and failed to provide a clear signal on underlying price dynamics. The fact that inflation is easing elsewhere has given investors some reassurance that US price pressures are also likely under control, allowing the Fed to focus on jobs. However, should inflation unexpectedly re-accelerate, rate-cut expectations could be rapidly repriced.