

Sample Category Title
Bitcoin Pullbacks Look Orderly—A Setup Short-Term Traders Watch
Key Highlights
- Bitcoin climbed toward $95,000 before correcting some gains.
- BTC/USD is well above a bullish trend line with support at $89,000 on the 4-hour chart.
- Ethereum started a decent increase above $3,000 and $3,120.
- XRP price rallied toward $2.50 before it faced heavy resistance.
Bitcoin Price Technical Analysis
Bitcoin price found support near $86,800 and started a fresh increase against the US Dollar. BTC climbed above $89,500 and $90,000 to enter a short-term positive zone.
Looking at the 4-hour chart, the price even surpassed $92,000 before it faced sellers near $94,800. A high was formed at $94,794, and the price settled above the 100 simple moving average (red, 4-hour) and the 200 simple moving average (green, 4-hour).
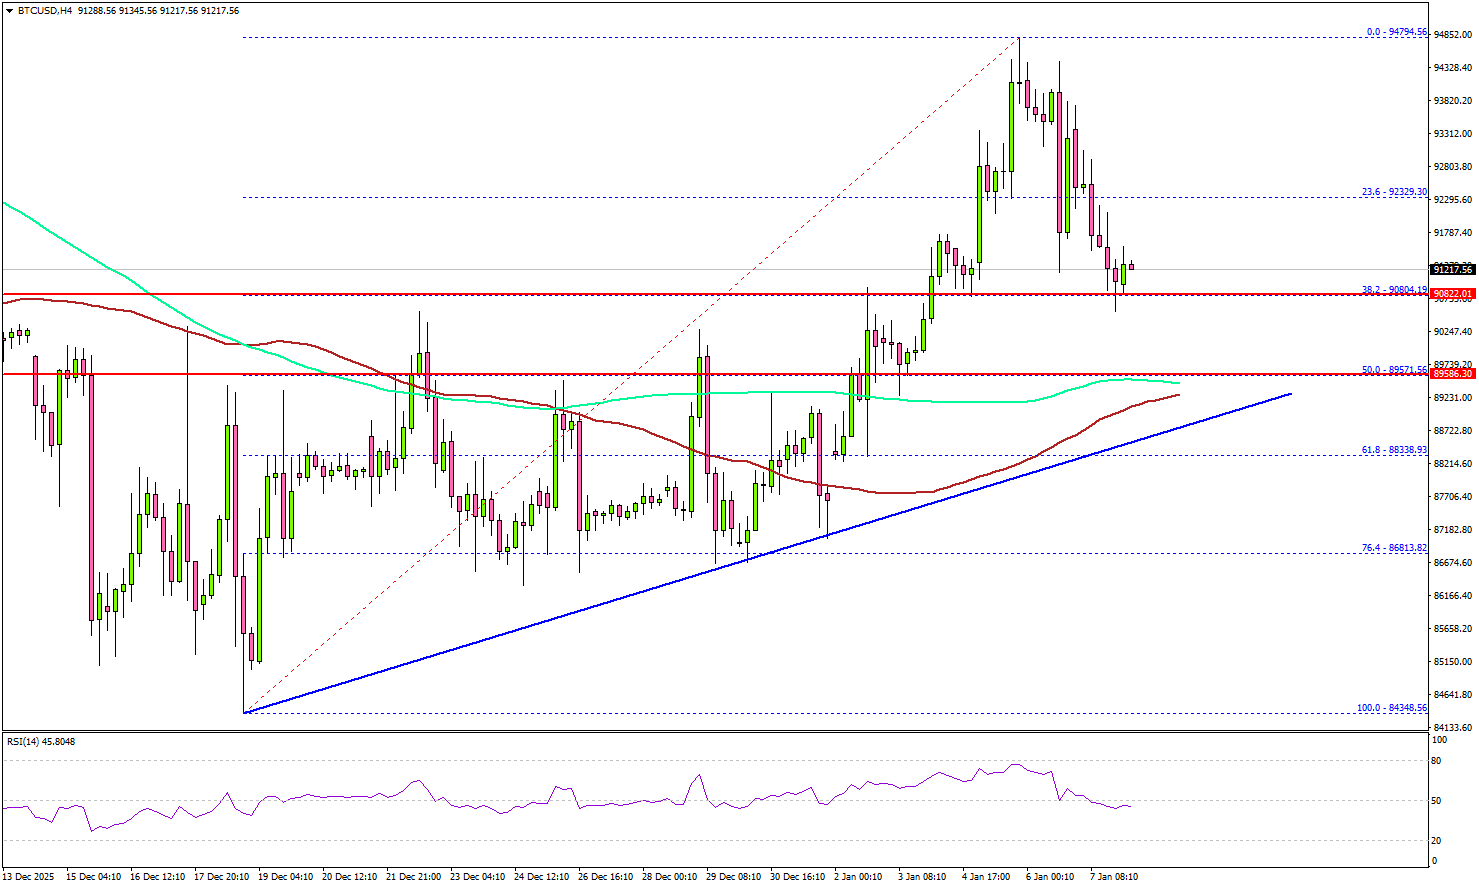
Recently, there was a downside correction below the 23.6% Fib retracement level of the upward move from the $84,384 swing low to the $94,794 high.
However, BTC is well above a bullish trend line with support at $89,000. Immediate support sits at $90,800. A downside break below $90,800 might start another decline. The next major support is $89,200, the 100 simple moving average (red, 4-hour), and the trend line at $89,000.
If there is another increase, the price could face resistance at $93,500. The first key hurdle is $94,200. The main hurdle could be $95,000. A successful close above $95,000 might start another steady increase. In the stated case, the price may perhaps rise toward the $96,500 level. Any more gains might call for a test of $98,000.
Looking at Ethereum, the price moved into a short-term positive zone and might soon aim for a move above $3,300.
Today’s Key Economic Releases
- US Initial Jobless Claims - Forecast 210K, versus 199K previous.
- US Goods and Services Trade Balance for Oct 2025 - Forecast $-58.9B, versus $-52.8B previous.
Gold (XAU/USD) Slips 1.2% Before 50-Day MA Provides Support. Acceptance Above $4500/oz Remains Key
Gold was down as much as 1.2% before recovering to trade above the $4450/oz. The precious metal is still finding significant buying support on dips but does remain vulnerable if it does not breach the $4500/oz level.
Geopolitics and US Data
Geopolitical risk rears its head again as news came through earlier today that the US were going to seize another tanker out of Venezuela which was sporting a Russian flag. This has caused some concern about an escalation between the US and Venezuela as well as potentially Russia.
The White House separately confirmed discussions about acquiring Greenland, including potential military involvement which is likely to keep safe haven demand in play as well.
Further underpinning the precious metal was softer than expected employment data which continues to support further Federal Reserve interest rate cuts. US job openings fell more than expected in November after rising marginally in October, while a separate ADP report showed that private payrolls increased less than expected in December.
What Comes Next for Gold Prices?
Investors are closely watching for the release of the NFP data on Friday, January 9. This will likely have a major impact on rate cut expectations and thus could serve as a catalyst for gold's next big move.
Gold does appear to still be volatile given the price action we saw today. So I would not rule out significant movement overnight in the Asian session.
Tomorrow brings a batch of mid-tier US economic data that could spark some volatility. The key releases to watch include the initial jobless claims and the trade balance for goods and services.
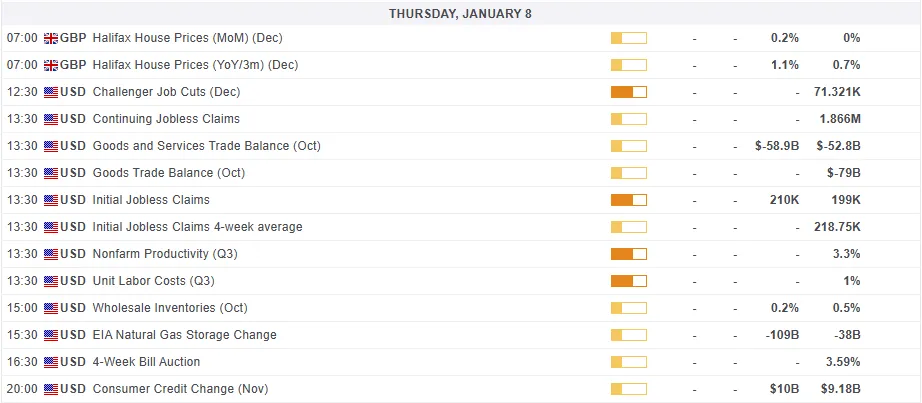
For all market-moving economic releases and events, see the MarketPulse Economic Calendar. (click to enlarge)
Technical Outlook - Gold (XAU/USD)
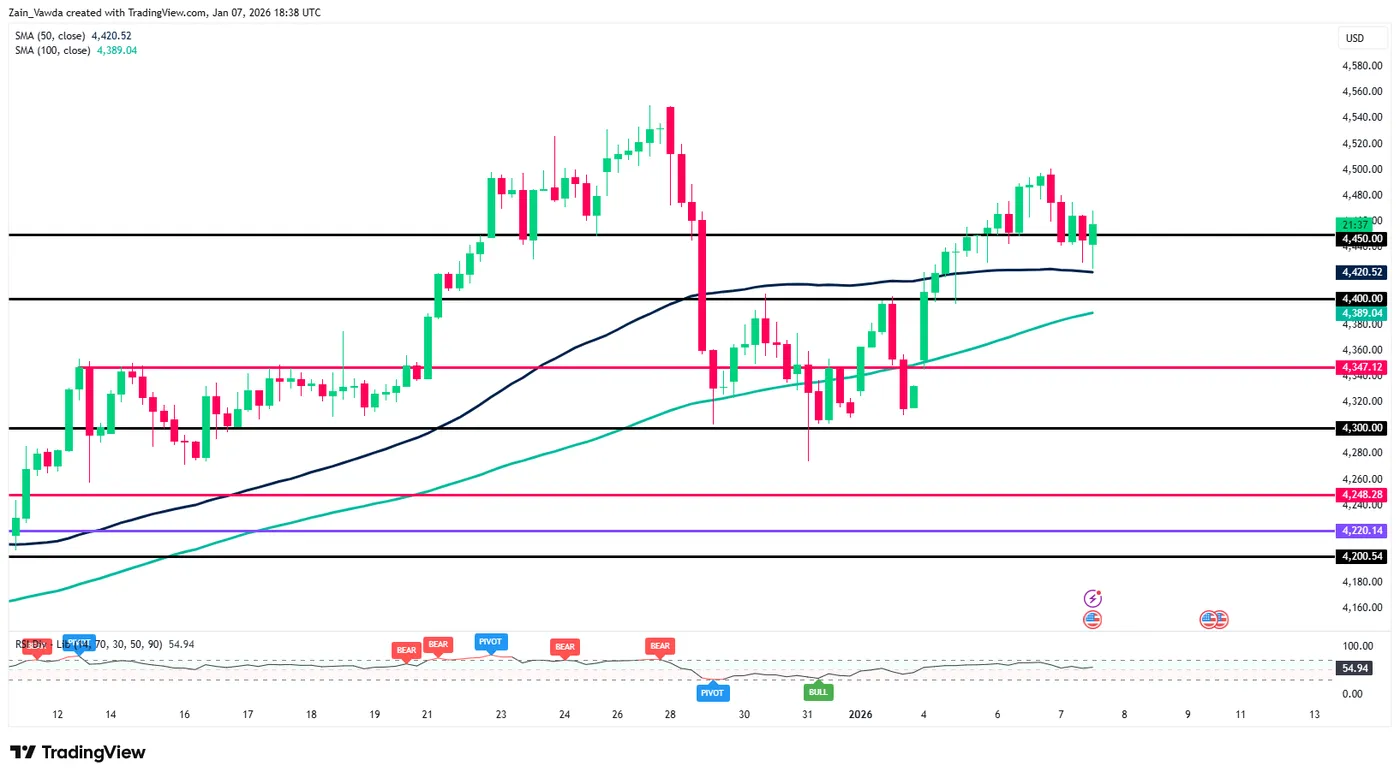
Looking at the four-hour chart below, the technical picture is intriguing to say the least..
The rally since the start of the week has failed to gain acceptance above the crucial $4500/oz level.
The selloff today however, has run into a key area of support provided by the 50-day MA which rests at $4419/oz.
Price has bounced and is now resting just around the $4450/oz handle, with the period-14 RSI also having bounced off the 50 level which hints at bullish momentum remaining in play.
As things stand buyers remain in control with significant support to the downside. The ongoing geopolitical drama is also underpinning prices.
This could all change with Friday's jobs data where a strong NFP print and a significant improvement in the unemployment rate could lead to a selloff which may threaten the $4400/oz handle.
A move lower may look to retest the weekend gap which rests between the $4332-$4354/oz handles.
Meanwhile, a move higher from here needs acceptance above the $4500/oz handle before a sustainable break of the current all-time high around $4550/oz becomes a possibility.
Gold (XAU/USD) Four-Hour Chart, January 7, 2025
Source: TradingView (click to enlarge)
NZDCAD Wave Analysis
NZDCAD: ⬆️ Buy
- NZDCAD reversed from support zone
- Likely to rise to resistance level 0.8025
NZDCAD cryptocurrency recently reversed from the support zone between the long-term support level 0.7850 (which has been reversing the price from April) and the lower daily Bollinger Band.
The upward reversal from this support zone formed the daily Japanese candlesticks reversal pattern Morning Star – which started the active impulse wave 1.
Having just broken the daily down channel from December, NZDCAD cryptocurrency can be expected to rise to the next resistance level 0.8025.

Bitcoin Wave Analysis
Bitcoin: ⬇️ Sell
- Bitcoin reversed from resistance zone
- Likely to fall to support level 87330.00
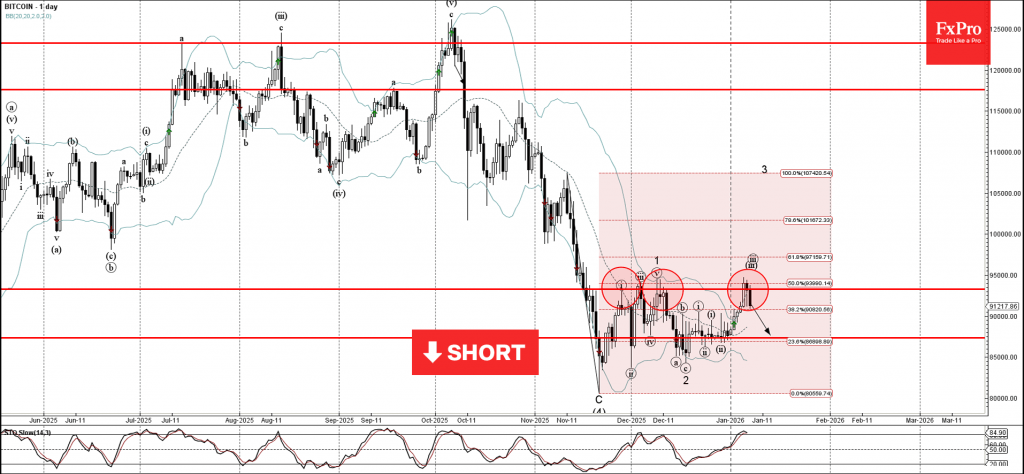
Bitcoin cryptocurrency recently reversed from the resistance zone between the strong resistance level 93285,00 (which has been reversing the price from November), upper daily Bollinger Band and the 50% Fibonacci correction of the downward impulse from November.
The downward reversal from this resistance zone will likely form the daily Evening Star – strong sell signal for Bitcoin.
Given the strong daily downtrend and the overbought daily Stochastic, Bitcoin cryptocurrency can be expected to fall to the next support level 87330.00 (low of waves ii and ii).
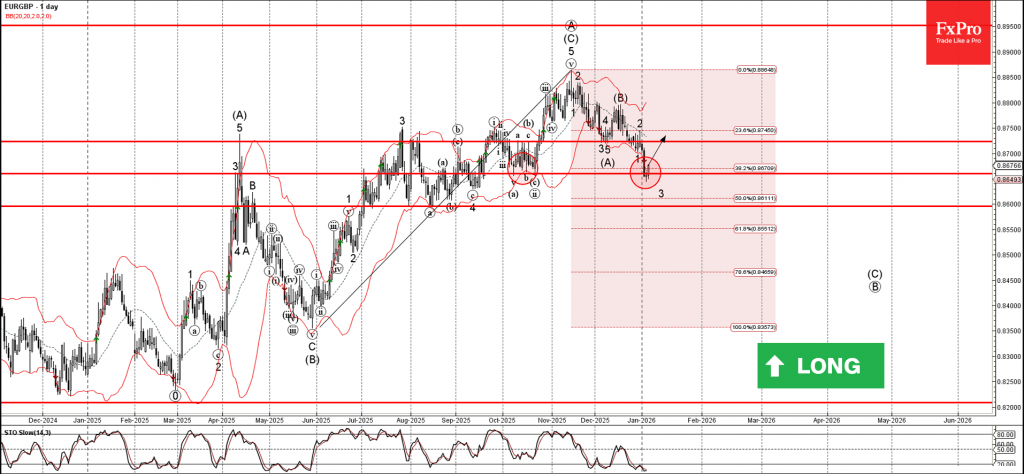
EURGBP Wave Analysis
EURGBP: ⬆️ Buy
- EURGBP reversed from support zone
- Likely to rise to resistance level 0.8725
EURGBP currency pair recently reversed from the support zone between the support level 0.8660 (former strong support from October), lower daily Bollinger Band and the 382% Fibonacci correction of the upward impulse from May.
The upward reversal from this support zone stopped the previous minor impulse wave 3 of the (C)-wave from December.
Given the strong daily uptrend and the oversold daily Stochastic, EURGBP can be expected to rise to the next resistance level 0.8725 (former support from December).
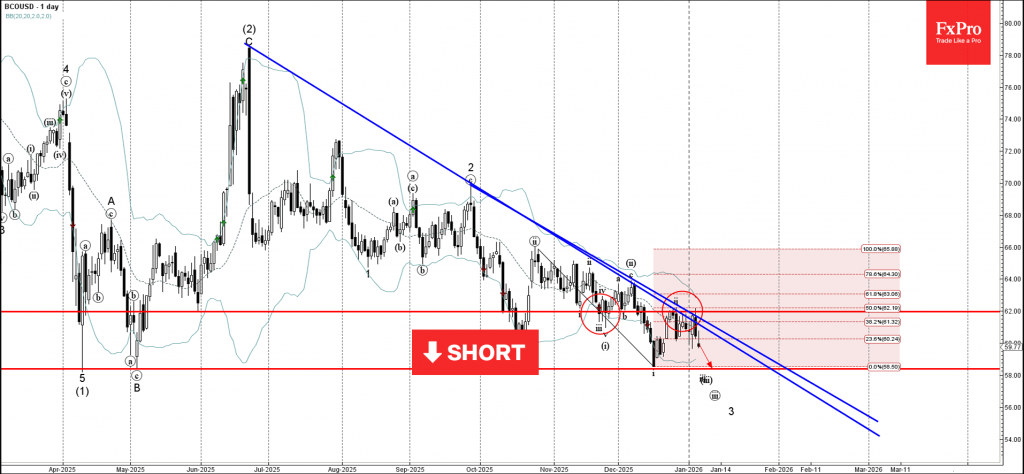
Brent Crude Oil Wave Analysis
Brent Crude Oil: ⬇️ Sell
- Brent Crude Oil reversed from resistance zone
- Likely to fall to support level 58.40
Brent Crude Oil recently reversed down from the resistance zone between the key resistance level 62.00 (former support from November) and the 50% Fibonacci correction of the downward impulse from October.
This resistance zone was further strengthened by the 2 downward sloping intersecting trendlines from September and June.
Given the clear daily downtrend, Brent Crude Oil can be expected to fall to the next support level 58.40 (which has been revering the price from April).
Oil on Discount: WTI Nosedives as Sellers Return to the Market, What’s Next?
After an initial inverse reaction—rising at the weekly open following the capture of Venezuela's Nicolas Maduro—WTI oil prices are now correcting.
The initial spike was fascinating, offering a potential blueprint for what we might expect in the event of a future Russia-Ukraine peace agreement. But why did oil go up on news that logically opens the door to more supply?
It is the effect of an inverted "Buy the Rumor, Sell the News."
Sanctioned nations like Russia and Venezuela have been forced to supply the market at deep discounts—recently reported as much as $20 below spot prices—to bypass restrictions.
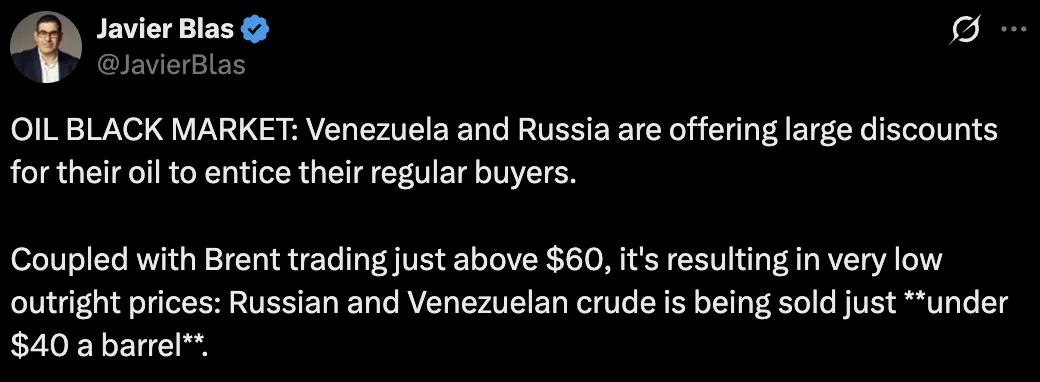
Discounts in the Oil Market – X Post from Javier Blas
When such nations regain official access to traditional markets, their competitive black market offers disappear.
This effectively removes the "cheapest" barrels from the shadow market, creating a temporary perception of tightening or, at the very least, a volatility premium. – This argument is on the backline of why Oil has been going down ever since the beginning of the Ukraine-Russia conflict and could reverse at the resolution.
The same logic applies to Iran, which is currently undergoing what resembles the beginning of a revolution.
The anti-West axis (Iran, Venezuela, Russia) has historically created a drag on oil prices by flooding the market to fund their regimes, even with restricted access. This is the "Sanctions Paradox," which I gladly invite you all to read more about.
In any case, the test of $59 was short-lived.
Sellers came right back into action to mean-revert the rebound. While higher supply from a reopened Venezuela will eventually offer stiff competition to Canadian heavy crude, this infrastructure ramp-up will take time to materialize.
Consequently, the current pullback is likely explained by the dissipation of that initial geopolitical volatility premium.
But do sellers have enough momentum to push prices to fresh lows? It's possible, but there are structural elements pointing against it.
Let's dive right into a multi-timeframe analysis of WTI Oil to see why.
US Oil Intraday Timeframe Analysis
WTI 4H Chart and Technical Levels
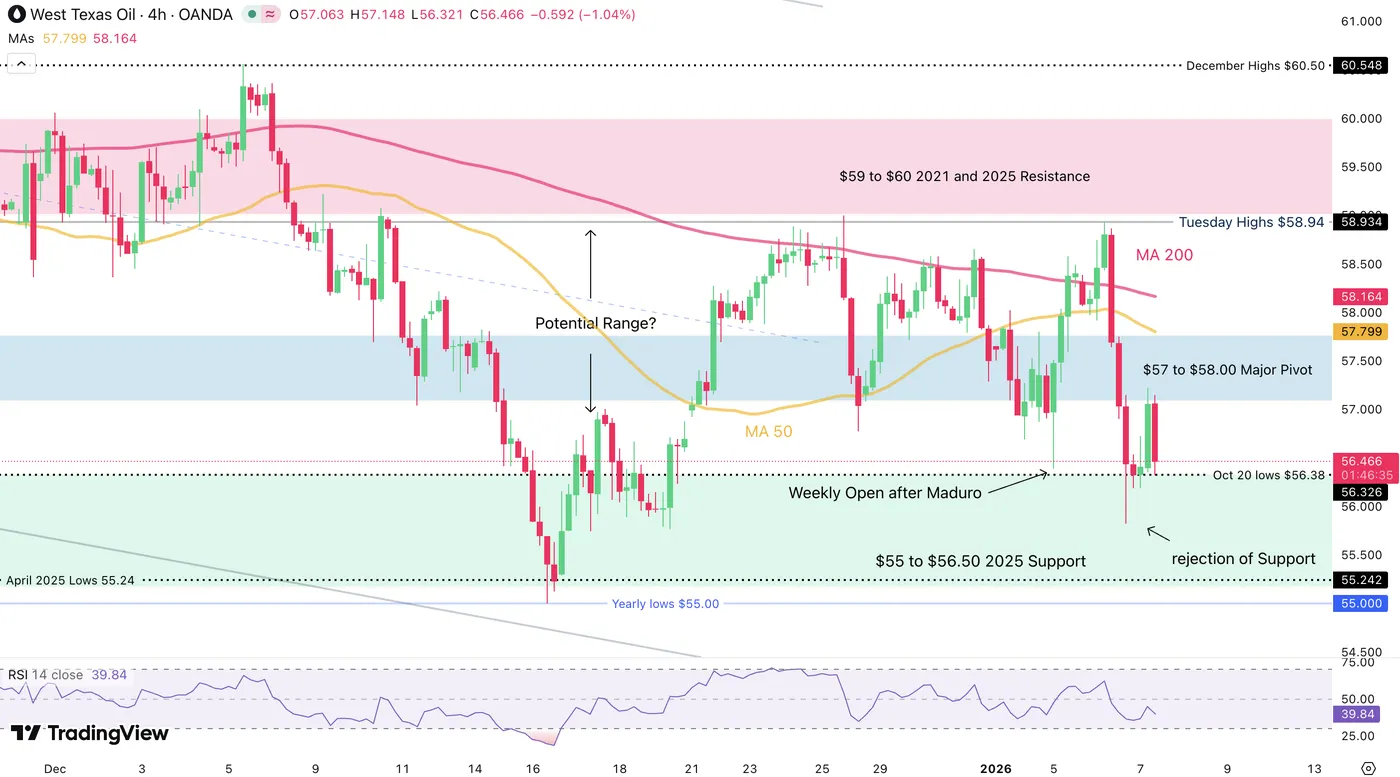
WTI Oil 4H Chart – January 7, 2026. Source: TradingView
Looking at the ongoing price action, the swift selloff has seen mean-reversion buying at the $56.50 Support.
When price action sees such sudden up and down reversals, it tends to offer strong rangebound setups for buy low, sell high setups.
Still, retesting and breaking today's lows at $55.82 would reject this hypothesis.
When traders are lost and looking for direction, ranges have high chance of forming. This takes even more ground when Moving Averages are flattening like on this chart.
Look for buying at support ($56.40 to $56.50) and profit-taking/selling between $58 to $59.
WTI Technical Levels
Levels to place on your WTI charts:
Resistance Levels
- $57 to $58.00 Major Pivot
- $58.17 4H 200-MA
- $59 to $60 2021 Resistance and Channel Highs
- Minor Resistance $62 to $63
- Key September Resistance $65 to $66
Support Levels
- $56.38 Weekly Open gap down
- $55.83 Session Lows
- $55 to $56.50 2025 Support and Channel lows
- 2019 mini support $53 to $54
- Mid-2019 Main support $51 to $52.50
30M Chart and Trading Setups
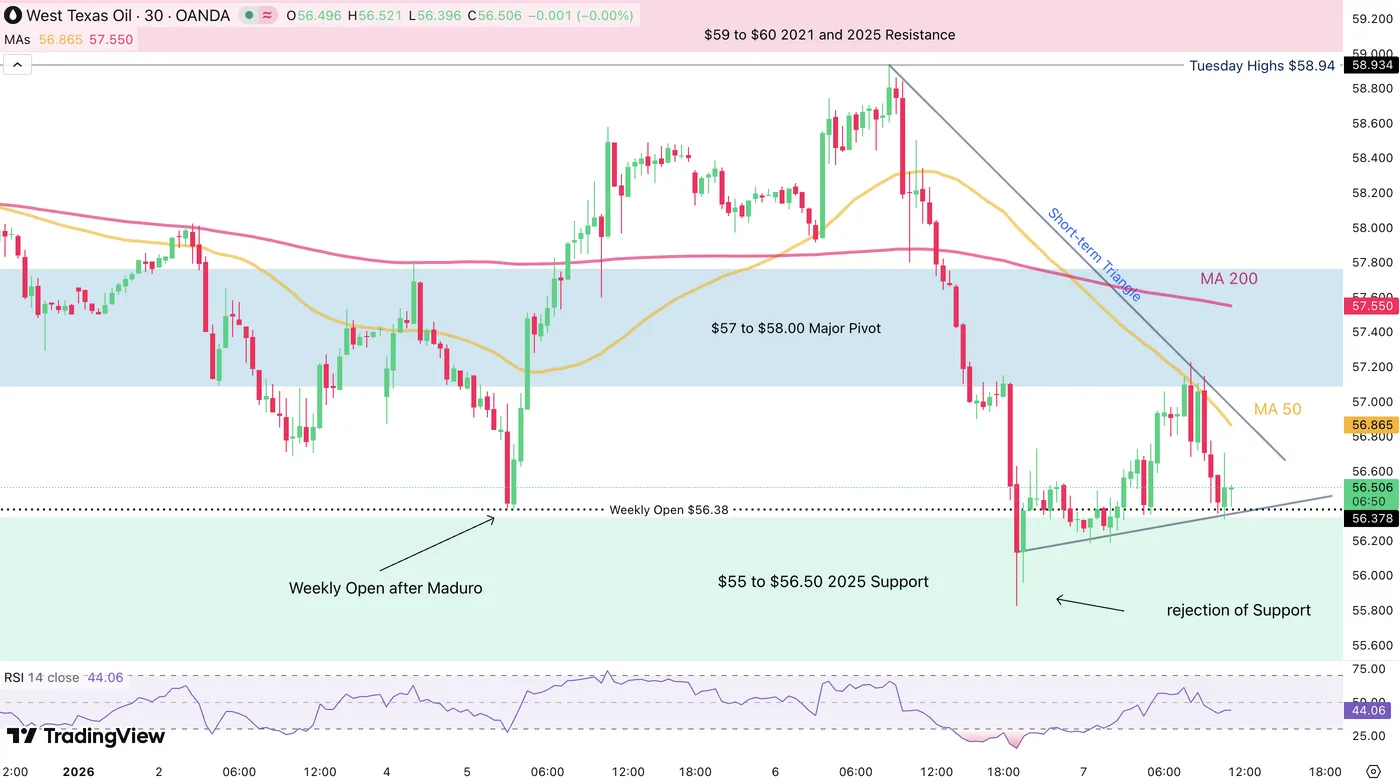
WTI Oil 30M Chart – January 7, 2026. Source: TradingView
After the bouts of volatility from this morning, the action is calming down on shorter timeframes.
Sellers are seeing some exhaustion at the session lows (coinciding with the 2025 lows support) – Still, the buying is timid and seeing rejection at the 30M 50-period MA.
For the rangebound setup, traders can look at a break above the 50 MA to get confirmation with a potential stop below the session lows or 2025 lows for more conservative positions.
Safe Trades and a Successful 2026!
What’s Next for the US Dollar After the “Freedom Trade” Surge? – DXY Outlook
Ever since correcting from its 100.00 peak in mid-November, the US Dollar has been locked in a volatile, multi-directional chop.
After a rough ride throughout 2025—particularly the first half—the Greenback has struggled to find conviction in either direction.
A 10% correction in the world's primary reserve currency was never likely to be a straight line to new decade lows.
While dedollarization was the prominent narrative of last year, reality is setting in.
With the US economy still outperforming its peers, American firms dominating global equities, and the Fed remaining persistently reluctant to cut rates, participants are realizing that divorcing the Greenback is easier said than done.
As we suggested around mid-October, the sharp correction from 110.00 to 97.00 on the Dollar Index was indeed followed by a period of consolidation, with price action settling closer to the current 98.00 to 100.00 range.
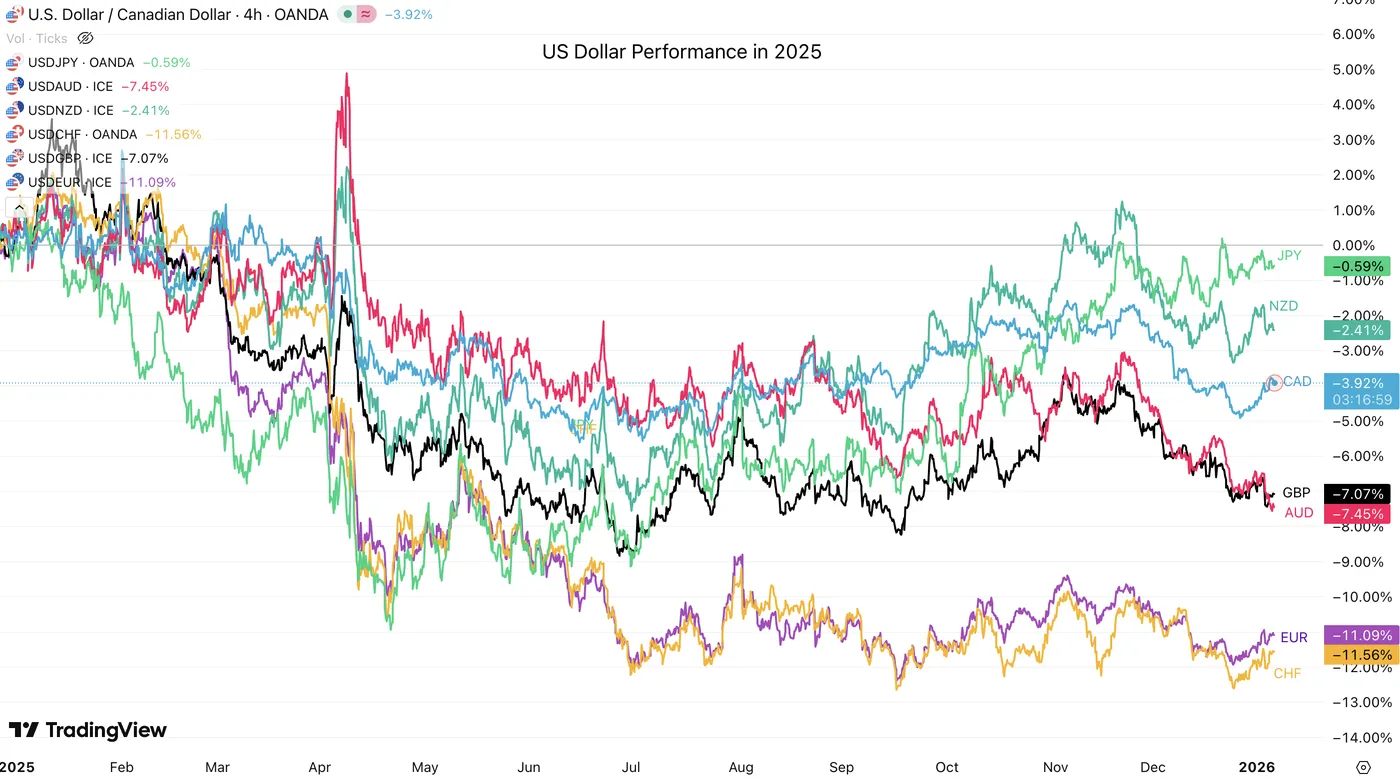
US Dollar Performance against other FX Majors in 2025 – Source: TradingView
Following the capture of Maduro and this week's explosive market open, the USD initially gave up some of its late-December rebound as global assets, particularly Stocks went ballistic.
However, a quintessential theme for FX and global trading appears to be developing: the return of "US Freedom" could trigger a fresh wave of demand for the reserve currency.
Between economic resilience and the projection of military strength to protect political interests, the US reasserting itself on the global stage is being perceived positively by traders.
We will now dive into a multi-timeframe analysis of the US Dollar Index (DXY) to decipher what the price action is hinting at and what we can expect in 2026.
Dollar Index (DXY) Multi-Timeframe Analysis
Daily Chart
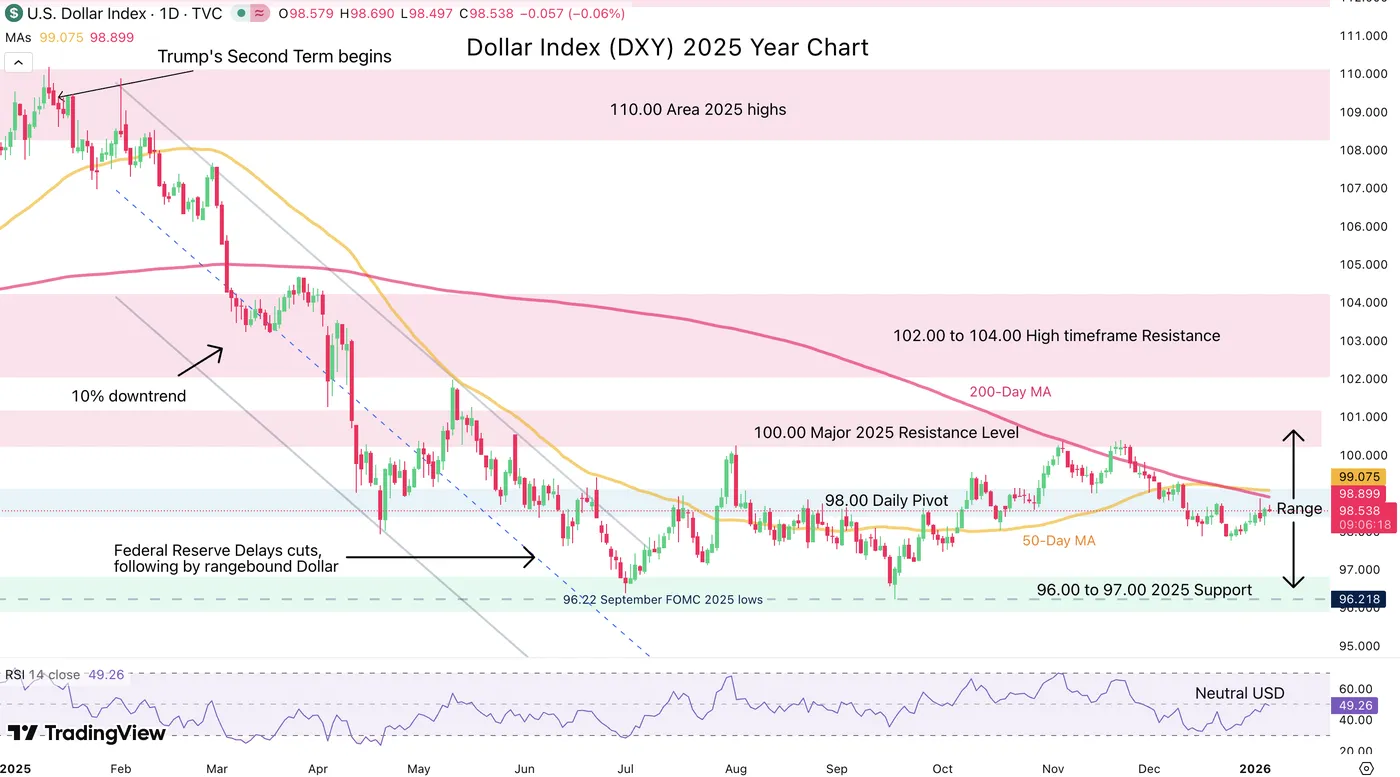
DXY Daily Chart. January 7, 2026 – Source: TradingView
The US Dollar has held its 97.00 to 100.00 range almost to the T.
What was perceived as surprising strength throughout October, as the Dollar was strengthening during the shutdown, was just mean-reversion move from a support bounce.
So what about now? The latest daily correction phase between 100.40 (Nov Highs) to the ~98.00 Handle marks a continued backlog to dollar demand.
The idea here is that with Dollar sellers failing to push the Index to its Range lows (96.00 to 97.00 Support Zone), some underlying strength is assisting the Dollar, hinting at higher chance of an upside breakout.
Still, some factors could imminently influence the Dollar so keep an eye on reactions to:
- Further menaces to other countries: An Iran intervention would be bullish for the USD while invading Greenland could lead to a major selloff.
- The Supreme Court rejecting tariffs would be a positive for the USD but may be a non-event if the Trump Administration continues
- If the Labor picture suddenly degrades and/or inflation confirms to be soft, more downside can largely be expected. More on this on Friday morning (8:30 – NFP report)
4H Chart and Technical Levels
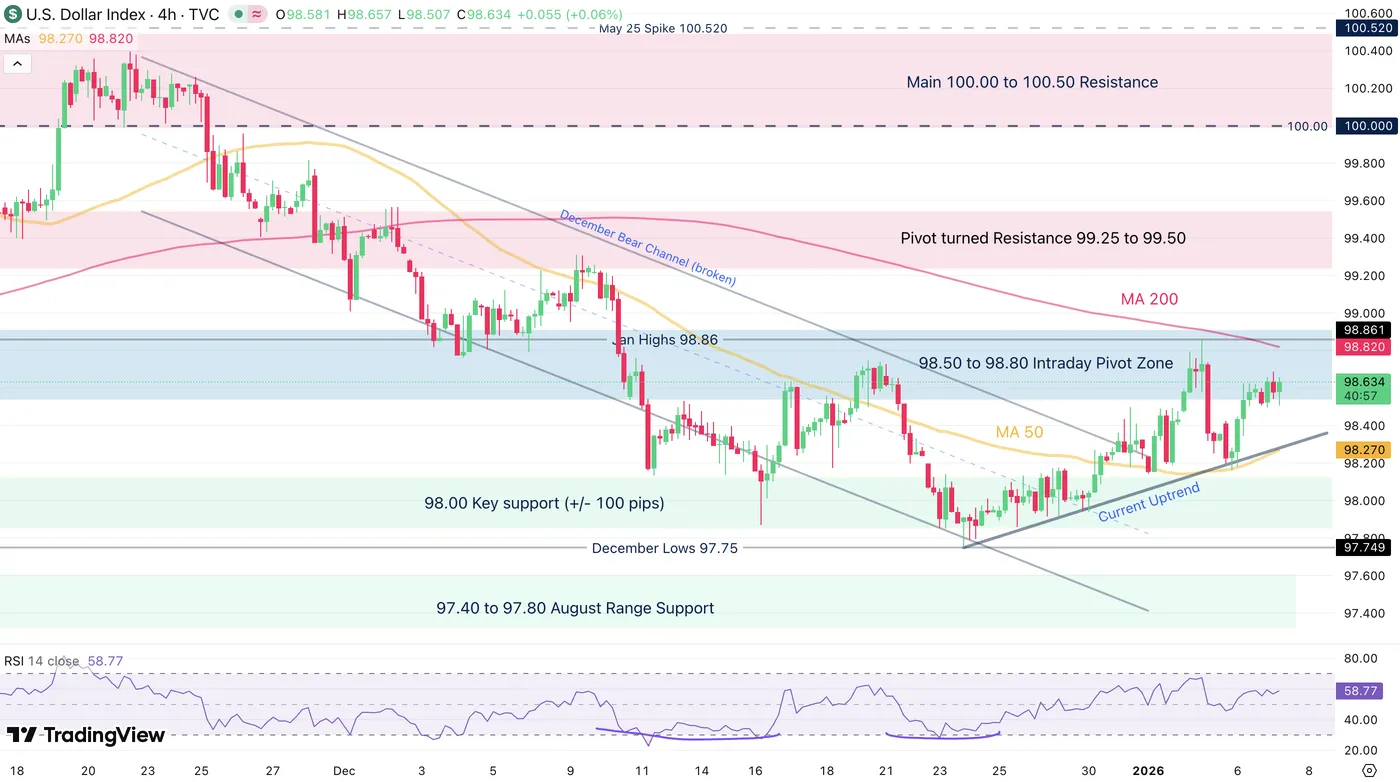
DXY 4H Chart. January 7, 2026 – Source: TradingView
Looking closer to the intraday timeframe, bulls are grabbing the advantage by holding strong demand at the upward trendline.
Having broken the downward channel, higher action could make further sense.
Still, failing to breach Monday highs at 98.85 should lead to rangebound action
Levels to place on your DXY charts:
Resistance Levels
- 98.50 to 98.80 Intraday Pivot Zone
- 98.82 (200-4H Moving Average)
- Pivot turned Resistance 99.25 to 99.50
- 100.00 to 100.50 Main resistance zone
- 100.376 November highs
Support Levels
- 98.00 Key support (+/- 100 pips) – Recent rebound
- December Lows 97.75
- 97.40 to 97.80 August Range Support
- Mini-support 98.50
- 2025 Lows 96.40 to 96.80 Support
1H Chart
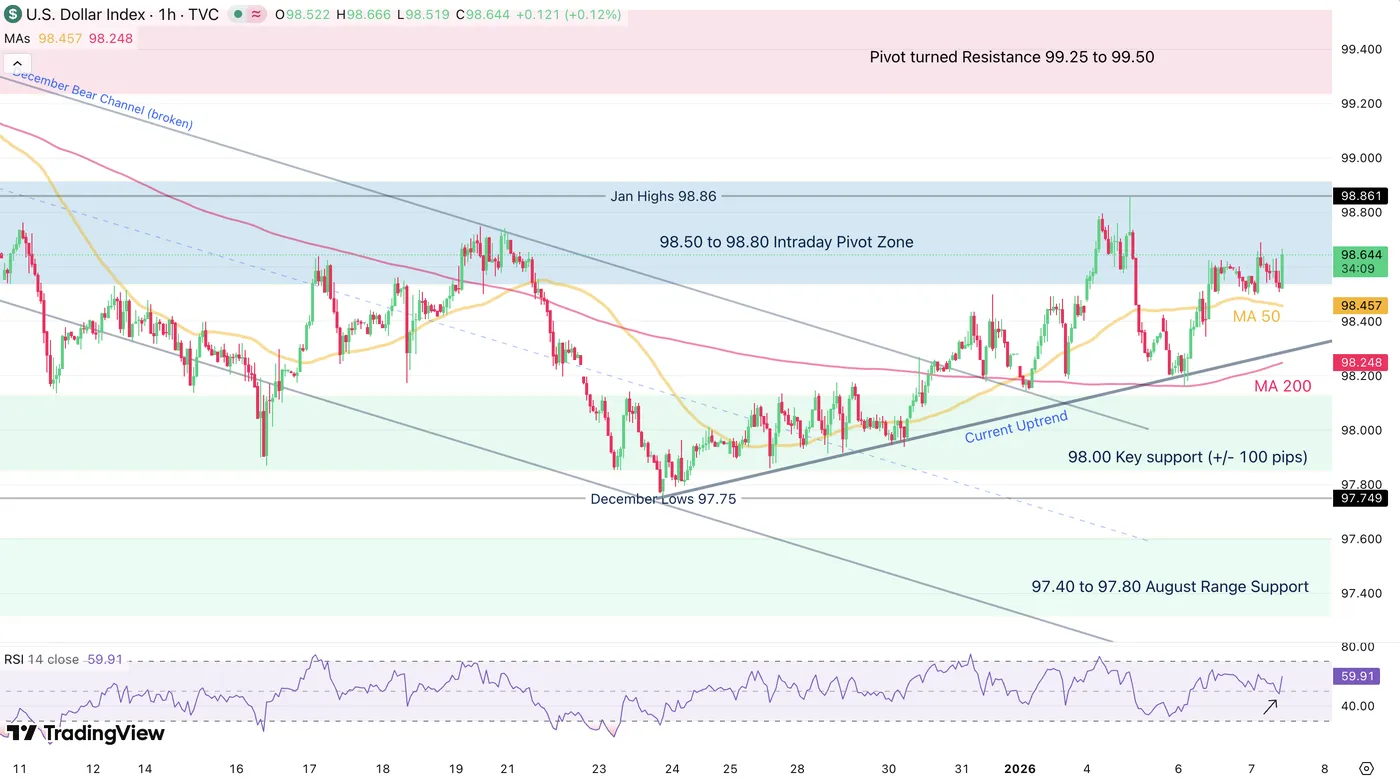
DXY 1H Chart. January 7, 2026 – Source: TradingView
The 1H Timeframe confirms the bullish action as buyers have breached both the 50 and 200-Hour Moving Averages, now acting as support.
Breaking the Monday highs at 98.85 would then not see much resistance until 99.30 to 99.50 – In this scenario, look for USD selling FX positions.
On the other hand, rejecting the Monday highs could trigger nice rangebound conditions in EUR/USD or USD/JPY. As bulls are leading an ongoing buying attempt, keep a close eye to the reactions.
Safe Trades and Happy New Year!
Implications for the crude oil market From the U.S.-Venezuela Situation
On January 3rd, the U.S. captured Venezuelan President Nicolás Maduro, expanding its economic influence particularly in Venezuela's oil sector.
On January 6th, President Donald Trump announced that Venezuela's interim authorities will turn over 30-50 million barrels of sanctioned oil worth US$2.00–2.75 billion at current market pricing. The mechanisms for (and timing of) delivery are still unclear, though Trump has stated that the oil will be shipped by storage vessels directly to U.S. unloading docks.
Oil markets have reacted slightly bearishly to this week's developments, with WTI oil prices down around 1.5% to just under $57/bbl. This is likely temporary on fears that Venezuelan oil will add to an already-oversupplied market.
We are leaving our WTI oil price forecast unchanged at $58/barrel for Q1 2026. While it is not our base case, Canadian Western Canada Select (WCS) prices may face downward pressure if Venezuelan sanctions are relaxed and demand for Canadian oil decreases. This scenario could increase the WCS discount to WTI by $2-3 per barrel, potentially reversing the positive effects from the Transmountain Pipeline Expansion, which had helped compress the spread over the past year.
The Numbers in Context
The current global oil surplus is estimated at 2-2.5 million barrels per day (bpd). Economically, this one-off oil flow of 30-50 million barrels would not materially impact market balances.
These barrels represent about 30 to 50 days of Venezuela's current oil production, which is around 1 million/bpd. Due to sanctions, underinvestment, and outdated infrastructure, Venezuela produces far less than its historical highs of 3-3.5 million/bpd. Increasing output would require several years and billions of dollars in investment.
With nearly 20 million/bpd consumed in the U.S., this new oil supply represents approximately two and a half days of national usage.
Does This Have an Impact on Canada?
In the near-term, this is likely a low-impact event for Canada.
- Any imports of Venezuelan oil to the U.S. would compete directly with Canadian crude in the U.S. Gulf Coast market, which currently receives only 10% (~400k/bpd) of total Canadian shipments to the U.S.
- A more probable outcome is that only a limited portion of Canadian oil would be substituted, with relatively modest impacts on the national economy. Alberta could experience more significant effects, but only in the event of a complete near-term and sustained transition to Venezuelan oil in the Gulf Coast.
Total Canadian crude exports to the United States are around four times greater than Venezuelan exports, with ~70% of that consumed in the U.S. Midwest. The U.S. Midwest (PADD II) imports almost exclusively from Canadian sources due to existing pipeline infrastructure. For Venezuelan crude to reach the Midwest, extensive modifications to pipelines would be required to enable south-to-north flow—a process that presently does not make much economic sense and that would require significant time to implement.
Longer-term, significant U.S. investment would be needed to boost oil output and increase pipeline capacity in Venezuela. This strengthens the case for Canada to expedite a new oil pipeline that builds out capacity for Asian shipments. China, the number one buyer of Venezuelan crude, may need to strategically reorient their import sources, further buoying the case for Canada to diversify its energy trade.