

Sample Category Title
Bitcoin (BTC), Ethereum (ETH) and SOL Rebound Strongly to Start 2026 – Crypto Overview
Cryptocurrencies have been getting whiplashed, with investors noting a stark contrast: despite immense growth in Stock Indexes and Metals, the year-over-year performance for Bitcoin in 2025 was actually negative.
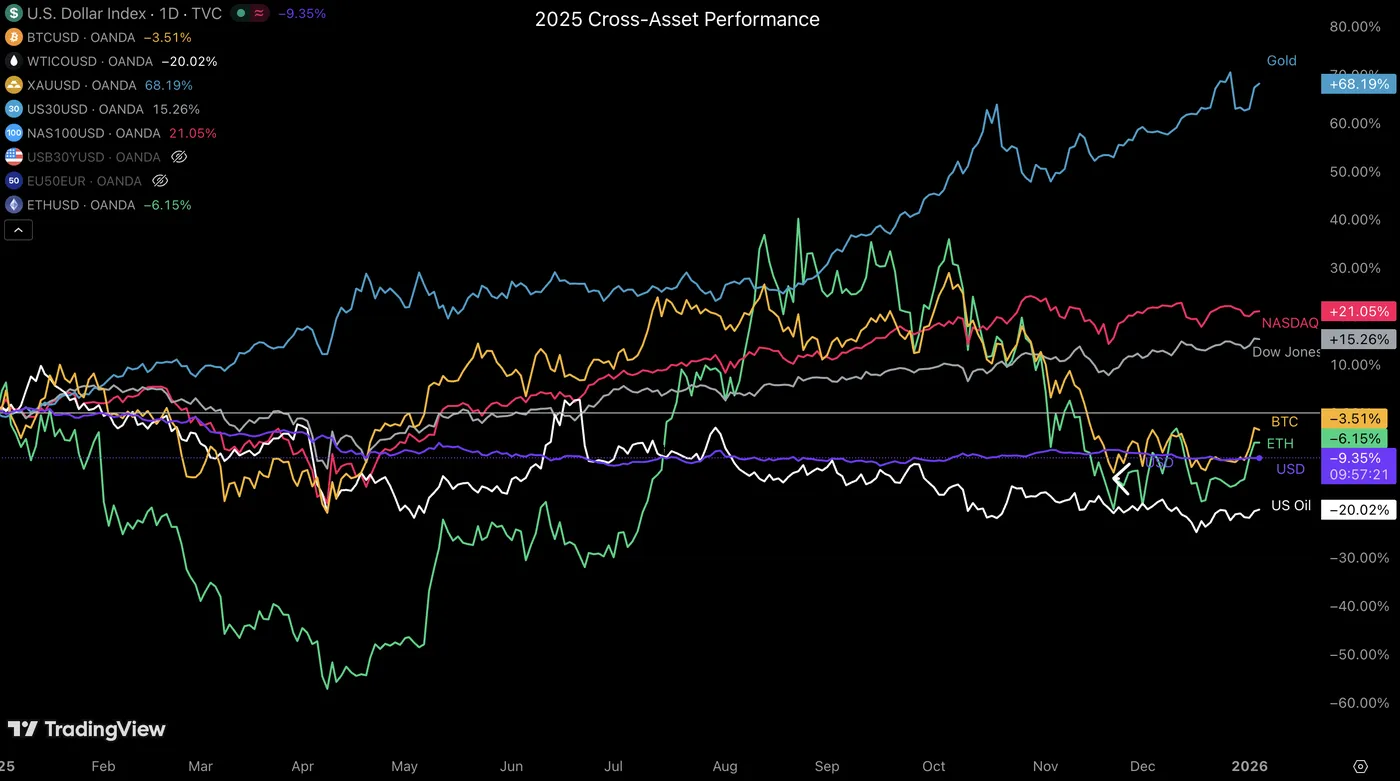
Cross-Asset Market Performance in 2025 – Source: TradingView
But this headline carries a significant bias.
First, year-over-year change fails to capture the total volatility and opportunity within the period. Bitcoin, for example, surged from $75,000 to a new record high of $126,000—a 70% rise from trough to peak.
Traders with a solid game plan who capitalized on these swings fared far better than the yearly close suggests.
It is also worth remembering that the crypto pioneer is still up a staggering 480% since its 2023 lows and 123% since 2024, despite finishing 2025 down 3% overall.
In a similar vein, Ethereum experienced high-volatility flows, rallying 250% to reach new all-time highs of $4,950 in August before correcting.
While it closed the year down roughly 3% compared to January 1st, 2025, it remains up 260% from its 2023 lows.
With the implementation of the Fusaka upgrade—enabling significantly cheaper transaction costs and higher efficiency—the second-largest cryptocurrency could see a fundamental "demand floor" that would act as cushion against more downside.
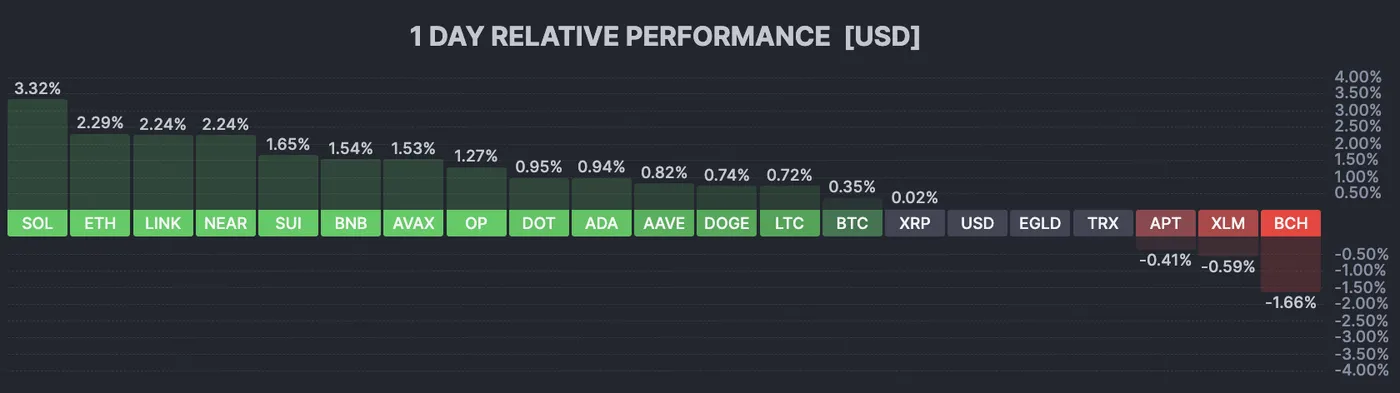
Current Session in Cryptos – January 6, 2026 (10:30). Source: FInviz
Furthermore, Bitcoin wasn't the only game in town. Several altcoins posted remarkable gains in 2025, decoupling from the majors.
- Binance Coin (BNB): Up 40%.
- Monero (XMR): Up 136%.
- ZCash (ZEC): Up a massive 860%.
The most successful traders were those who leveraged these swift gains, cashing out at relative highs before re-entering at the recent lows.
The question now is where things go in 2026. Risk appetite remains stable, so in the absence of violent volatility, regular discounted cash flows into cryptocurrencies make sense at these levels. You can check our
Solana, for instance, could present an interesting alternative, currently trading 50% off its lows.
Let's dive right into the Daily Charts and technical levels for Bitcoin (BTC), Ethereum (ETH), and Solana (SOL).
A quick Glance at the Crypto Market Cap from 2019 to 2026
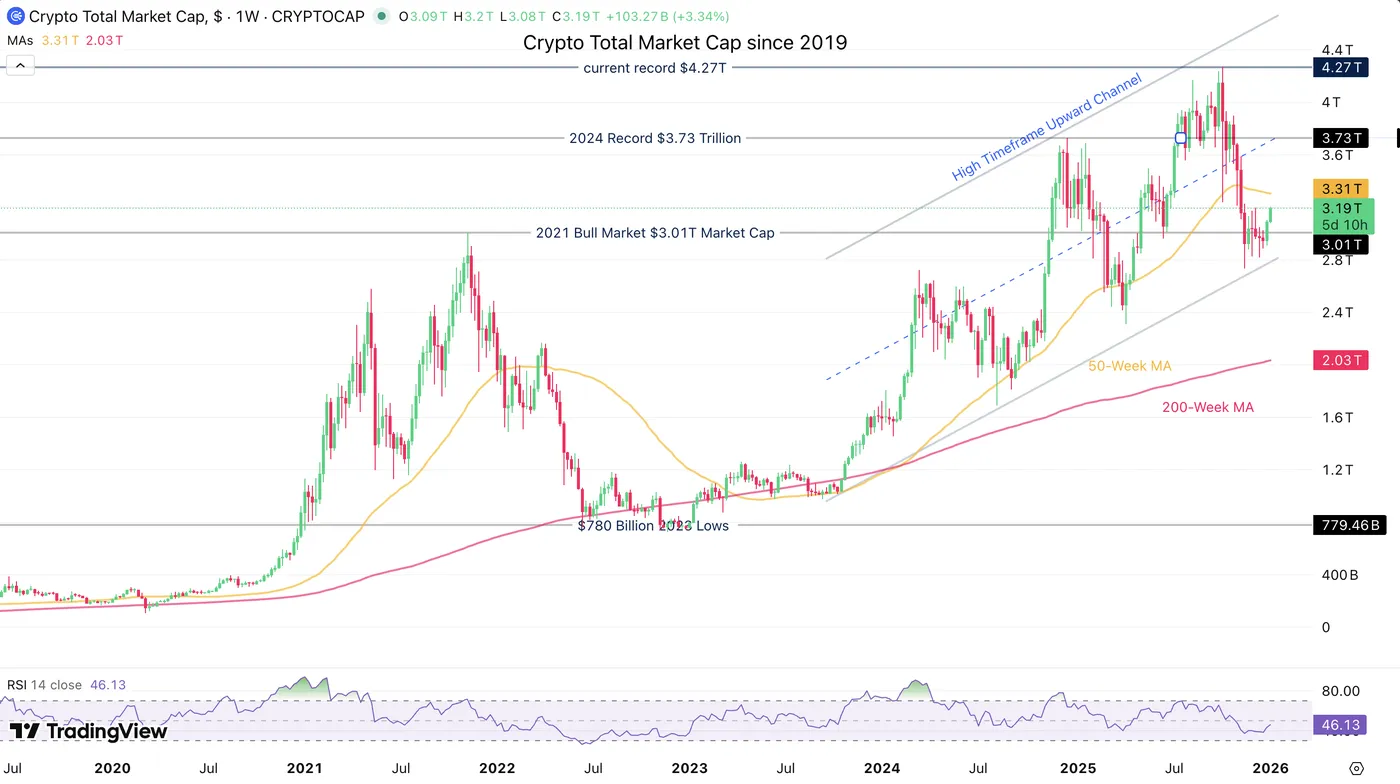
Total Crypto Market Cap Weekly Chart, rebounding from its Channel lows – Source: TradingView
Keep an eye on if the rebound on the higher timeframe upward channel triggers further buying from here.
Overall, the Crypto Market remained very resilient at its lower bound.
Bitcoin (BTC) Daily Chart and Technical Levels
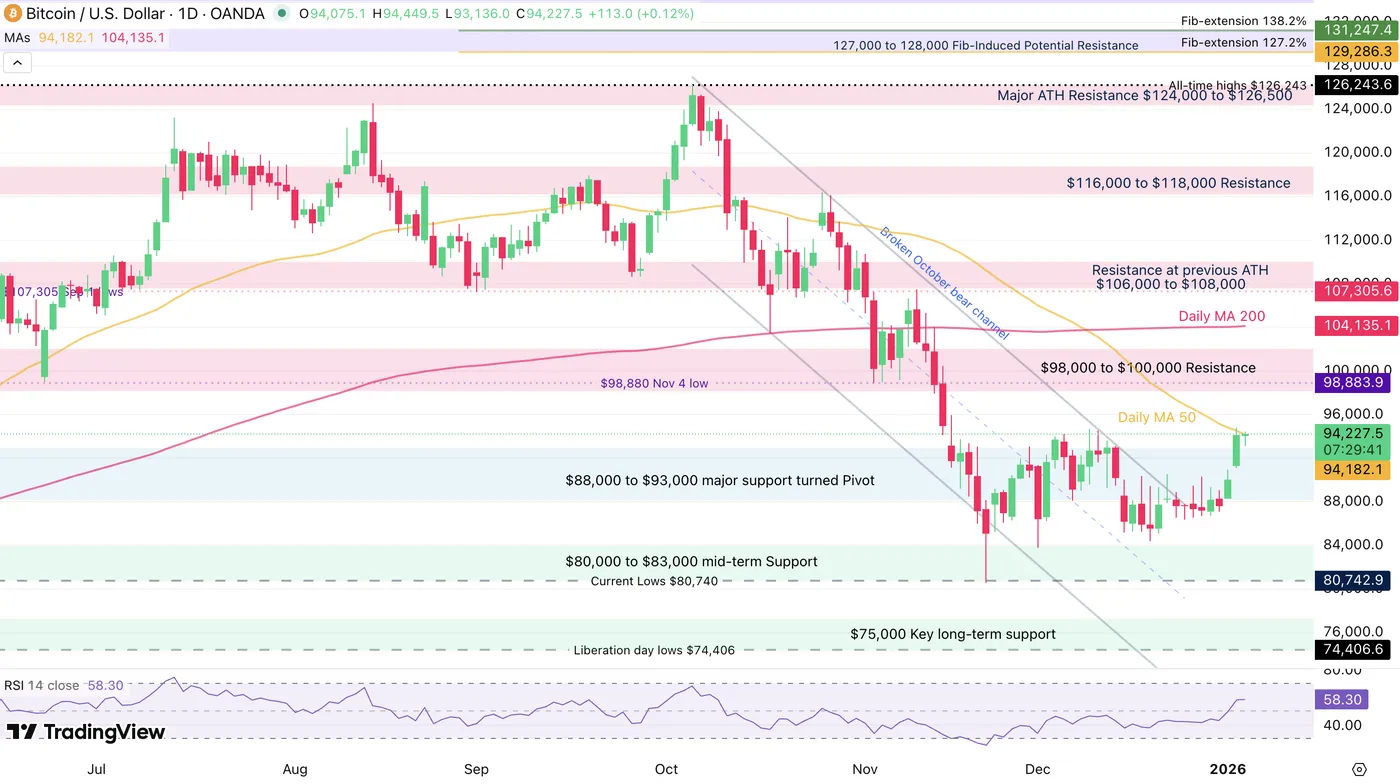
Bitcoin (BTC) Daily Chart, January 6, 2026 – Source: TradingView
Bitcoin is getting back on a bullish momentum but faces a key test at its 50-Day Moving Average, currently at $94,180.
Closing above on the daily would further confirm its breakout beyond its harsh October downtrend. The main Crypto is still not out of its neutral outlook until it breaches the $100,000 level again.
Levels of interest for BTC trading:
Support Levels:
- $88,000 to $93,000 major support turned Pivot
- Current Weekly Lows $89,340
- $85,000 mid-term Support (+/- $1,500)
- $75,000 Key long-term support
Resistance Levels:
- $94,170 50-Day MA
- $98,000 to $100,000 Resistance
- $104,000 200-Day MA
- Resistance at previous ATH $106,000 to $108,000
- Current ATH Resistance $124,000 to $126,000
Ethereum (ETH) Daily Chart and Technical Levels
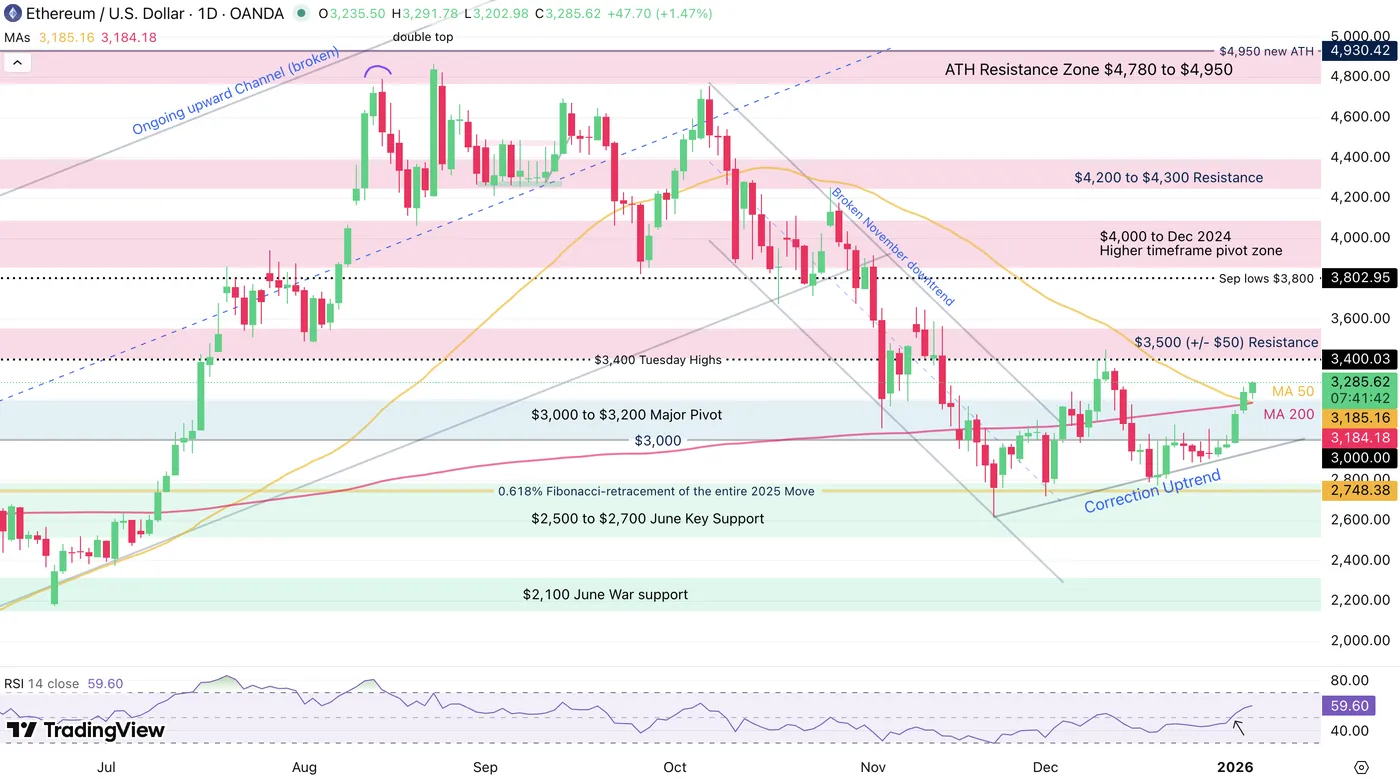
Ethereum (ETH) Daily Chart, January 6, 2026 – Source: TradingView
Ether is actually the most bullish-looking crypto out of all major altcoins., also getting a fundamental boost from its recent upgrade.
Having breached the $3,000 key psychological level and holding above, buyers are forming a bull uptrend above the 50 and 200-Day Moving average – Watch how the bullish trendline holds.
Levels of interest for ETH trading:
Support Levels:
- 50 and 200 Day Moving Averages
- $2,500 to $2,700 June Key Support (November lows)
- $2,620 Session and weekly Lows
- $2,100 June War support
- $1,385 to $1,750 2025 Support
- 2025 Lows $1,384
Resistance Levels:
- $3,000 to $3,200 Major momentum Pivot (Test of the $3,000)
- $3,500 (+/- $50) Resistance and Descending Channel highs
- $3,800 September lows
- $4,000 to Dec 2024 top Higher timeframe Resistance zone
- $4,950 Current new All-time highs
Solana (SOL) Daily Chart and Technical Levels
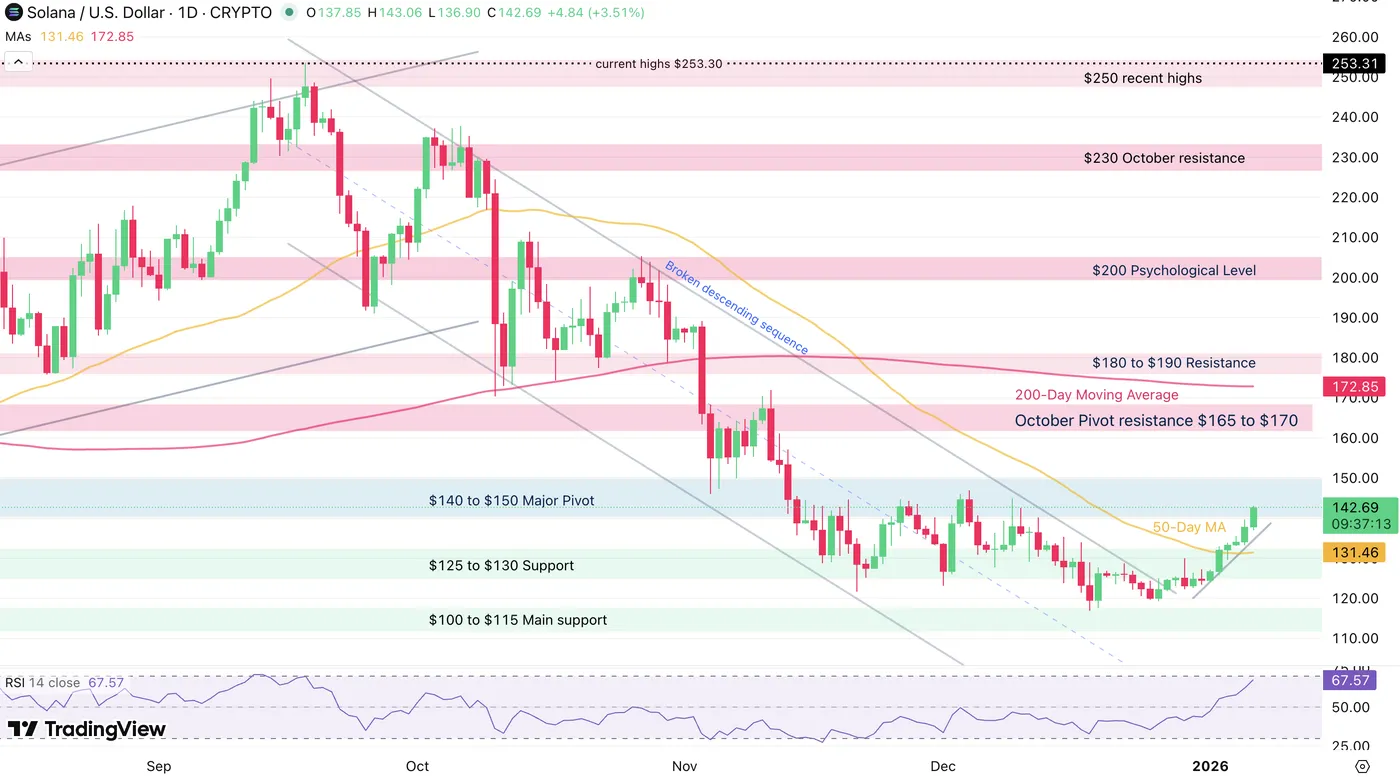
Solana (SOL) Daily Chart, January 6, 2026 – Source: TradingView
The rebound in Solana is looking very decent but still faces key hurdles ahead.
With the price action getting bullish from a 3-month consolidation, bulls will want to break above $150 to relaunch bullish prospects and hold the upward trendline.
Levels to keep on your SOL Charts:
Support Levels:
- Main Support $125 to $130
- Weekly lows $123
- $100 to $115 Main support
Resistance Levels:
- $140 to $150 Major Pivot (testing)
- Channel highs and October Pivot resistance $165 to $170
- $180 to $190 Resistance
- Psychological level $200 to $205
- $253 Cycle highs
Safe Trades and Happy New Year!
Sunset Market Commentary
Markets
Richmond Fed Barkin is the next governor to share his personal view on policy going forward. He doesn’t have a vote on the FOMC board this year. Barkin is watching both sides of the Fed’s mandate with policy now within the range of estimates for neutral. He’s looking forward to first “clean” data in coming weeks as effects from the lengthy government shutdown subside. Barkin’s balanced view align with the ones of Philly Fed Paulson over the weekend. Paulson sees modest further adjustments later this year. Her comments matter more as she rotates into a voting FOMC seat. That regional rotation is a hawkish one this year with Cleveland Fed Hammack (preference to be slightly more restrictive to help continue put pressure on inflation), Dallas Fed Logan (spoke out against December 25 bps rate cut; only willing to cut further if there is clear evidence that inflation will hall faster than expected or the labor market cools more rapidly) and Minneapolis Fed Kashkari (pretty close to neutral right now) filling the other seats. These more hawkish views balance the more dovish board of governors but in the end, the latter will still be able to outvote the former of course if necessary.
Eco data were confined to national European inflation numbers today. Both French and German price increases were weaker than feared in December. French CPI rose by 0.1% M/M (vs 0.2% consensus) and 0.7% Y/Y. Unchanged German prices compared with November pulled the annual figure down more than hoped (2% Y/Y from 2.6% vs 2.2% expected). Spanish inflation, already released at the end of last year, came in in line with forecasts at 0.3% M/M and 3% Y/Y. German Bunds outperformed US Treasuries today with the move starting after first softer regional German CPI prints. German yields fall by 2.5 bps across the curve compared with 1-2 bps increases in the US. The lower inflation print and likely benign inflation (base) effects at the start of the year might bring the more dovish ECB members in the picture with money markets currently being extremely neutral positioned. This makes the front end of the European curve and the euro, ceteris paribus, vulnerable to guarded corrections lower. We nevertheless stick to the view that the current 2% ECB deposit rate will serve as a bottom. EUR/USD today drifted back from 1.1740 to 1.17.
The Kingdom of Belgium today announced its intention to issue a new 10-yr benchmark (OLO 106 June2036) via syndication in the near future, likely tomorrow. It’s the first of three planned new benchmark deals with the debt agency (BDA) also suggesting a new 5-yr OLO and a longer dated one (depending on market conditions) later this year. These syndications should help cover this year’s record €59.55bn gross borrowing requirement (net requirement: €26.37bn). To finance these needs, the BDA mainly relies on long term funding. They look to issue €51.6bn of OLO’s. That’s a significant mark-up (+€5.9bn) compared to last year’s €45.7bn and breaks with four consecutive years of relative stable OLO issuance (€43.2-45.7bn). A quick look at the Belgian redemption profile learns that €50bn+ OLO issuance is here to stay given that we don’t expect a marked improvement in budget deficit dynamics. The next nine years, annual redemptions exceed this year’s €28bn with the exception of more or less matching numbers in 2030 and 2032. Especially 2028 will be a challenging year with a record €38bn outstanding. The BDA could already lift pre-financing next year to prepare for this funding cliff.
News & Views
The Czech Finance Ministry today reported on 2025 central state budget data. The CZK 290.7bn budget deficit was the outcome of CZK 2081.1bn in revenue and CKZ 2371.8bn in expenditure. The result compared to an initial budget deficit target of CZK 241bn and also marks a rise compared to the 2024 deficit at CZK 271.4bn. According to Finance Minister Alena Schillerova, the overshoot in the budget deficit was due to a an underestimation of expenditures on renewable energy sources in the budget of the previous government, an overestimate of revenues from the sale of emission allowances and higher expenditure on education. Aside from the 2025 budget data, the Czech Finance Ministry also published the framework of its 2026 funding and debt management strategy. The report shows refinancing needs for state debt redemptions amounting to CZK 423.6bn. After the approval of the draft State Budget Act of the Czech Republic for 2026, expected later this month, an update will be published. The Ministry of Finance will then quantify the total financing needs including interest expenditures of the state budget in 2026.
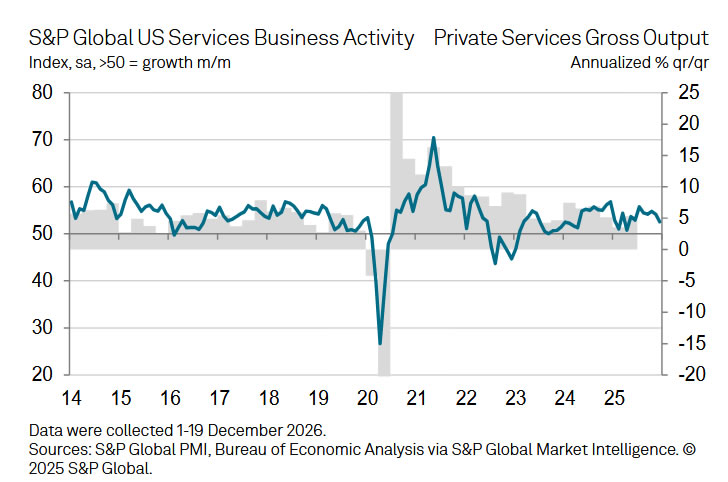
US PMI composite finalized at 52.7, cracks beneath resilient growth story
US service sector momentum softened at the end of 2025, with Services PMI finalized at 52.5 in December, down from 54.1 in November and the lowest level in eight months. Composite PMI also eased to 52.7 from 54.2, pointing to slower but still expansionary growth as the year closed.
According to S&P Global Market Intelligence Chief Business Economist Chris Williamson, the resilience of the US economy is showing “signs of cracking.” New business growth at services firms was the weakest in nearly 20 months, while manufacturing orders fell for the first time in a year, signalling "broad-based weakening of demand growth".
The surveys also flagged emerging labor market stress, with companies cutting headcounts outnumbering those hiring for the first time since February. Future output expectations have dropped sharply compared with early 2025, raising concern that December’s slowdown and job market malaise "could spill over into the new year".
At the same time, firms reported rising tariff-related cost pressures, heightening the risk of "slower economic growth and stubbornly high inflation" at the start of the new year.
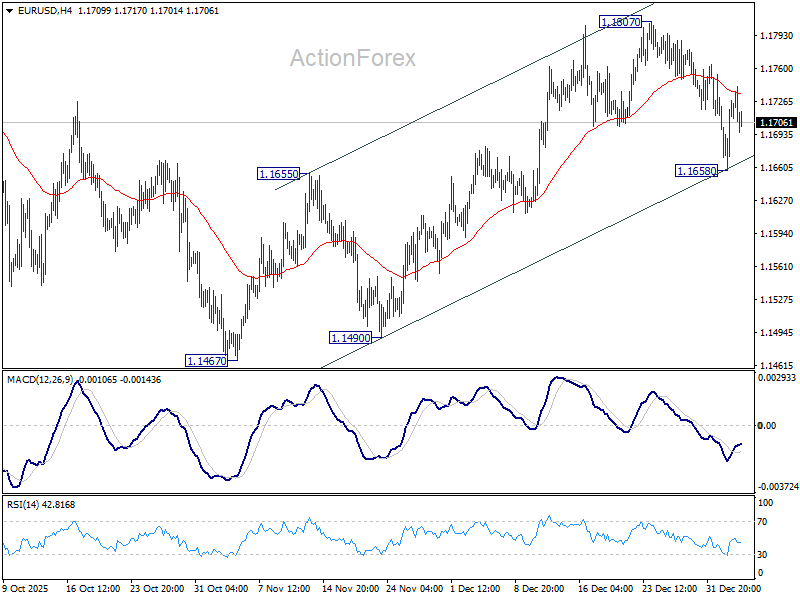
EUR/USD Mid-Day Outlook
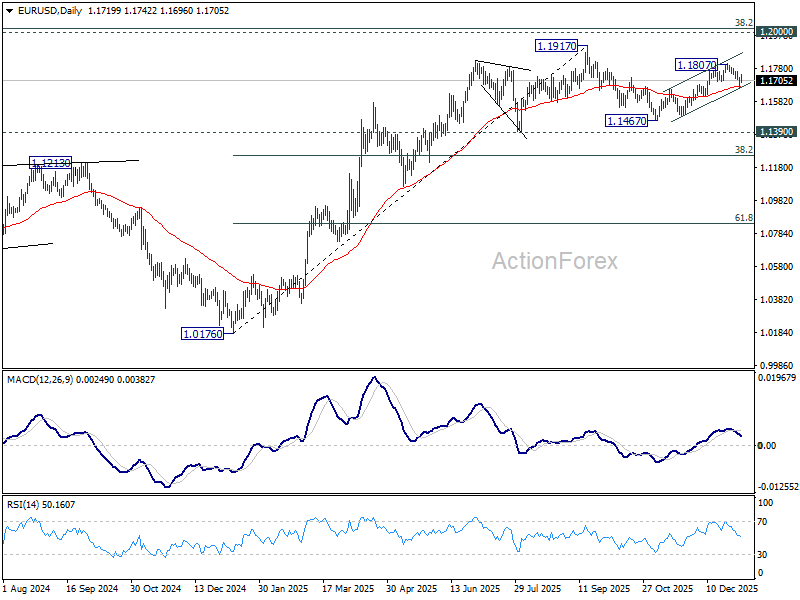
Daily Pivots: (S1) 1.1678; (P) 1.1703; (R1) 1.1748; More….
Intraday bias in EUR/USD remains neutral for the moment. Rise from 1.1467 could still be in progress. Firm break there will resume the rally to retest 1.1917 high. However, break of 1.1658 support will target 1.1467, as corrective pattern from 1.1917 has started the third leg.
In the bigger picture, as long as 55 W EMA (now at 1.1408) holds, up trend from 0.9534 (2022 low) is still in favor to continue. Decisive break of 1.2 key psychological level will carry larger bullish implication. However, sustained trading below 55 W EMA will argue that rise from 0.9534 has completed as a three wave corrective bounce, and keep long term outlook bearish.
GBP/USD Mid-Day Outlook
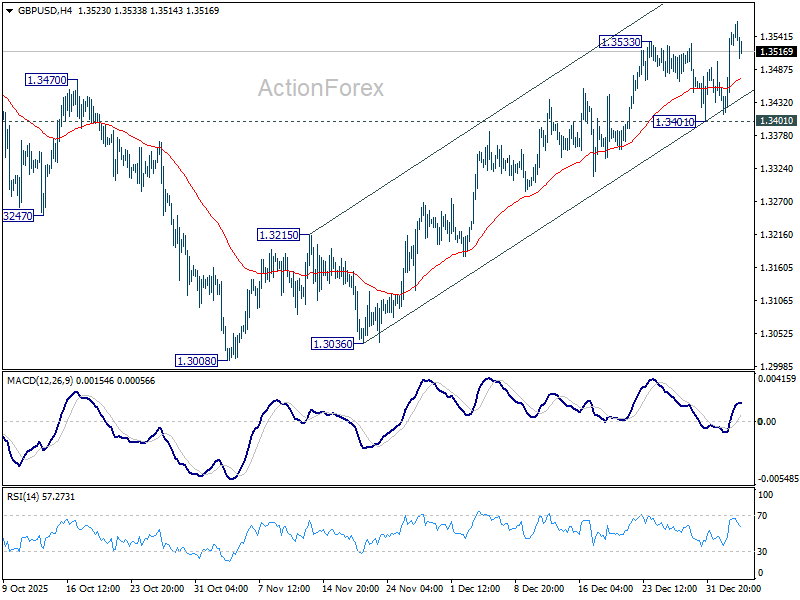
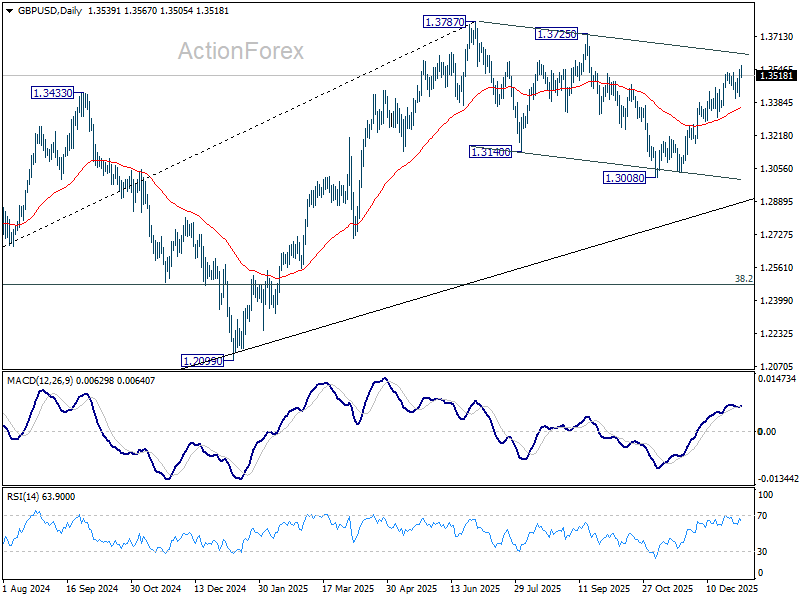
Daily Pivots: (S1) 1.3454; (P) 1.3502; (R1) 1.3589; More...
Intraday bias in GBP/USD remains on the upside for the moment. Current rally from 1.3008 is in progress for retesting 1.3787 high. Near term outlook will stay bullish as long as 1.3401 support holds, in case of recovery.
In the bigger picture, current development suggests that fall from 1.3787 is merely a corrective move, and larger rise from 1.0351 (2022 low) is still in progress. Firm break of 1.3787 will target 1.4248 (2021 high) key structural resistance. This will remain the favored case as long as target 38.2% retracement of 1.0351 to 1.3787 at 1.2474 holds, in case of another fall.
USD/JPY Mid-Day Outlook
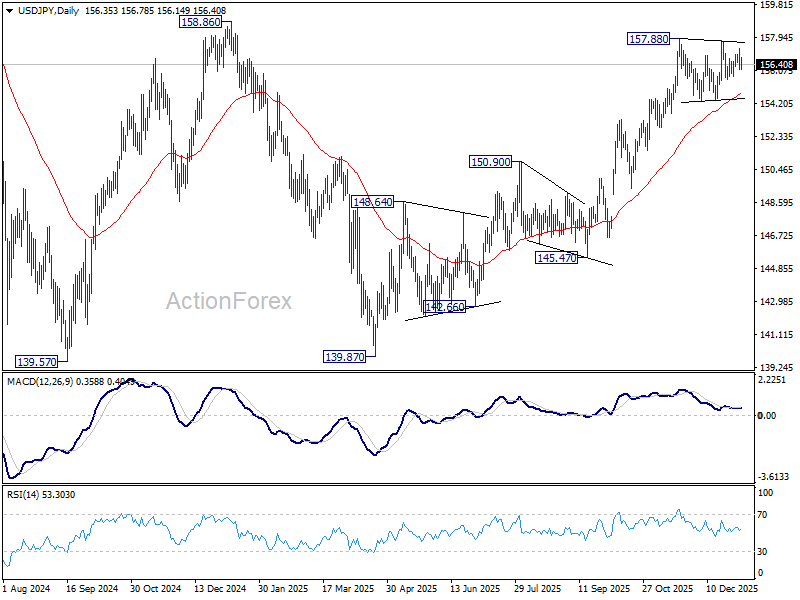
Daily Pivots: (S1) 155.91; (P) 156.61; (R1) 157.09; More...
No change in USD/JPY's outlook as sideway consolidation from 157.88 continues. Intraday bias stays neutral at this point. Outlook will stay bullish as long as 154.33 support holds. On the upside, firm break of 158.85 key structural resistance will be an important medium term bullish sign. Next target will be 161.94 high. However, decisive break of 154.38 will turn bias to the downside for deeper correction.
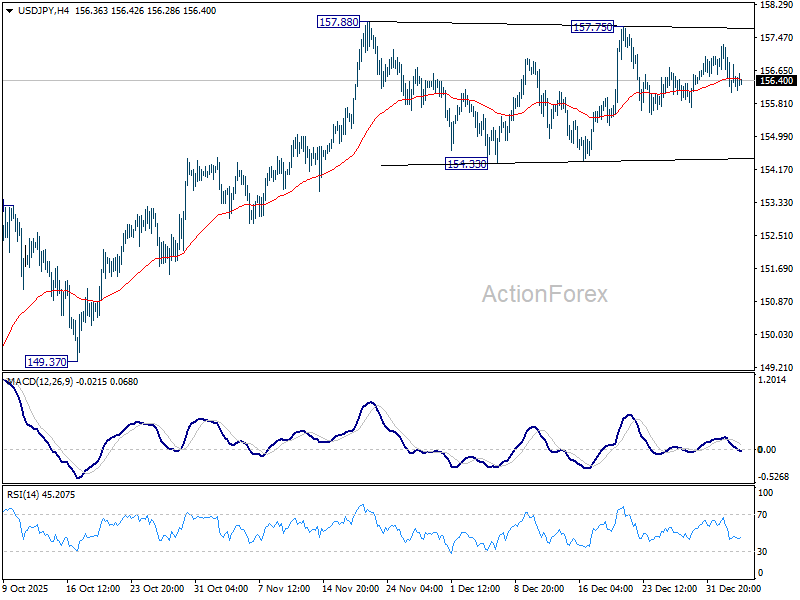
In the bigger picture, corrective pattern from 161.94 (2024 high) could have completed with three waves at 139.87. Larger up trend from 102.58 (2021 low) could be ready to resume through 161.94 high. Decisive break of 158.85 structural resistance will solidify this bullish case and target 161.94 for confirmation. On the downside, break of 150.90 resistance turned support will dampen this bullish view and extend the corrective range pattern with another falling leg.
USD/CHF Mid-Day Outlook
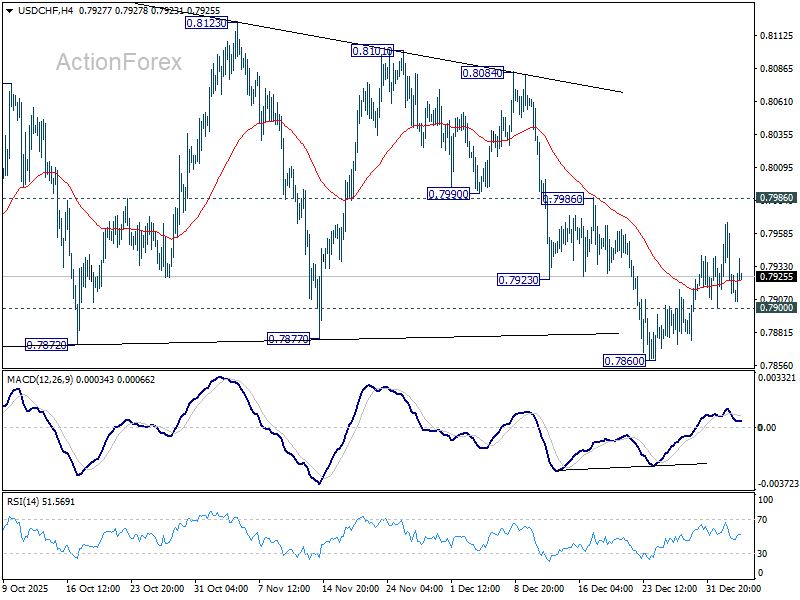
Daily Pivots: (S1) 0.7897; (P) 0.7932; (R1) 0.7952; More….
Intraday bias in USD/CHF stays neutral for the moment. Further decline is mildly in favor with 0.7986 resistance intact. On the downside, below 0.7900 minor support will turn bias to the downside. Break of 0.7860 will target a retest on 0.7828 low. However, break of 0.7986 will argue that corrective pattern from 0.7828 is still extending with another rising leg already in progress.
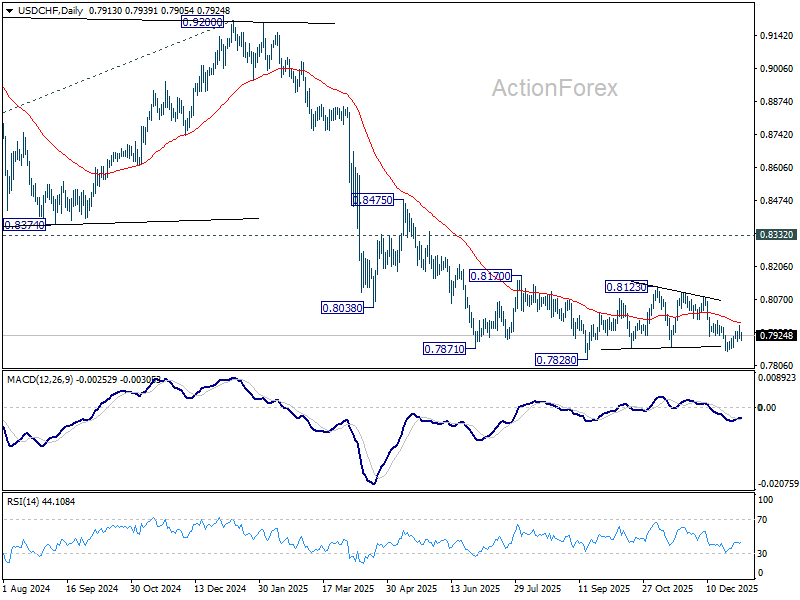
In the bigger picture, outlook will stay bearish as long as 0.8332 support turned resistance holds (2023 low). Long term down trend from 1.0342 (2017 high) is still in progress. Next target is 100% projection of 1.0146 (2022 high) to 0.8332 from 0.9200 at 0.7382.
Caution Returns After Risk-on Moves, Australia CPI Take Over
Market conditions have settled after earlier risk-on moves, with European indexes and US futures showing little direction. The absence of follow-through buying suggests traders are shifting toward more cautious trading. With desks fully staffed again, attention is turning to Friday’s December US non-farm payrolls report. Dollar remains broadly on the back foot and will be looking to the labor data for support after this week's underperformance.
The base case still points to Fed delivering one more rate cut later this year, in line with the latest dot plot guidance. However, any renewed tightness in the labor market could push the timing of that move deeper into the second half of 2026. Even so, there remains a substantial flow of inflation and employment data before the March FOMC meeting. As a result, markets could remain wary of taking large directional bets based on a single payroll print.
The immediate attention, though, is shifting to Australia’s November CPI data first, which will be released in the upcoming Asian session. Consensus hopes for a moderation in inflation from October’s 3.8% pace, though forecasts span a wide range, leaving scope for upside surprise.
Australia’s interest-rate outlook has undergone a sharp reassessment since late 2025. Expectations have swung from further easing — after three cuts last year — to discussions around an extended pause and even the possibility of renewed tightening this year. That pivot was reinforced by RBA Governor Michele Bullock, who said she does not see rate cuts “on the horizon for the foreseeable future,” adding that the board is weighing an extended hold against the risk of a rate rise.
Markets currently see February as a low-probability hiking window for the RBA, but pricing jumps sharply by mid-year, with a quarter-point increase fully priced by August. Tomorrow's data could reshape these expectations.
For the week so far, Sterling leads FX performance, followed by Aussie and Kiwi. Loonie lags at the bottom, with Euro and Swiss Franc also under pressure. Dollar and Yen sit mid-pack.
In Europe, at the time of writing, FTSE is up 1.08%. DAX is up 0.29%. CAC is down -0.03%. Germany 10-year yield is down -0.021 at 4.486. UK 10-year yield is down -0.029 at 2.845. Earlier in Asia, Nikkei rose 1.32%. Hong Kong HSI rose 1.38%. China Shanghai SSE rose 1.50%. Singapore Strait Times rose 1.27%. Japan 10-year JGB yield rose 0.011 to 2.130.
Fed’s Barkin says policy near neutral, dual mandate tensions persist
Richmond Fed President Tom Barkin said today the outlook for US monetary policy is in a “delicate balance,” as policymakers weigh still-elevated inflation against signs of rising unemployment. Speaking on the policy outlook, Barkin stressed that conflicting pressures mean "both sides of the Fed’s dual mandate bear watching."
Barkin noted that last year’s 75 basis points of easing have brought interest rates “within range of neutral,” likening the move to taking out insurance against downside risks. Inflation has cooled but remains above target, while unemployment is still low by historical standards. However, he cautioned that policymakers do not want labor market conditions to deteriorate much further.
Despite near-term uncertainty, Barkin said he is optimistic on the 2026 outlook. He expects last year’s elevated uncertainty to ease, boosting confidence among consumers and businesses. Fiscal changes, deregulation efforts, and the delayed impact of monetary easing are all expected to provide meaningful support to economic growth.
UK PMI services finalized at 51.4, tepid expansion, inflation risks linger
UK service sector activity showed only marginal improvement at the end of 2025, with Services PMI finalized at 51.4 in December, up fractionally from 51.3 in November. Composite PMI also edged higher to 51.4 from 51.2, pointing to continued but lackluster expansion across the broader economy.
According to S&P Global Market Intelligence, Economics Director Tim Moore said business activity growth remained subdued and weaker than indicated by the earlier flash estimate. Survey respondents cited persistent sales headwinds tied to soft UK growth prospects, rising business costs, and weak overseas demand, contributing to another notable decline in service sector employment.
Despite muted demand, inflation pressures intensified. Input prices rose at the fastest pace in seven months, while output charge inflation rebounded from November’s low.
Eurozone PMI services slows but remains key pillar for 2026 outlook
Eurozone economic momentum cooled modestly at the end of 2025, with Services PMI finalized at 52.4 in December, down from 53.6 in November. Composite PMI also eased to 51.5 from 52.8.
Performance across countries remained uneven. Spain led the bloc with a composite reading of 55.6, a two-month high. Ireland slipped to 53.6. Germany eased to 51.3, its lowest in four months, Italy fell to 50.3, an eleven-month low, and France hovered at the stagnation threshold at 50.0.
Despite the slowdown, Hamburg Commercial Bank Chief Economist Cyrus de la Rubia said the services sector has now expanded for seven consecutive months and that “the picture looks good” overall. He added that Composite PMI averaged a "visibly higher level" in the final quarter, suggesting GDP growth likely accelerated toward year-end, driven primarily by services. Growth prospects for 2026 improve modestly, with overall expansion seen above 1% but far from robust.
At the same time, rising cost pressures in services remain a key constraint on policy. ECB President Christine Lagarde has stressed close monitoring of services inflation, where higher wages continue to push costs and prices up. That dynamic explains why the ECB has paused further rate cuts.
Japan monetary base drops below JPY 600T, as BoJ presses ahead with normalization
Japan’s monetary base contracted in 2025 for the first time since 2007, underlining the Bank of Japan’s decisive shift away from decades of ultra-loose policy. Data released today showed the average balance of the monetary base fell -4.9% year-on-year, echoing the period when the BoJ last embarked on a rate-hike cycle.
The contraction accelerated toward year-end. The average balance in December stood at JPY 594.19 trillion, down -9.8% yoy and falling below the JPY 600 trillion mark for the first time since September 2020.
The decline reflects the BoJ’s ongoing exit from its decade-long stimulus, which began in 2024. Since then, the central bank has raised interest rates, slowed purchases of JGBs and wound down funding schemes designed to encourage bank lending. With policy normalization still underway, Japan’s monetary base is expected to continue shrinking as bond tapering and further rate hikes proceed.
USD/CHF Mid-Day Outlook
Daily Pivots: (S1) 0.7897; (P) 0.7932; (R1) 0.7952; More….
Intraday bias in USD/CHF stays neutral for the moment. Further decline is mildly in favor with 0.7986 resistance intact. On the downside, below 0.7900 minor support will turn bias to the downside. Break of 0.7860 will target a retest on 0.7828 low. However, break of 0.7986 will argue that corrective pattern from 0.7828 is still extending with another rising leg already in progress.
In the bigger picture, outlook will stay bearish as long as 0.8332 support turned resistance holds (2023 low). Long term down trend from 1.0342 (2017 high) is still in progress. Next target is 100% projection of 1.0146 (2022 high) to 0.8332 from 0.9200 at 0.7382.
Fed’s Barkin says policy near neutral, dual mandate tensions persist
Richmond Fed President Tom Barkin said today the outlook for US monetary policy is in a “delicate balance,” as policymakers weigh still-elevated inflation against signs of rising unemployment. Speaking on the policy outlook, Barkin stressed that conflicting pressures mean "both sides of the Fed’s dual mandate bear watching."
Barkin noted that last year’s 75 basis points of easing have brought interest rates “within range of neutral,” likening the move to taking out insurance against downside risks. Inflation has cooled but remains above target, while unemployment is still low by historical standards. However, he cautioned that policymakers do not want labor market conditions to deteriorate much further.
Despite near-term uncertainty, Barkin said he is optimistic on the 2026 outlook. He expects last year’s elevated uncertainty to ease, boosting confidence among consumers and businesses. Fiscal changes, deregulation efforts, and the delayed impact of monetary easing are all expected to provide meaningful support to economic growth.
EUR/USD Forecast: Technicals and Seasonality Hint at Another Leg to the Downside
EUR/USD has had an interesting start to 2026. US Dollar strength has kept the pair on a downward trajectory from December 24, 2025 highs around the 1.1800 handle.
Since then, EUR/USD has fallen around 140 pips to a low of around the 1.1660 level yesterday with the potential for further downside still a possibility.
US Dollar Seasonality to Play a Role?
Despite all the talk and concern around the US Dollar, January is historically a positive month for the greenback. With that in mind, this could work in favor of another leg to the downside for EUR/USD.
The US Dollar has risen at the start of the year and this week as well, but this was largely attributed to a spike in haven demand after the US/Venezuela tensions over the weekend.
I do expect the US dollar to gain a bit of strength in the near-term and this feeds in to the trade setup for EUR/USD.
My reasoning is simply down to seasonality as well as the fact that market participants seem too relaxed about global political conflicts right now; if tensions suddenly flare up again, especially in Latin America or Greenland, risky investments could crash, causing traders to rush back to the safety of the dollar.
Technical Analysis on EUR/USD
Let us start with the technical picture on the four-hour chart
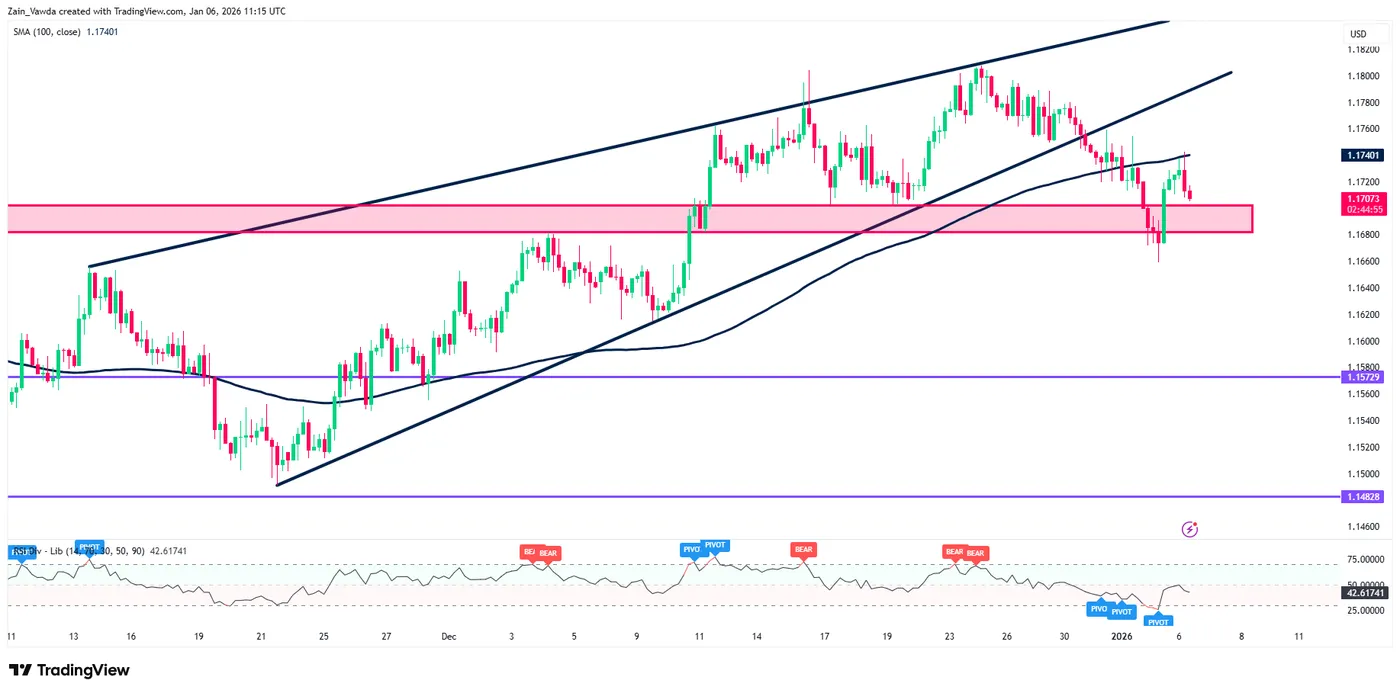
EUR/USD has broken the ascending wedge pattern which had been in play since Mid-November.
The breakout of the wedge pattern should lead to a drop of around 160 pips.
The pair has already dropped about a 100-pips before a pullback of around 80-pips
The price is now at the 100-day MA which is providing resistance and could be the start of the next leg to the downside.
EUR/USD Four-Hour Chart, January 6, 2026
Source: TradingView.com
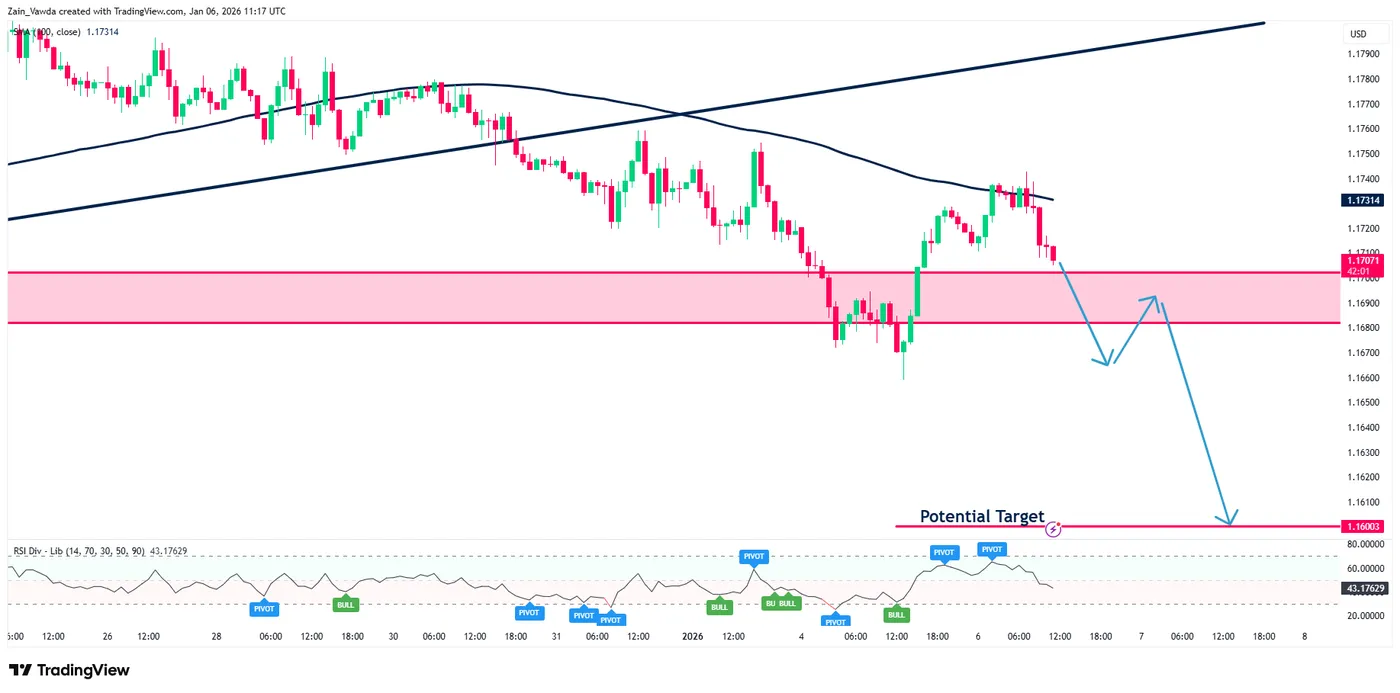
Dropping down to the one-hour chart below and for those looking for a better risk-to-reward there may be another opportunity to get involved.
A break below the red zone on the chart below with a potential retest of the zone could provide a tighter stop loss for those looking to get involved.
At present, only a four-hour candle close above the 1.1750 handle would lead me to re-evaluate the setup as that would mean a change in structure has taken place and the par may break to the upside and test recent highs around the 1.1800 handle.
EUR/USD One-Hour Chart, January 6, 2026
Source: TradingView.com