Sample Category Title
Oil Gains Ground, Gold Consolidates
Oil’s recovery continues
Oil prices held on to their Asian gains overnight, after Saudi Aramco signalled rising oil prices to Asian customers over the weekend. The general perception is that despite the noise from the White House, there is very little that President Biden can do to arrest oil price rises, even if he authorises releases from the SPR.
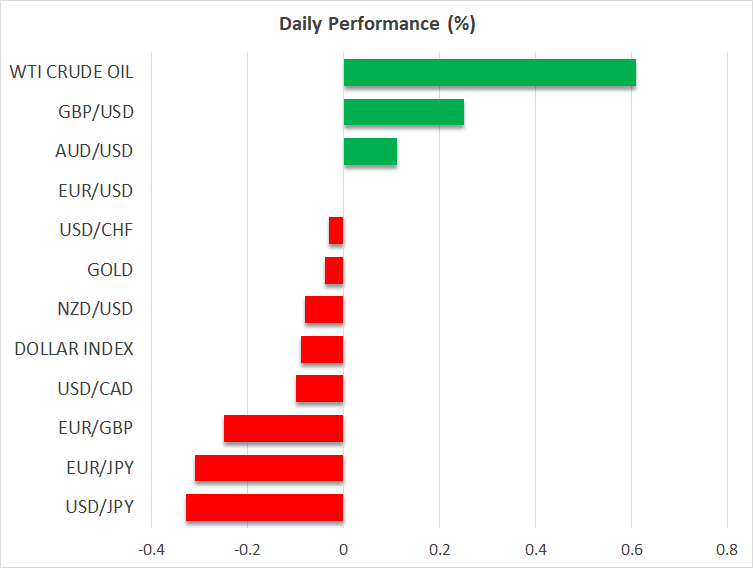
Brent crude finished 1.60% higher at USD 83.60 a barrel, and WTI finished 1.05% higher at USD USD 82.20 a barrel. Some short-term long-covering has pushed both contracts 30 cents lower in Asia, but otherwise, Asian prices are as lethargic as those seen in other asset classes this morning.
Brent crude has resistance at USD 84.50, USD 85.25, and USD 86.00 with support at USD 82.50 and USD 82.00 a barrel. WTI has resistance at USD 83.50 and USD 85.00, with support at USD 81.00 and USD 80.00 a barrel.
Gold holds on to Friday gains
A lower US dollar overnight helped gold advance slightly higher, enabling it to hold on to its substantial gains from the Friday session. Gold finished 0.33% higher at USD 1824.20 an ounce, before easing slightly to USD 1822.75 an ounce in a moribund Asian session. With US bond yields trading on the heavy side and seemingly set to range in the days ahead, and with a downside US dollar correction underway, gold now has a realistic chance of advancing further still in the days ahead.
If gold can break and hold above its well-defined resistance zone between USD 1832.00 and USD 1835.00 an ounce, it will trigger an inverse head-and-shoulders pattern that would target a return to USD 2000.00 an ounce. Support is at USD 1800.00 and USD 1785.00 an ounce, although I suspect that a fall through USD 1810.00 will be enough to trigger a mad fast-money dash for the exit door.
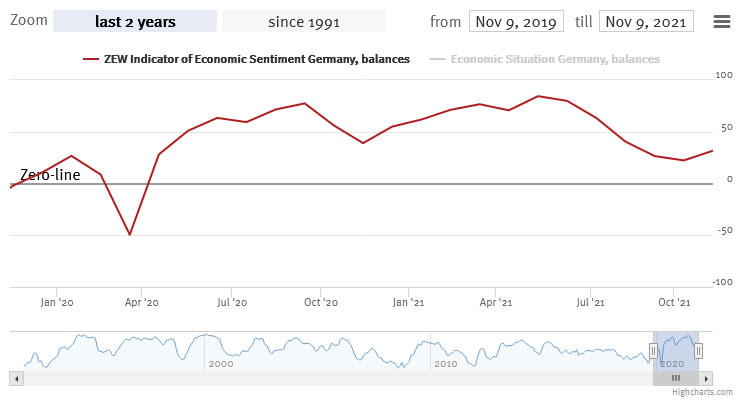
German ZEW economic sentiment rose to 31.7, but current situation dropped to 12.5
Germany ZEW Economic Sentiment rose to 31.7 in November, up from 22.3, well above expectation of 20.3. That's also the first rise since May. Current Situation, however, worsened again and dropped sharply from 21.6 to 12.5, well below expectation of 19.4.
Eurozone ZEW Economic Sentiment rose from 21.0 to 25.9, above expectation of 20.6. Current situation dropped -4.3 pts to 11.6. Inflation expectations for Eurozone dropped very sharply by -31.4 pts to -14.3. This shows that the experts expect the inflation rate in the eurozone to decline over the next six months.
"Financial market experts are more optimistic about the coming six months. However, the renewed decline in the assessment of the economic situation shows that the experts assume that the supply bottlenecks for raw materials and intermediate products as well as the high inflation rate will have a negative impact on the economic development in the current quarter. For the first quarter of 2022, they expect growth to pick up again and inflation to fall both in Germany and the eurozone," comments ZEW President Professor Achim Wambach on current expectations.
Stocks Living The Dream, Yen Shines As Yields Retreat
- US stocks remain at record highs, enabled by falling real yields
- Dollar a touch softer amid rumors Brainard could replace Powell
- Yen and gold enjoy more gains, sterling recovers despite risks
Euphoria in the air
Can anything stop the runaway train that is the US stock market? The S&P 500 closed at another record high on Monday, bringing its total gains for the year to a stunning 27%. Infrastructure spending, assurances from Fed officials that they won’t slam on the brakes too hard, and stellar earnings have all been cited as catalysts for the melt-up.
In reality, the drivers of this rally may be more arcane. Stock buybacks are on track to hit new records, real yields have fallen to the point where frothy valuations are more palatable, volume in call options has exploded, and momentum chasing algorithms have served as rocket fuel for everything else.
Even the Fed is worried about asset prices racing too far ahead of fundamentals. The central bank’s Financial Stability report was released yesterday and highlighted a range of risks, from a liquidity crunch in China spilling over into the global financial system to rising interest rates and surging inflation threatening elevated valuations.
All told, this seems like an unstable environment. Sure, markets could storm even higher heading into year-end, but chasing the rally at this stage feels like picking up pennies in front of a steamroller. The catalyst for a reality check could be tomorrow’s US inflation report.
Dollar retreats, yen climbs
In the currency market, the dollar took a small step back this week. The pullback in real Treasury yields along with the euphoria in equity markets seem to be the driving forces behind this softness.
There’s also speculation that Powell’s days as Fed Chairman may be numbered. Powell is a registered Republican, so the White House may prefer to replace him with someone like Brainard who is a Democrat. Brainard is arguably more dovish, meaning that with her at the helm, the Fed could be even more cautious about raising rates.
Meanwhile, with real yields falling back towards record lows and the dollar retreating, both the Japanese yen and gold prices have emerged victorious. The question is how sustainable this rebound is, as nothing has really changed in the inflation outlook to justify real yields sinking so much.
Sterling fights back, key events ahead
The British pound has also managed to claw back some of its latest losses. There hasn’t been any seismic news from the UK, so sterling’s recovery seems linked primarily to the cheerful mood in stock markets.
That said, there are still storm clouds hanging over the pound. Market expectations for BoE rate increases remain overly aggressive with almost four hikes priced in for next year, and political risk is back on the radar amid rumors that PM Johnson could trigger Article 16 to renegotiate parts of the Brexit deal.
As for today, the schedule is relatively light. The latest US producer prices will serve as a prelude for tomorrow’s CPI numbers, while on the central bank front, we will hear from the heads of the Fed, ECB, and BoE. All of them have spoken recently so any groundbreaking policy signals are unlikely.
Instead, the fireworks could come overnight when China releases its own inflation data for October. The focus will fall on producer prices, which are expected to show that Chinese factories keep exporting inflation abroad at an accelerating pace.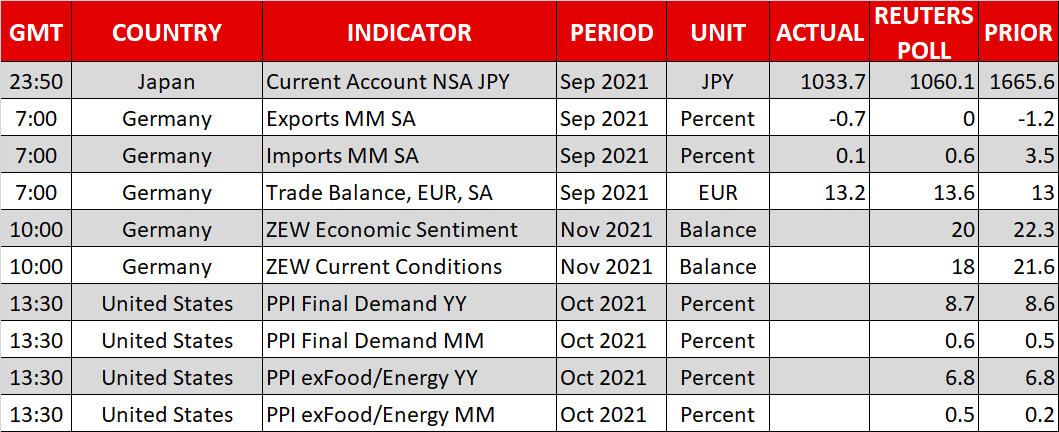
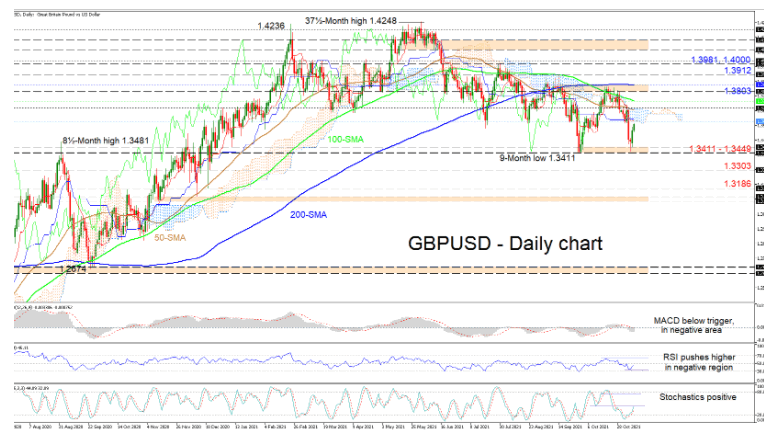
GBPUSD’s Upside Impetus To Be Tested After Bounce Near 1.3411
GBPUSD's latest bullish thrust near the nine-month trough of 1.3411 is heading for a nearby tough resistance zone shaped by the Ichimoku cloud's floor at 1.3614 and the 1.3700 handle. The 200-day SMA is promoting a more neutral trend, while the bearish 50- and 100-day SMAs are endorsing the negative trajectory.
Currently, the Ichimoku lines are not indicating a clear direction in the pair, while the short-term oscillators are showing that positive momentum is picking up. The MACD, in the negative region, is slowing below its red trigger line, while the RSI is climbing in the bearish territory. The positively charged stochastic oscillator is also promoting additional gains in the pair.
If the price holds its current course, buyers may face a preliminary fortified resistance zone from 1.3614 until the 1.3700 hurdle, the former being where the Ichimoku lines are also lying, and the latter being adjacent to the 50-day SMA and the cloud's upper limit. Successfully overstepping this border, the 100-day SMA at 1.3743 could impede buyers from challenging the resistance band from 1.3803 to 1.3849. Should the bulls be victorious, they may push higher towards the 1.3912 high before tackling the 1.3981 and 1.4000 barriers, identified on July 29 and June 23 respectively.
If positive forces start to wane as the price approaches the cloud, sellers could turn their focus towards the support base of 1.3411-1.3449. If this support barricade fails to negate negative forces from snowballing, the price could dive for a December 2020 low at 1.3303. Should the bears push beneath the 1.3300 mark, the pair could sink, aiming for the 1.3186 trough.
Summarizing, GBPUSD is exhibiting a slight negative tendency below the Ichimoku cloud, the SMAs and the 1.3700 border, despite buyers' fresh bullish response.
Bank Of England Ready To Raise Interest Rate At December Meeting
The US stock market closed yesterday with a slight increase. The Dow Jones index increased by 0.29%, the S&P 500 index added 0.09%, and the Nasdaq Composite index added 0.07%. The Dow Jones and S&P 500 indices once again rewrote the historical highs.
According to FOMC officials, the US central bank is actively monitoring inflation indicators and is ready to act decisively if consumer prices continue to rise. But Fed officials are confident that inflation remains under control and interest rates should not be expected to rise until the end of the QE program reduction.
Main from Fed member Harker: "If inflation doesn't cool, the Fed may have to accelerate rate hikes; I expect inflation to moderate next year as supply chains reopen and problems go away; the federal funds rate will rise before the Fed's bond-buying cuts are completed."
Main from Fed member Evans: "We need to reduce inflation by about 2%; it is difficult to predict how long it will take for supply and demand conditions to normalize and bring inflation down; the Fed is on track to complete the asset purchase reduction by mid-2022; it is unknown how long it will take for inflation to come down."
The main from Fed member Bowman: "Predicting inflation caused by supply chain disruptions and labor market weakness is the Fed's biggest problem; the problem with higher inflation has a stronger impact on low- and middle-income people."
Alphabet's capitalization jumped to $2 trillion. Google's parent company has the best performance among the "big tech" companies this year, and it's rising by 70%.
Yesterday, the main European stock indexes closed in different directions. The British FTSE 100 and German DAX lost 0.05%, Italian FTSE MIB decreased by 0.3%, and Spanish IBEX fell by 0.65%. Meanwhile, France's CAC 40 index added 0.1%. The rise in energy prices in Germany reached a 20-year high. The ECB representative said yesterday that the Eurozone is almost back to pre-pandemic levels in economic terms, and inflation has been more resilient than expected. The biggest problem for the Eurozone remains the energy crisis. In addition, Bank of England Governor Andrew Bailey announced a potential interest rate hike at the December meeting, indicating that the central bank will act decisively to contain inflationary pressures.
Saudi Arabia also believes the next few weeks will be tight in the oil market, so its official selling price to Asia has been increased by $1.40 per barrel. Demand for jet fuel will rise as more governments remove restrictions on air travel.
Asia-Pacific stock markets are slightly down in Tuesday trading. Japan's Nikkei 225 index decreased by 0.5%, Hong Kong's Hang Seng decreased by 0.13%, and Australia's ASX 200 lost 0.24%. At the same time, Shanghai Composite added 0.03%.
The value of Chinese real estate developer Evergrande increased by 0.4%. The company recently raised $145 million through the sale of shares in media company HengTen Networks Group Ltd and is on the eve of the next period of payments on dollar bonds now.
Main market quotes:
- S&P 500 (F) 4,701.70 +4.17 (+0.09%)
- Dow Jones 36,432.22 +104.27 (+0.29%)
- DAX 16,046.52 −7.84 (−0.049%)
- FTSE 100 7,300.40 −3.56 (−0.049%)
- USD Index 94.03 −0.29 (−0.30%)
Important events for today:
- Germany ZEW Economic Sentiment (m/m) at 12:00 (GMT+2);
- Eurozone ZEW Economic Sentiment (m/m) at 12:00 (GMT+2);
- ECB President Lagarde’s Speech at 15:00 (GMT+2);
- US Producer Price Index (m/m) at 15:30 (GMT+2);
- US Fed Chair Powell’s Speech at 16:00 (GMT+2);
- UK BoE Gov Bailey’s Speech at 18:00 (GMT+2);
- US FOMC Member Daly’s Speech at 18:35 (GMT+2).
Asian Markets Mixed
Asian stocks mixed after modest rally on Wall Street
Wall Street crawled to another record close overnight, with the lower rates for longer, buy-everything FOMO gnomes firmly in control. The session being most notable for Alphabet toughing the USD 2 trillion market cap mark, joining Apple and Microsoft. The S&P 500 closed 0.09% higher, the Nasdaq edged 0.07% higher, with the Dow Jones climbing by 0.29%. Once again, momentum has waned in Asia, with futures on all three indexes falling by around 0.20%.
With nothing of note to sink its teeth into, the street continued moving back into its happy place, interest rates lower for longer contributing to the buy-everything except the US dollar mood. With no thematic momentum one way or the other from Wall Street, Asian markets have been freed to set their own course today, leading to a mixed day across the region. The Nikkei 225 has risen just 0.10%, with South Korea’s Kospi falling by 0.15%. China is equally uninspiring, with the Shanghai Composite and CSI 300 almost unchanged thus far. Hong Kong has edged 0.15% higher.
Regionally, Singapore and Bangkok are trading each side of unchanged while Taipei is outperforming, rising by 0.70%, perhaps receiving an Alphabet tailwind. Kuala Lumpur has fallen by 0.60%, while Jakarta is 0.30% higher along with Manila. In Australia, markets are slightly higher, and the ASX 200 and All Ordinaries are rising by around 0.15%.
With a lack of events on the economic calendar, the most volatility is likely to be generated by central bank officials, with the BOE’s Bailey, the ECB’s Schnabel and the Fed’s Powell, Daly, and Kashkari all speaking. Market participants will be keeping a close eye on US CPI on Wednesday.
The Analytical Overview Of The Main Currency Pairs
The EUR/USD currency pair
Technical indicators of the currency pair:
Prev Open: 1.1557
Prev Close: 1.1587
% chg. over the last day: +0.26%
The ECB representative said yesterday that the Eurozone is almost back to pre-pandemic levels in economic terms, and inflation has been more resilient than expected. The biggest problem for the Eurozone remains the energy crisis. Rising energy prices in Germany hit a 20-year high yesterday.
Trading recommendations
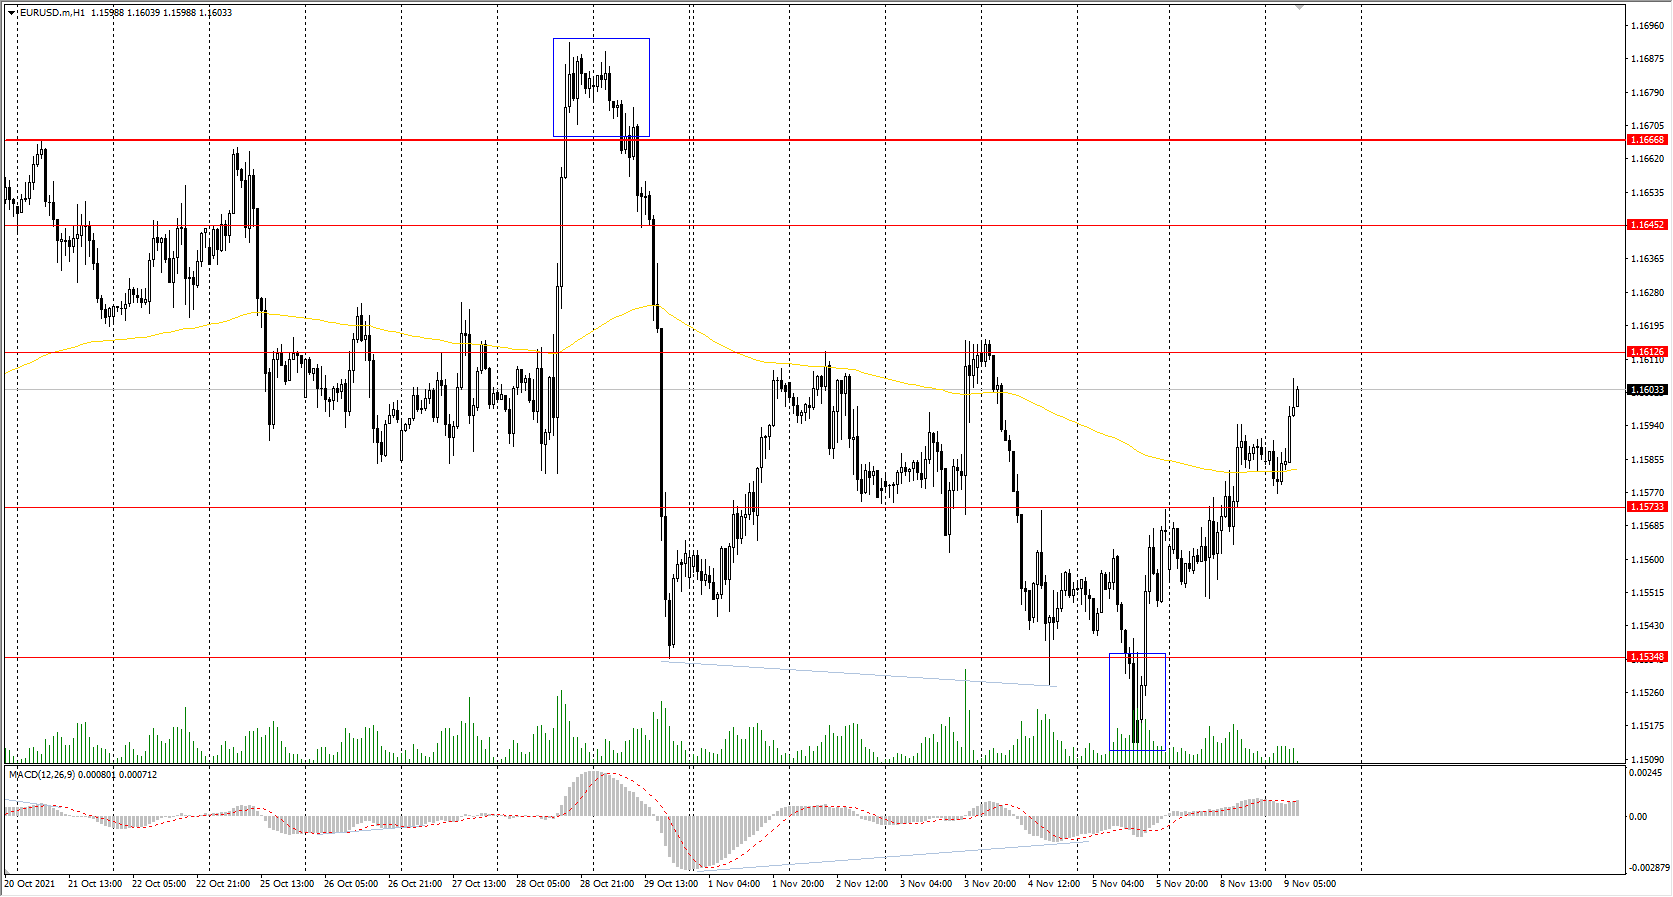
Support levels: 1.1573, 1.1535, 1.1502, 1.1453
Resistance levels: 1.1613, 1.1645, 1.1667, 1.1717, 1.1772
From the technical point of view, the EUR/USD on the hour time frame is bearish. But during the last two trading sessions, EUR/USD quotes are steadily growing without a significant pullback. The MACD indicator has become positive. The local pressure of buyers is higher at the moment. Under such market conditions, traders should consider sell positions from the resistance levels near the moving average. There is no optimal entry point for buy trades at the moment.
Alternative scenario: if the price breaks out through the 1.1667 resistance level and fixes above, the mid-term uptrend will likely resume.
News feed for 2021.11.09:
- Germany ZEW Economic Sentiment (m/m) at 12:00 (GMT+2);
- Eurozone ZEW Economic Sentiment (m/m) at 12:00 (GMT+2);
- ECB President Lagarde’s Speech at 15:00 (GMT+2);
- US Producer Price Index (m/m) at 15:30 (GMT+2);
- US Fed Chair Powell’s Speech at 16:00 (GMT+2);
- US FOMC Member Daly’s Speech at 18:35 (GMT+2).
The GBP/USD currency pair
Technical indicators of the currency pair:
Prev Open: 1.3476
Prev Close: 1.3564
% chg. over the last day: +0.65%
Yesterday, Bank of England Governor Andrew Bailey announced a potential interest rate hike at the December meeting, indicating that the central bank will act decisively to contain inflationary pressures. This statement was a surprise for traders who rushed to close their long positions after the Bank of England left monetary policy unchanged. Also, the Bank of England head added that most of the growth of inflation is associated with the resumption of work after lockdowns.
Trading recommendations
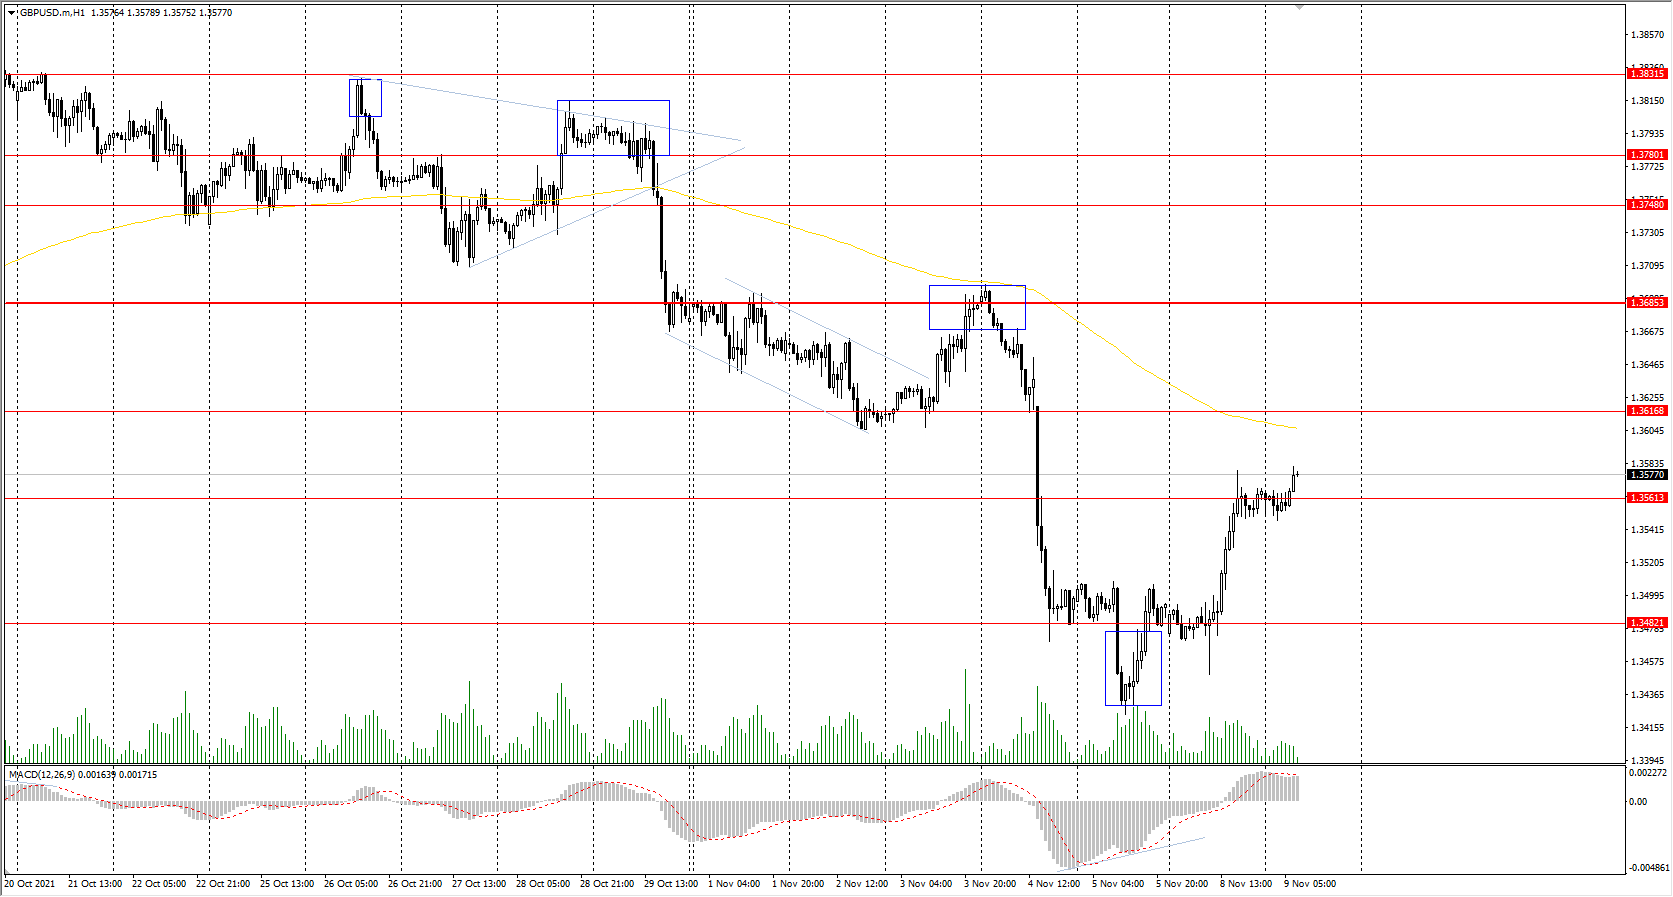
Support levels: 1.3562, 1.3482, 1.3360
Resistance levels: 1.3616, 1.3685, 1.3748, 1.3780, 1.3831, 1.3886
On the hourly time frame, the trend on GBP/USD is bearish. The MACD indicator became positive, indicating local buying pressure. It is best to look for sell deals from the resistance levels around the moving average. There is no optimal entry point for buy trades at the moment.
Alternative scenario: if the price breaks out through the 1.3685 resistance level and consolidates above, the bullish scenario will likely resume.
News feed for 2021.11.09:
- UK BoE Gov Bailey’s Speech at 18:00 (GMT+2).
The USD/JPY currency pair
Technical indicators of the currency pair:
Prev Open: 113.33
Prev Close: 113.22
% chg. over the last day: -0.10%
Japan's new government is working on a 35 trillion yen (307 billion US dollars) economic stimulus package. Such an injection into the economy will surely lead to higher inflation and the weakening of the Japanese currency.
Trading recommendations
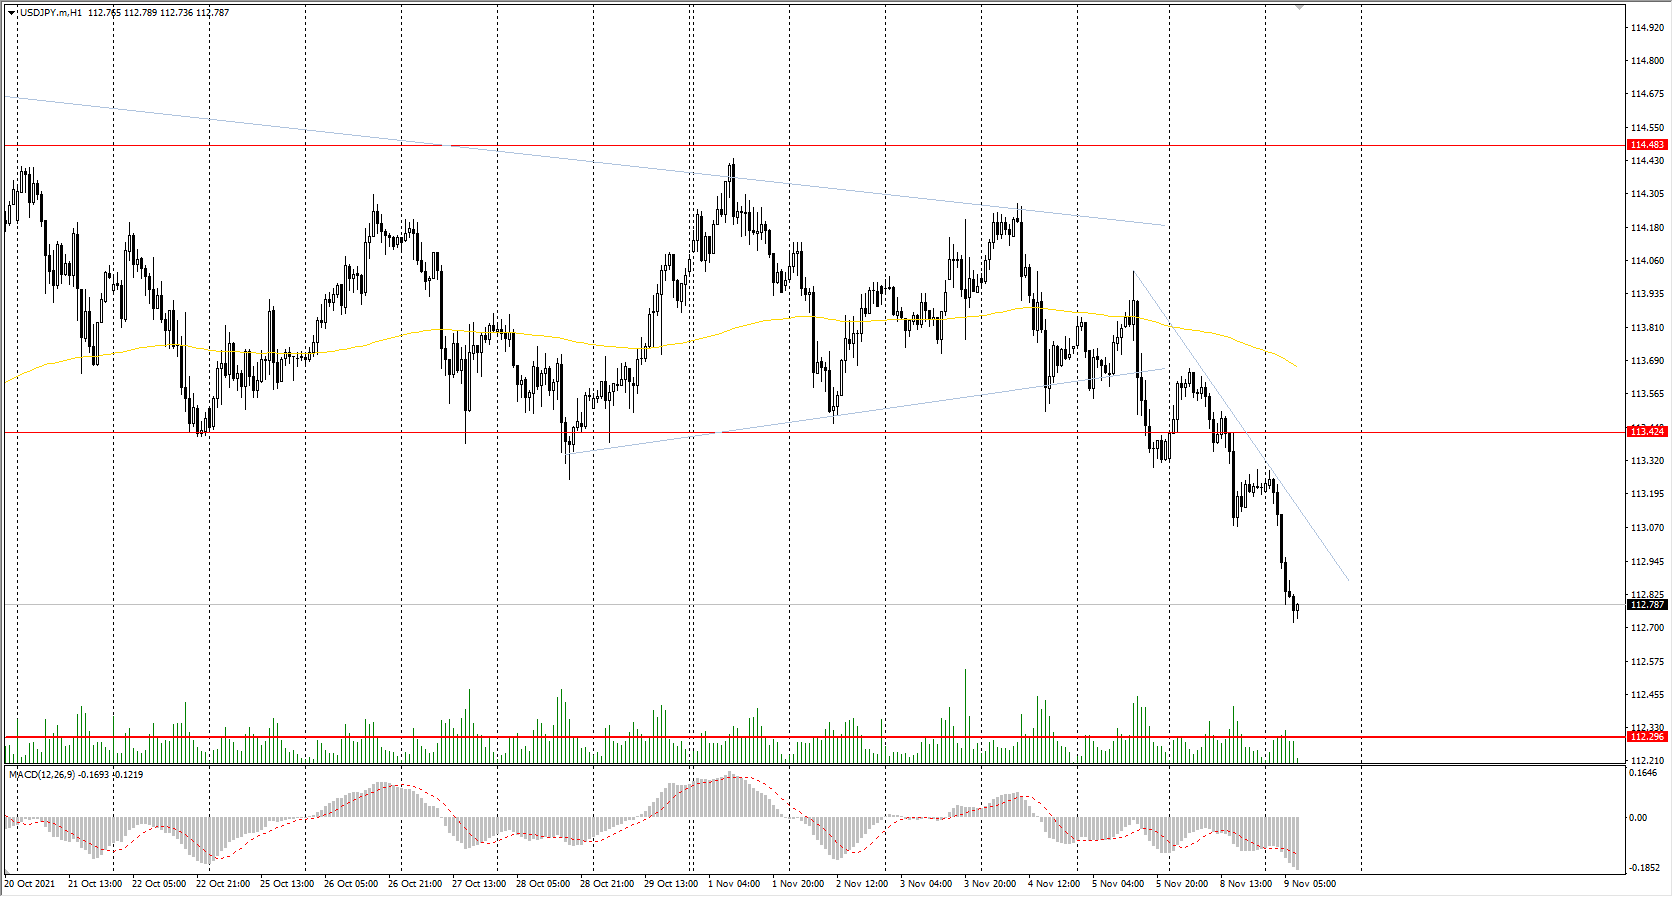
Support levels: 112.30, 111.53, 110.99, 110.65
Resistance levels: 113.42, 114.48, 115.15
The global trend on the USD/JPY currency pair is bullish. But the local trend is strictly bearish at the moment. Under such market conditions, it's better to look for buy positions from the buyers' initiative zone on the higher time frames. Sell positions should be considered from the resistance levels, given there is sellers' initiative.
Alternative scenario: if the price falls below 112.30, the uptrend will likely be broken.
The USD/CAD currency pair
Technical indicators of the currency pair:
Prev Open: 1.2448
Prev Close: 1.2440
% chg. over the last day: -0.06%
The Canadian dollar is a commodity currency, so the USD/CAD currency pair highly depends on the dollar index dynamics and oil prices. The dollar index slightly decreased yesterday, while oil prices remained unchanged. As a result, the USD/CAD currency pair is trading flat. Fundamentally, the Canadian dollar is tending to strengthen now as oil prices are rising and the Canadian central bank has begun to cut its stimulus program. On the other hand, a rise in the dollar index may eliminate these factors.
Trading recommendations
Support levels: 1.2428, 1.2352, 1.2306, 1.2260
Resistance levels: 1.2518, 1.2565, 1.2628, 1.2729, 1.2774
From the technical point of view, the USD/CAD currency trend has changed to bullish. The price broke through the priority change level and consolidated above. The MACD indicator has become inactive, and there are no signs of reversal. Under such market conditions, it is better to look for buy trades from the support levels, given there is the buyers' initiative. Sell deals should be considered from the resistance levels of the higher time frame.
Alternative scenario: if the price breaks down through the 1.2351 support level and fixes below, the downtrend will likely resume.
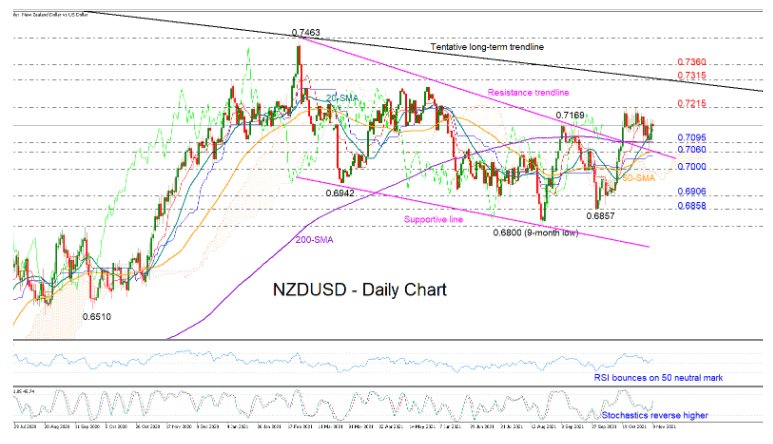
NZDUSD Bulls Look To Return, Next Target At 0.7215
NZDUSD has been flowing above the 200-day simple moving averages (SMA) the past couple of sessions, avoiding a close below the 0.7000 round level, while the bounce on the broken descending trendline can also be taken as another encouraging sign that buyers are looking to control the market.
In technical indicators, the 20-day SMA has pierced above the 50- and 200-day SMAs, raising some optimism that the pair could create more higher highs and higher lows.
As regards the price momentum, the latest rebound in the RSI and the Stochastics suggest upside pressures may dominate, though the bulls will probably need to clear the nearby 0.7215 resistance to take the helmet. If that is the case, the price could pick up steam towards May’s top of 0.7315, where a tentative long-term descending trendline stretched from the 2014 top of 0.8835 could put an end to the intense gains. If not, the focus may next turn to the soft barrier of 0.7360 from late February, which coincides with the 161.8% Fibonacci extension of the latest 0.7169 – 0.6858 downfall.
Should sellers come into play, the price may seek footing within the 0.7100 – 0.7060 zone, formed by the longer-term SMAs and the dissolved trendline. Breaching that base, the decline could sharpen towards the 0.7000 mark, while deeper, the spotlight will fall on the 0.6906 – 0.6858 support area.
In brief, NZDUSD is expected to trade positively in the short term, though downside risks may not evaporate unless the price rallies beyond the 0.7215 barricade.
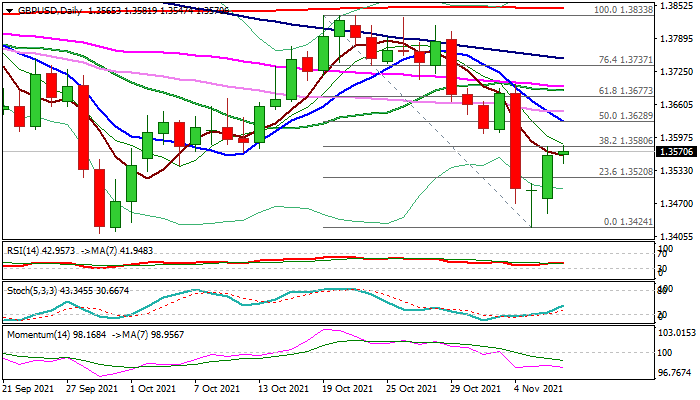
GBP/USD Outlook: Strong Rebound Looks For Confirmation On Break Of Pivotal Fibonacci Barrier
Cable is consolidating under the pivotal Fibo barrier at 1.3580 (38.2% of 1.3833/1.3424) which capped Monday’s 0.63%advance.
Pound regained ground after a strong fall last week, sparked by BoE surprise decision to stay on hold, despite many were expecting the first rate hike after a pandemic.
Fresh strength was sparked by Monday’s hawkish comments from Governor Bailey who said BoE will act on interest rates if inflation risks grow further.
Monday’s rebound formed a reversal pattern on the daily chart, which still looks for confirmation on a firm break above 1.3580 pivots.
This would open the way for recovery extension towards 1.3621/28 (daily cloud base/50% retracement/10DMA) and unmask a lower top at 1.3692 (also converged 20/55DMA’s). Daily structure slightly improved on the latest rally, although studies are still in a bearish setup that requires caution.
Repeated daily close below 1.3580 would be an initial warning, however, return below 1.3520 (broken Fibo 23.6%) would confirm recovery stall and bring bears fully to play.
BoE policymakers are due to speak later today and markets will focus on their remarks for fresh signals.
Res: 1.3580, 1.3628, 1.3677, 1.3692.
Sup: 1.3547, 1.3520, 1.3500, 1.3450.
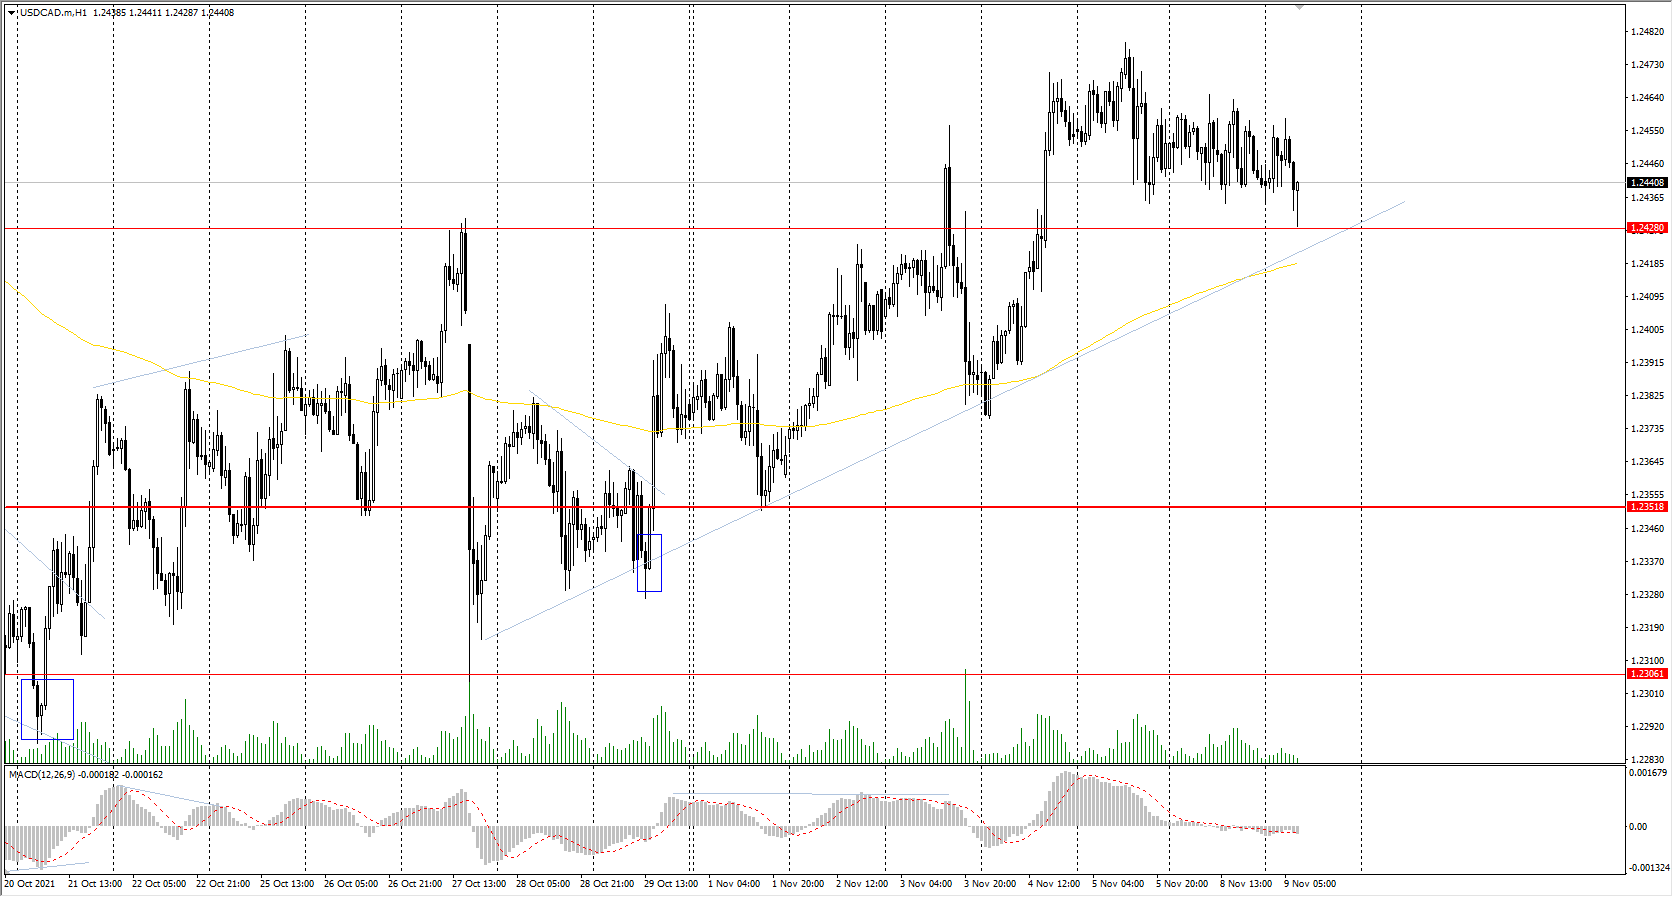
USD/CAD Reaches Support Zone
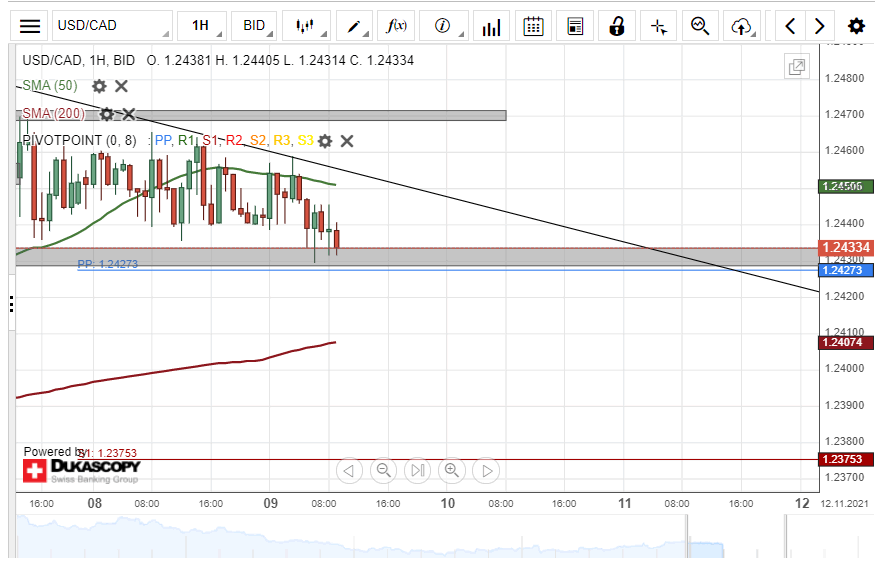
The USD/CAD currency exchange rate has been trading with high volatility, as can be deducted from the size of the hourly candles. Meanwhile, on Tuesday morning, the rate reached the support of the 1.2429/1.2433 zone.
In the case that the rate passes the support zone, it could almost immediately find support in the weekly simple pivot point at 1.2427. Below the pivot point, the rate could be supported by the 200-hour simple moving average near 1.2410.
Meanwhile, a potential recovery of the rate might encounter minor resistance in the 50-hour simple moving average. Above the SMA, a descending trend line could act as resistance. The trend line connects the recent high levels.