Sample Category Title
USD Remains Soft With Eyes Fixed On Inflation, Fed
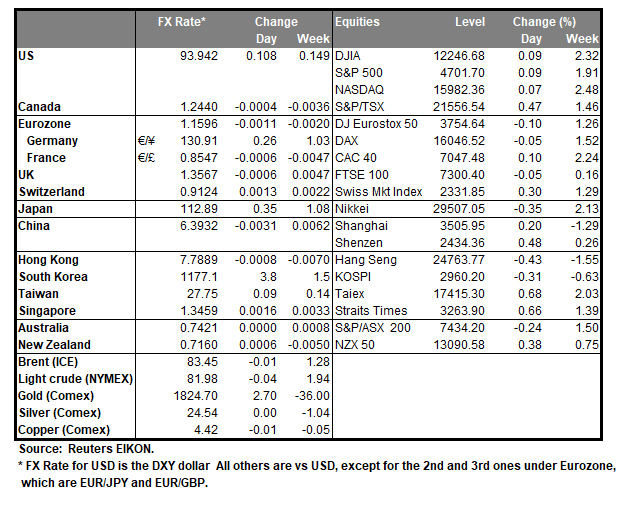
The USD tended to weaken against its counterparts yesterday as the market’s attention now turns to inflation and the Fed’s stance after the strong employment data released for October on Friday. It’s characteristic that Fed Vice Chair Clarida acknowledged that inflation is running at considerably high levels and that it’s “much more than a moderate overshoot” of the bank’s 2% target. The Fed’s Vice Chairman left the question on when the bank is to hike rates unanswered but stated that “I do believe that these three conditions for raising the target range of the funds rate will have been met by year-end 2022”. We expect market focus today to turn to the US PPI rates for October while also we have a number of Fed officials which are scheduled to speak, among them in a pre-recorded message Fed Chair Jerome Powell.
The USD index dropped yesterday breaking the 94.10 (R1) support line, now turned to resistance. We maintain bearish outlook for the greenback as long as the index remains below the downward trendline which is forming since the 5th of November when it hit a 13 month high. It should be noted that the RSI indicator below our 4-hour chart is aiming for the reading of 30 with a clear downward slope, implying a bearish sentiment for the index. Please note though that the index’s price action could bounce on the lower Bollinger band which is nearing as the index drops. Should the selling interest for the USD be maintained we may see the index breaking the 93.70 (S1) support line and aim for the 93.20 (S2) level. Should on the other hand, buyers take the initiative, we may see the index reversing course breaking the prementioned downward trendline, the 94.10 (R1) resistance line and take aim for the 94.60 (R2) level.
US stockmarkets gained as infrastructure plan provides a boost
US stockmarkets tended to be in the greens yesterday supported also by companies engaged with the construction sector as well as commodities. It should be noted that the indexes got a boost by the possibility of the signing of the US$1 trillion infrastructure deal that the House has passed and is now at President Biden for signing. The bill provides funding for roads, highways, alongside electric vehicles, clean energy, and high-speed broadband. Please note that currently another fiscal support package is being discussed at the US Congress and possible headlines for its passing could provide further support for stockmarkets and vice versa.
On second note the dovishness of the Fed seems also to be supporting the US stockmarkets, while a possible rise of the US yields could threaten a further upward motion.
Dow Jones continued to rise testing the 36490 (R1) resistance line yesterday before retreating lower. On a technical level, we maintain a bullish outlook for the index as long as its price action remains above the upward trendline incepted since the 13th of October. It should be noted that the RSI indicator remains above the reading of 50, implying a bullish sentiment, yet seems to correct a bit lower. The picture seems to be similar also with the Bollinger bands as the price action has retreated from the upper level. Should the bulls actually maintain control over the index, we may see it breaking the 36480 (R1) which marks a record high level for the index and if so is to enter uncharted waters. As the next possible target for the index to the upside, we have set the 36800 (R2) level. Should the bears say enough is enough and take over, we may see the index reversing course and breaking the 36210 (S1) line while even lower we note the 35900 (S2) level.
Today’s events and expectations
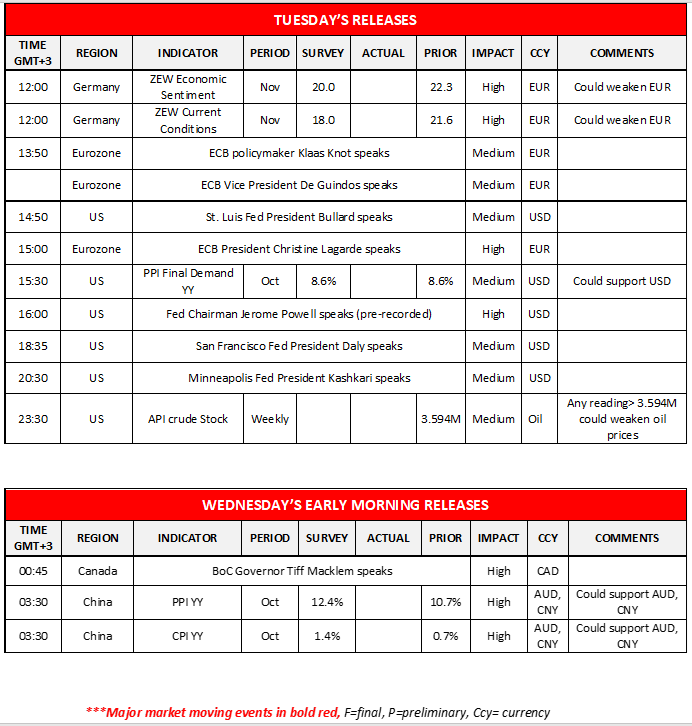
Today in the European session we get from Germany the ZEW indicators for November, in the American session we get from the US the PPI rates for October and later oil traders may be interested in the API weekly crude oil inventories figure while in the Asian session we get China’s inflation metrics for October. As for monetary events among a number of speakers, we note Fed Chairman Jerome Powell, ECB President Christine Lagarde and BoC governor Tiff Macklem early tomorrow.
USD Index H4 Chart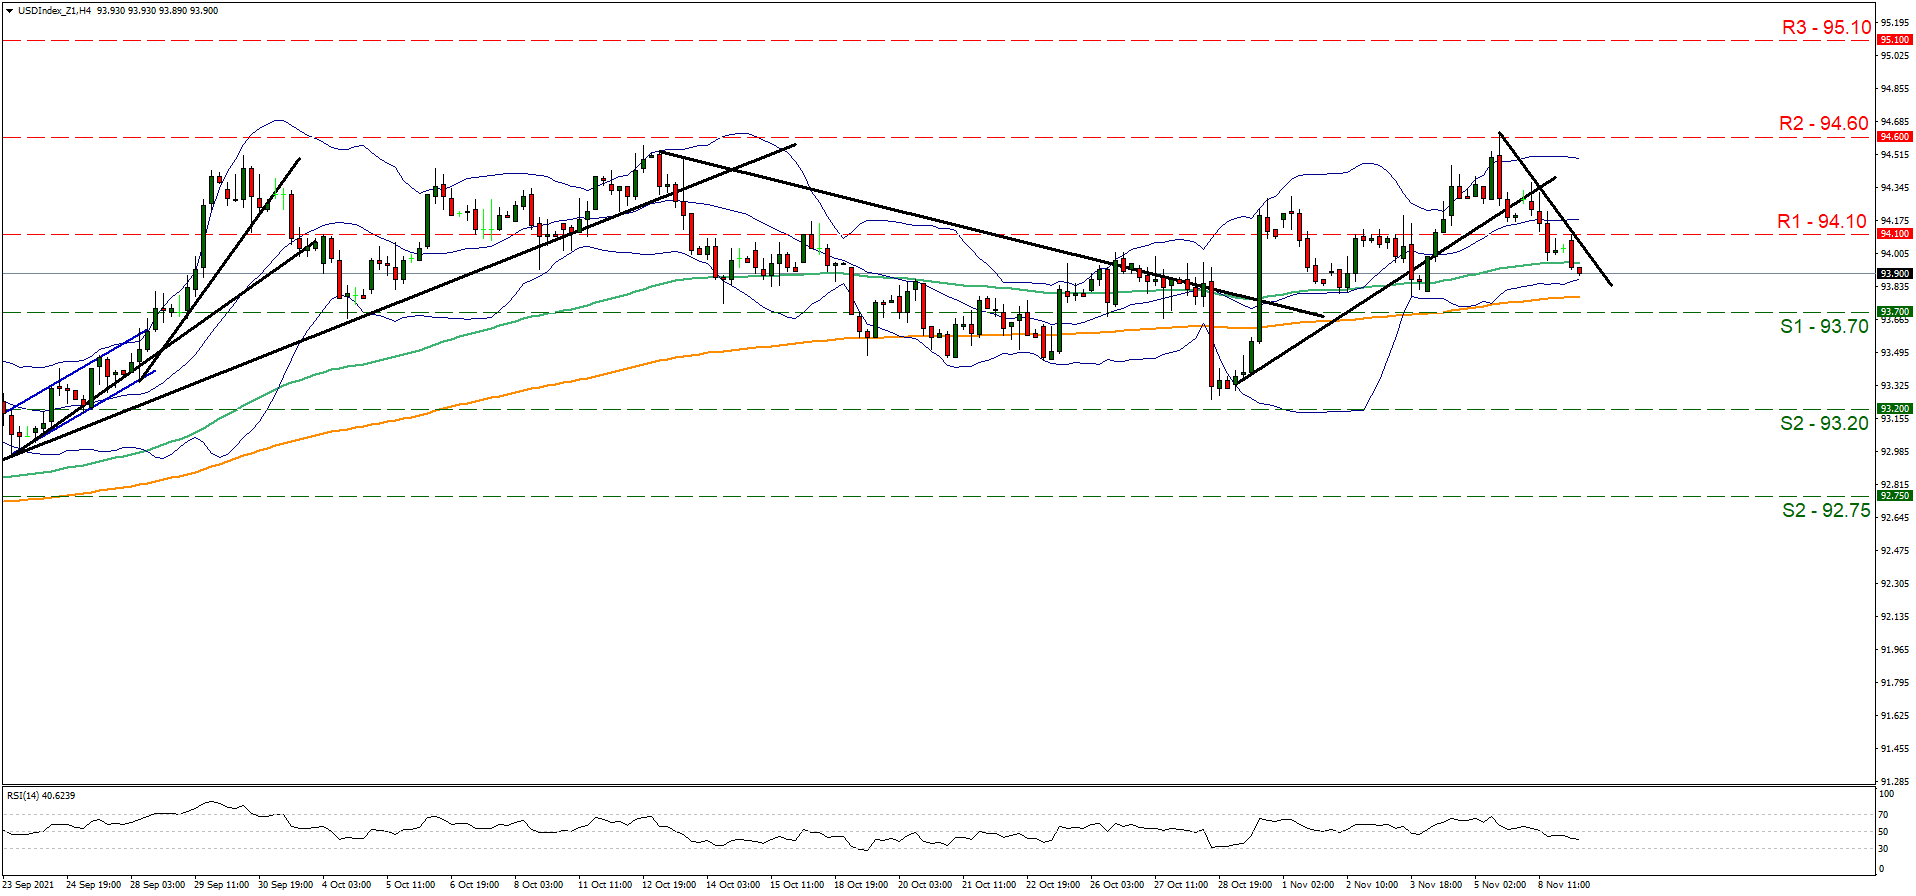
Support: 93.70 (S1), 93.20 (S2), 92.75 (S3)
Resistance: 94.10 (R1), 94.60 (R2), 95.10 (R3)
US 30 Cash H4 Chart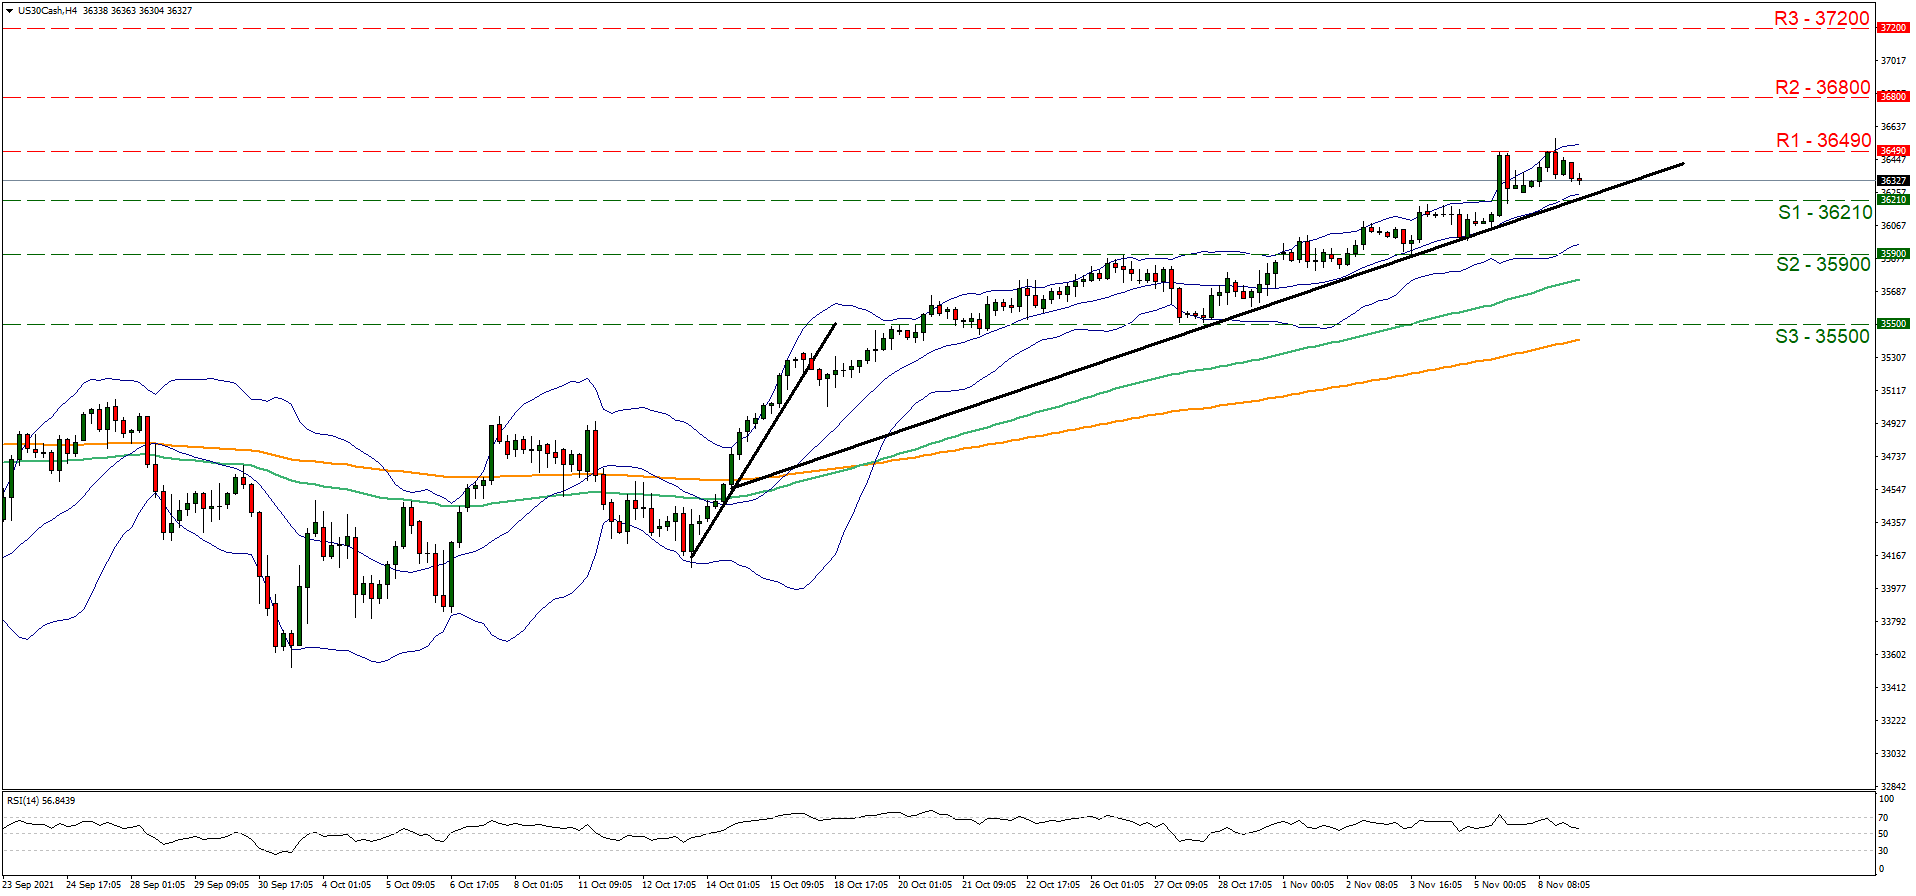
Support: 36210 (S1), 35900 (S2), 35500 (S3)
Resistance: 36490 (R1), 36800 (R2), 37200 (R3)
Gold And Bitcoin Prices Hold Steady As Inflation Expectation Rise
The euro continued its bullish trend in the evening session as investors priced in higher inflation in Europe. The biggest concern is energy since the price of natural gas has risen substantially in the past few weeks. At the same time, there are signs that these prices will keep rising as Russia has shown no signs that it will boost gas prices in Europe. Meanwhile, in a statement, George Lane, the chief economist at the ECB warned that the bank will likely hold steady for longer than expected. He cited rising cases in some countries and the fact that inflation remains lower than in the US. Later today, the euro will react to a speech by Christine Lagarde.
US stocks rose slightly on Monday as the market continued to reflect on the recent interest rate decision by the Federal Reserve. After flooding the markets with $120 billion per month since the pandemic started, the Fed started to unwind this monetary policy support last week. It aims to keep continue reducing its asset purchases until mid next year. Stocks also rose as the market reflected on the strong quarterly earnings. Data by FactSet showed that most companies were beating analyst forecasts on EPS and revenue. The third-quarter growth was also the best level since 2010.
Tesla shares declined by more than 7% on Monday, which helped to drag benchmark indices like Nasdaq 100 and S&P 500. The decline happened after Elon Musk hinted that he would sell a 10% stake in the company. At the current valuation, that stake is worth more than $20 billion. Still, analysts believe that the stock will sustain momentum even after he sells a small stake. Later today, the key company to watch will be Coinbase, which will publish its quarterly results. Other key market movers will be speeches by Jerome Powell, Christine Lagarde, and Andrew Bailey.
EURUSD
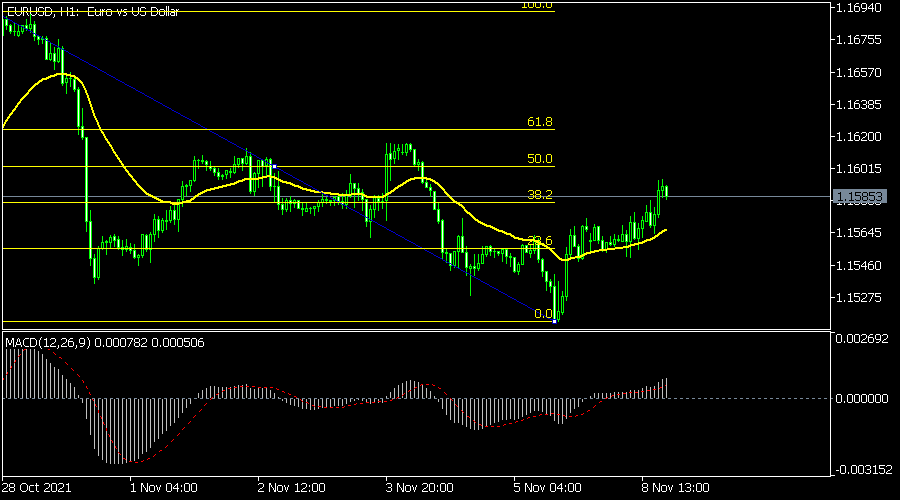
The hourly chart shows that the EURUSD pair rose sharply in the overnight session. A closer look also shows that the pair formed an inverted head and shoulders pattern, which is usually a bullish sign. It moved above the 38.2% Fibonacci retracement level. It also rose slightly above the short and longer-term moving averages. Therefore, the pair will likely keep rising as bulls target the next key resistance at 1.1650.
GBPUSD
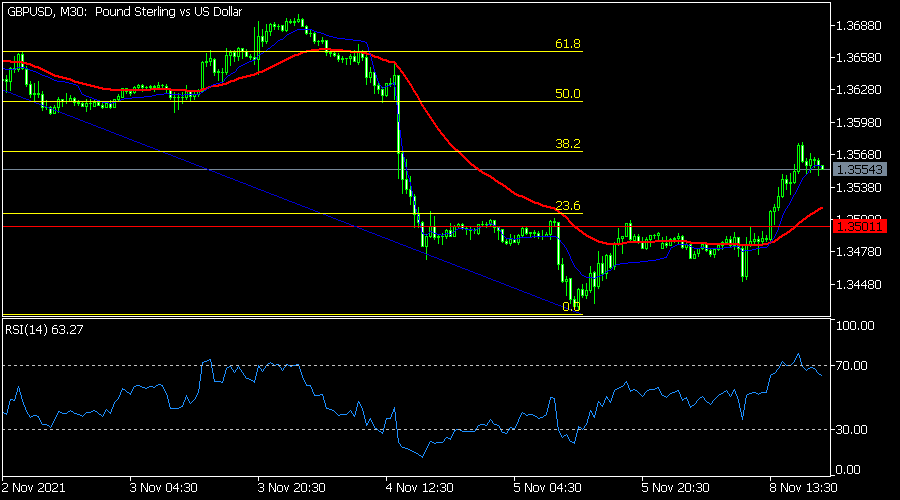
The GBPUSD pair rose sharply as investors attempted to buy last week’s dip. The pair rose to a high of 1.3557, which was substantially higher than last week’s low at 1.3422. On the 30-minute chart, the pair moved above the neckline of the inverted head and shoulders pattern. It also rose to the 38.2% Fibonacci retracement level. It has formed a bullish pennant pattern. Therefore, the pair will likely keep rising as bulls target the key resistance at 1.3650.
XAUUSD
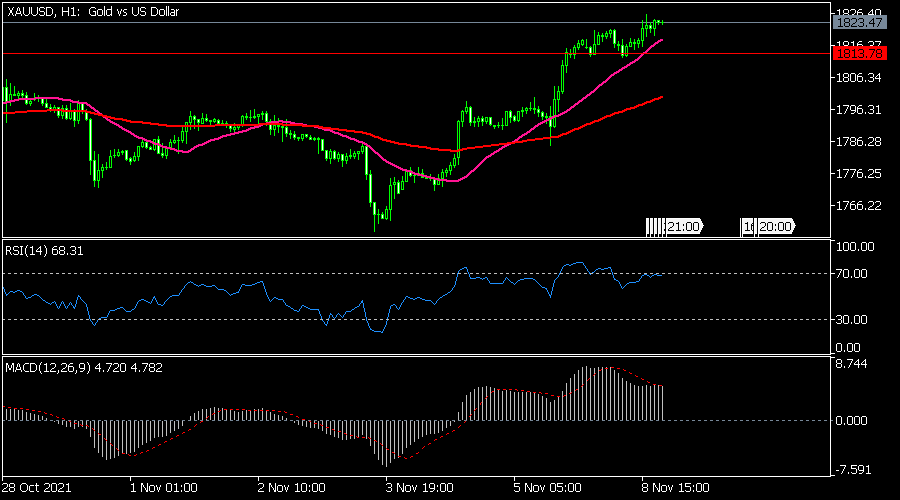
The XAUUSD pair jumped to a high of 1826 as demand for gold rose. The bullish trend accelerated when the pair moved above the key resistance level at 1,813, which was the highest level on October 22. It is being supported by the 25-day and 50-day moving averages while the MACD has kept rising. Therefore, the pair will likely keep rising as bulls target the key level at 1,850.
Data Desert Allows Sentiment To Rule
With this week’s global data calendar looking more parched than the Australian outback, markets have been left to their own devices thus far, drifting on the tides of sentiment swings and rent-a-comment from central bank officials. Overnight, the Fed’s semi-annual Stability Report highlighted risks from China’s real estate sector and inflation that becomes persistent, not transitory, although you can spin that term however you want. The report noted the dangers of inflated asset prices and potentially ugly corrections, which begs the question as to why so many central banks, including the Fed, are quantitatively easing into it? We also had a plethora of central bank speakers, including Bank of England Governor Bailey, who might hike if inflation is sticky, and the Fed’s Bullard, Clarida and Evans, who were two, one, lift-off, I mean zero for rate hikes in 2022. The see-saw remains as balanced in the monetary playground as ever.
With nothing of note to sink its teeth into, the street continued moving back into its happy place, interest rates lower for longer, buy-everything except for the US dollar. The FOMO gnomes of Wall Street managed to push equities slightly higher to yet another record close; bond yields drifted a little higher after falling on Friday. Still, it was probably most clearly seen in currency markets, where the US dollar retreated overnight. Even gold rallied once again overnight, after holding on to its rise through USD 1800.00 on Friday.
Through the US dollar rally, currency markets have probably most strongly reflected the Fed-taper and its future implications, having refused to budge from its highs even as the perpetual motion mega-bulls regained ascendency in the equity and bond markets. As a result, it likely has the furthest to retreat this week unless we get a shocker from US inflation data tomorrow. Even if inflation explodes higher, I am struggling to see it as an inflexion point in the central banks of the world’s QE determination to make the human race as economically unequal as possible in the shortest amount of time.
In Asia today, what scraps of data there are, have been modestly positive. New Zealand Credit Card spending rebounded in October, while Australia’s NAB Business Confidence jumped to 21 in October as New South Wales, Victoria, and the international border reopened. QoQ GDP for Q3 in the Philippines outperformed as well, rising by 3.80%. I would say that after a long and arduous road, the light at the end of the tunnel beckons for the Philippines, but I don’t want to hex it. Malaysian Industrial Production and Unemployment should show similar green shoots later today, as will Indonesian Retail Sales with life back to normal here in Jakarta, including the traffic and daily Covid cases in the low 100’s across the archipelago. I even went back to rugby training the weekend before last, where I promptly tore a tendon in my calf once again. It’s like I never left.
Markets eye central banks for direction
This afternoon, Germany’s ZEW Index will be of marginal interest, with more concern in Europe likely focused on surging virus cases and possible restrictions returning, thanks to stalled vaccination programmes across the continent. US PPI tonight is likely to climb to 0.60% MoM, but it will be tomorrow’s headline inflation data that grabs the headlines. The most volatility is likely to be generated by central bank officials, with the BOE’s Bailey, the ECB’s Schnabel and the Fed’s Powell, Daly, and Kashkari all speaking. Apologies if I missed anyone out. Watch also for the possibility that President Biden announces SPR releases to take the edge off surging gasoline prices. Otherwise, I believe today will be one of range trading with occasional snaps of volatility generated by intra-session news headline tickers.
The crypto-space looks to be the only “asset class” moving today. Both digital Dutch tulips, bitcoin and ether, have hit record highs this morning as the street continues to buy on a positive technical picture, a lower dollar, and Elon Musk’s Twitter account. I am girding myself for more “institutional experts” appearing on the news wires droning on about becoming “mainstream assets.” Whoever bought the Squid Games tokens probably isn’t feeling the same way. These experts usually only appear when cryptos rally, and I have a pile of Panadol ready to take the edge off my headache.
GBP/JPY Trades Sideways
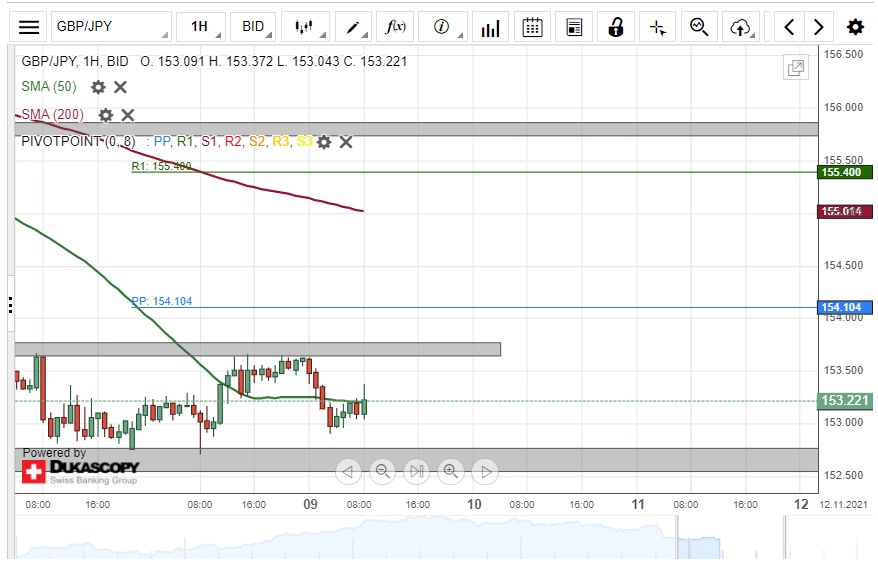
First of all note that the recent fluctuations of the GBP/JPY have provided the opportunity to adjust the support and resistance zones, which impact the rate. Namely, the rate trades between the support zone at 152.55/152.75 and the resistance of 153.65/153.75.
Meanwhile, note that between the support and resistance zone the 50-hour simple moving average is located at. The SMA has shown to manage to provide short term support and resistance.
In the case that the pair passes the resistance of the 153.65/153.75 zone, it might find resistance in the weekly simple pivot point at 154.10. Above the pivot point, the 200-hour SMA near 155.00 could serve as a resistance level.
However, a passing of the 152.55/152.75 support zone could result in the rate reaching for the 152.00 level, which had impacted the rate in early October.
AUD/USD Reveals New Pattern
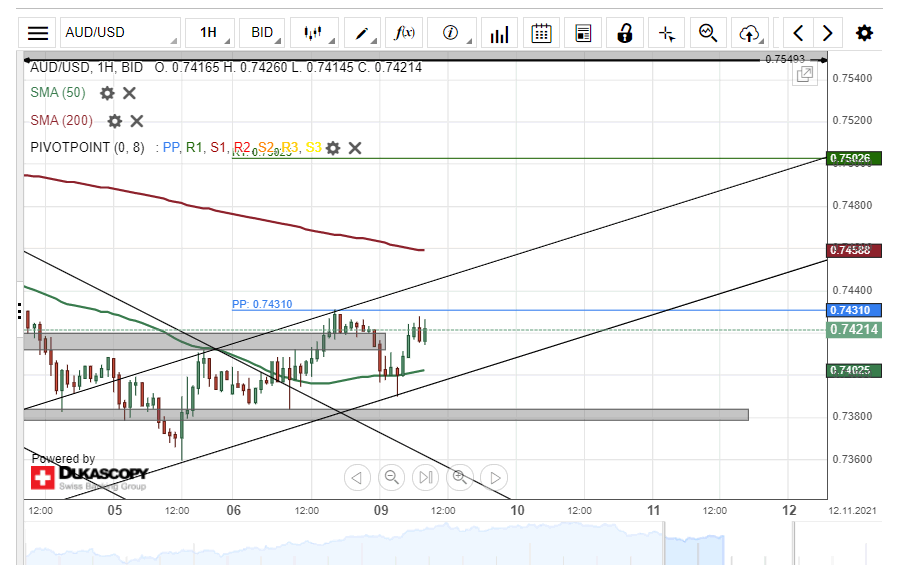
The AUD/USD breaking of the previous pattern has occurred in a channel up pattern. The minor pattern was added to the chart on Tuesday. Meanwhile, note that the pair has been respecting the support of the 50-hour simple moving average and the resistance of the weekly simple pivot point at 0.7431.
In the case that the rate continues to surge in the channel up pattern borders, it would have to pass the weekly simple pivot point at 0.7431. A passing of the pivot point could reach for the resistance of the upper trend line of the channel. Meanwhile, note that the 200-hour simple moving averages was approaching the pattern from above.
However, a bounce off from the weekly simple pivot point would result in the rate looking for support. Potentially, support could be found in the 50-hour simple moving average, which on Tuesday morning was located near 0.7403. Below the SMA, the lower trend line of the pattern could keep the rate up.
EUR/JPY Tests Support Zone
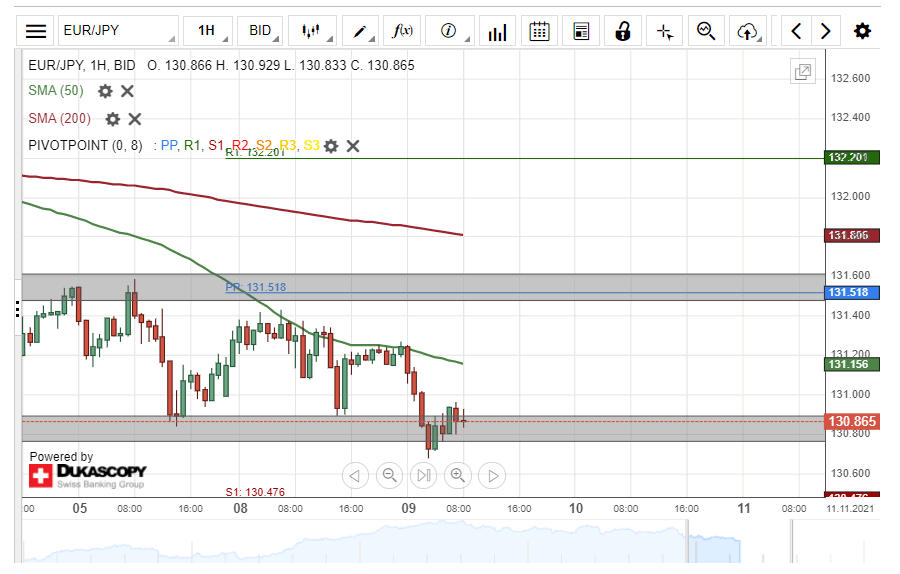
The resistance of the 50-hour simple moving average was enough for the EUR/JPY to decline to the support zone at 130.75/130.90. The first decline of the rate was stopped by the support zone.
However, on Tuesday morning, the pair shortly passed below the zone. Meanwhile, the EUR/JPY was being steadily approached by the 50-hour simple moving average from above.
If the EUR/JPY continues to decline, the rate could look for support in the 130.48 level where the weekly S1 simple pivot was located at. Below the pivot point, the 130.00 mark might act as a support level.
On the other hand, a potential recovery of the pair would face the resistance of the 50-hour simple moving average. During the early hours of Tuesday's European trading, the SMA was located near the 131.15 level. Above the SMA, the resistance zone at 131.48/131.61 could keep the EUR/JPY down.
GER 40 Consolidates Gains
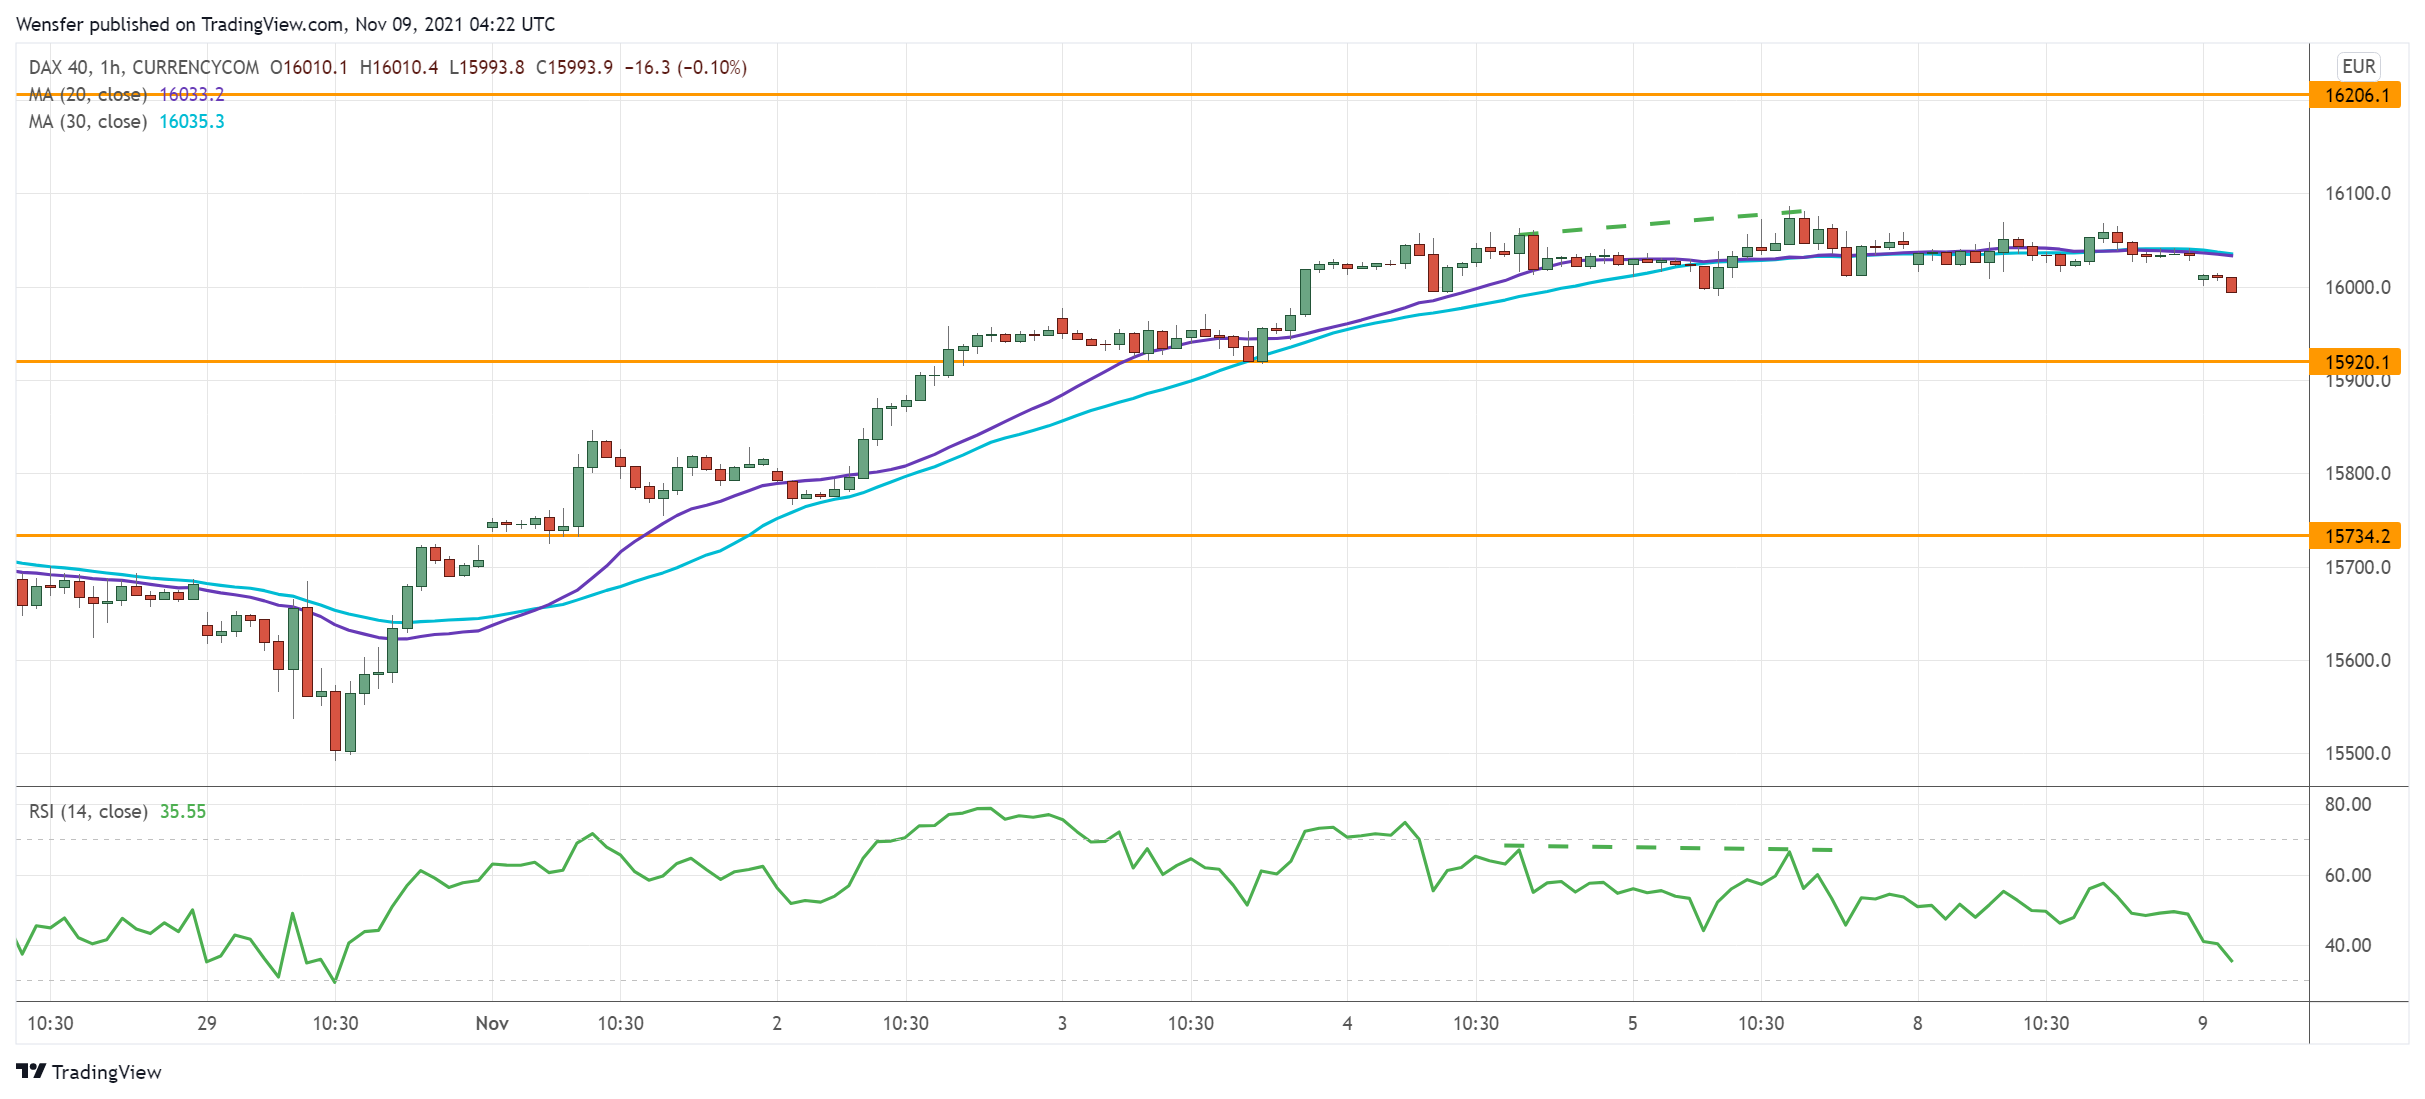
The Dax 40 continues to rally in hopes of a prolonged low-rate environment.
The bulls are pushing towards 16200 after the index reached the milestone at 16000. However, the RSI’s multiple ventures into the overbought area and a bearish divergence indicate that the rally may have overextended.
A temporary pullback would be necessary to let the bulls catch their breath. 15920 is the immediate support. Further down, 15730 on the 20-day moving average would be an area of interest.
NZD/USD Tests Key Resistance
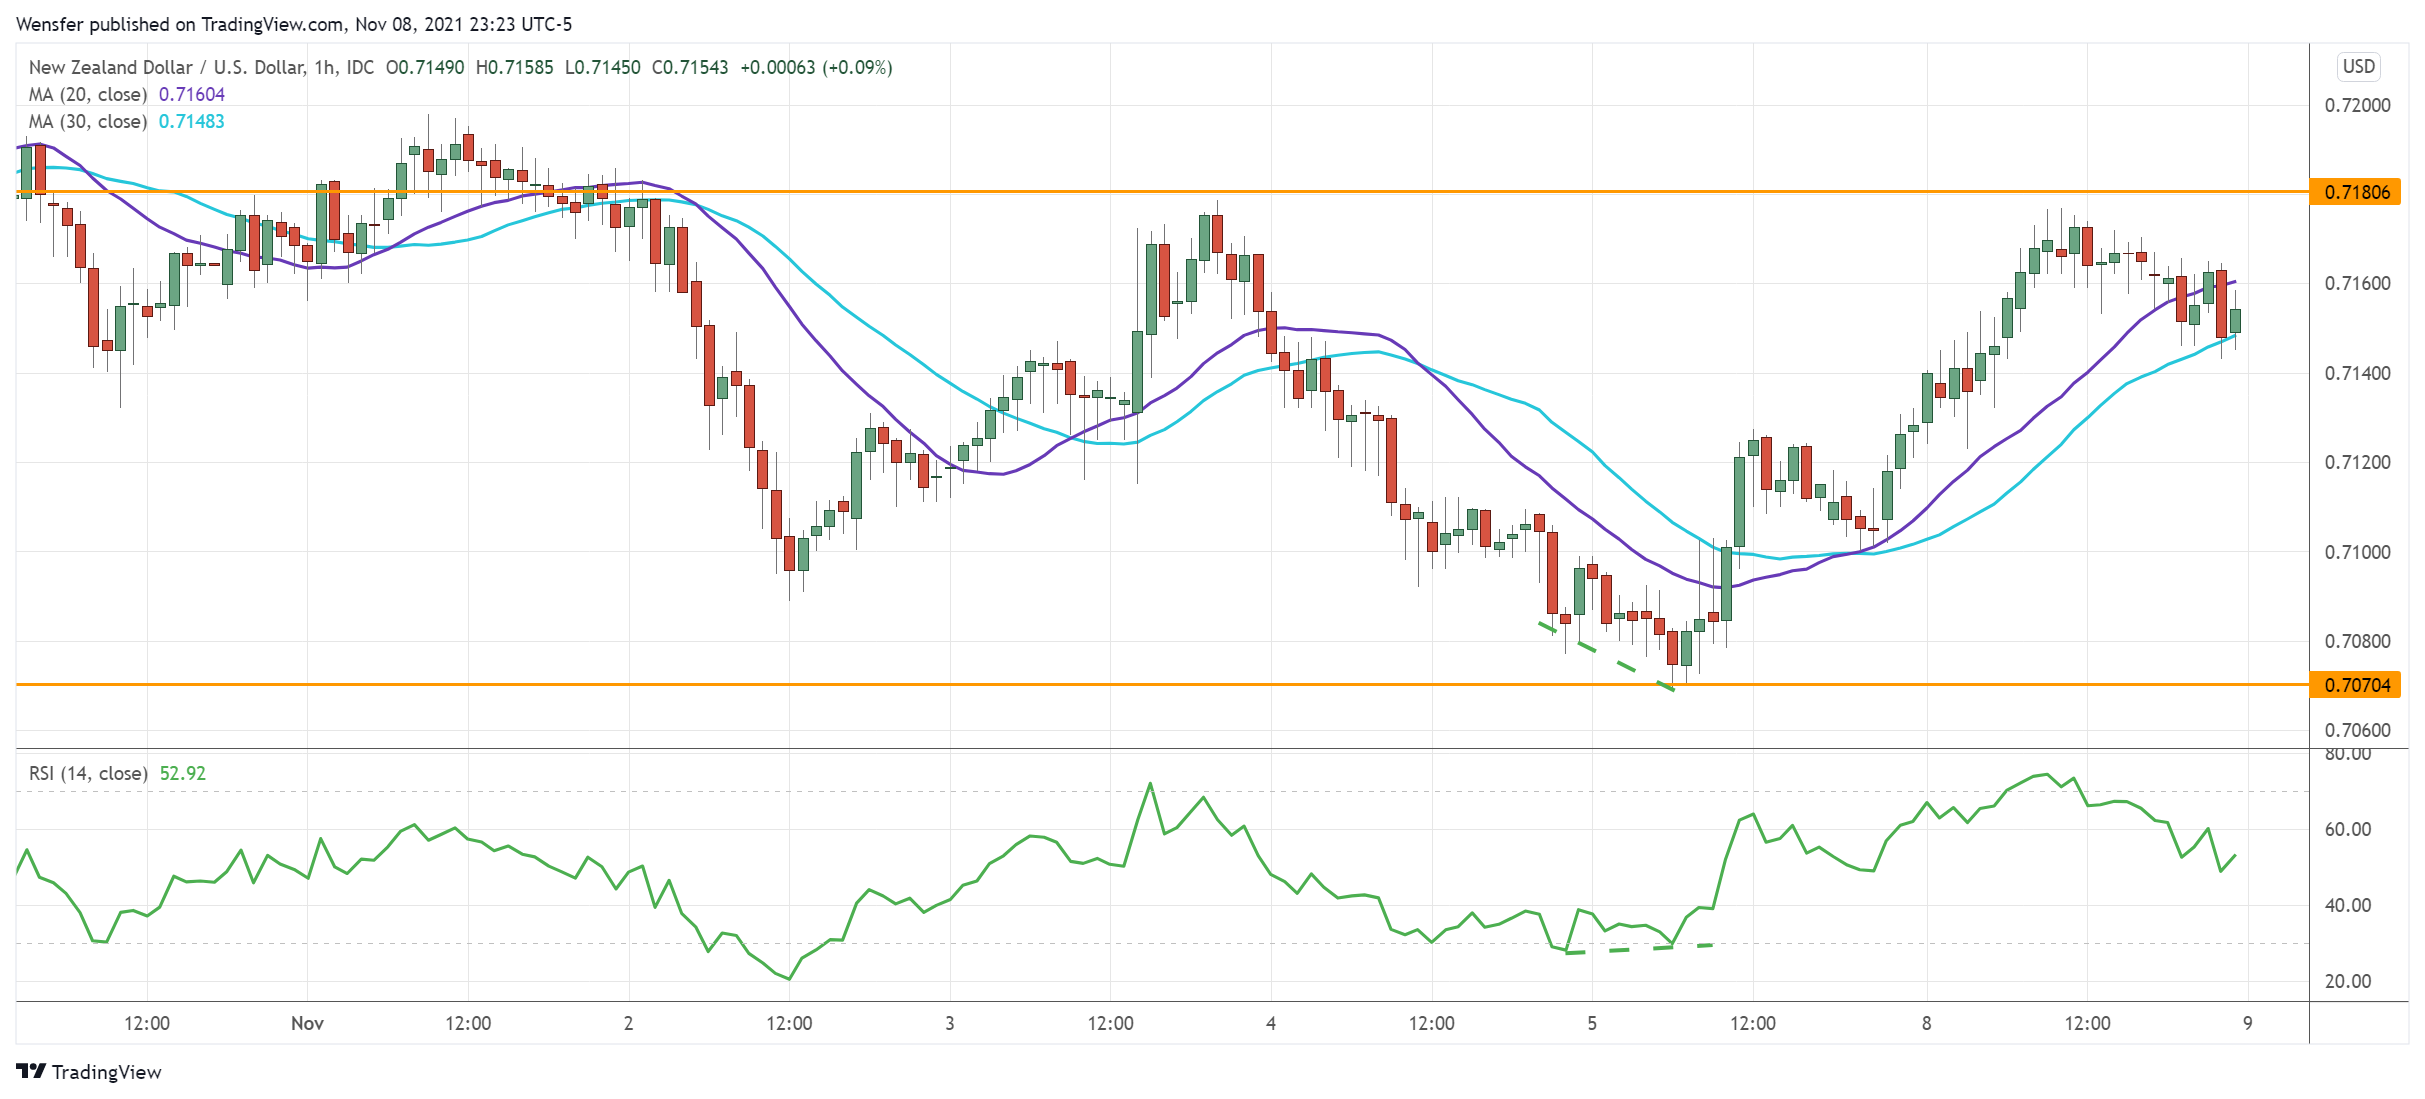
The New Zealand dollar recoups losses as risk appetite recovers. The pair has met buying interest at 0.7070 along the 20-day moving average.
A bullish RSI divergence is a sign that the bearish momentum has waned. When this happens in a demand zone, it makes a rebound of greater significance.
0.7180 is a major hurdle ahead following a previously botched bounce. Its breach may resume the kiwi’s uptrend above 0.7220. The RSI’s double top in the overbought area may briefly limit the bullish impetus.
EUR/GBP Sees A Temporary Pullback
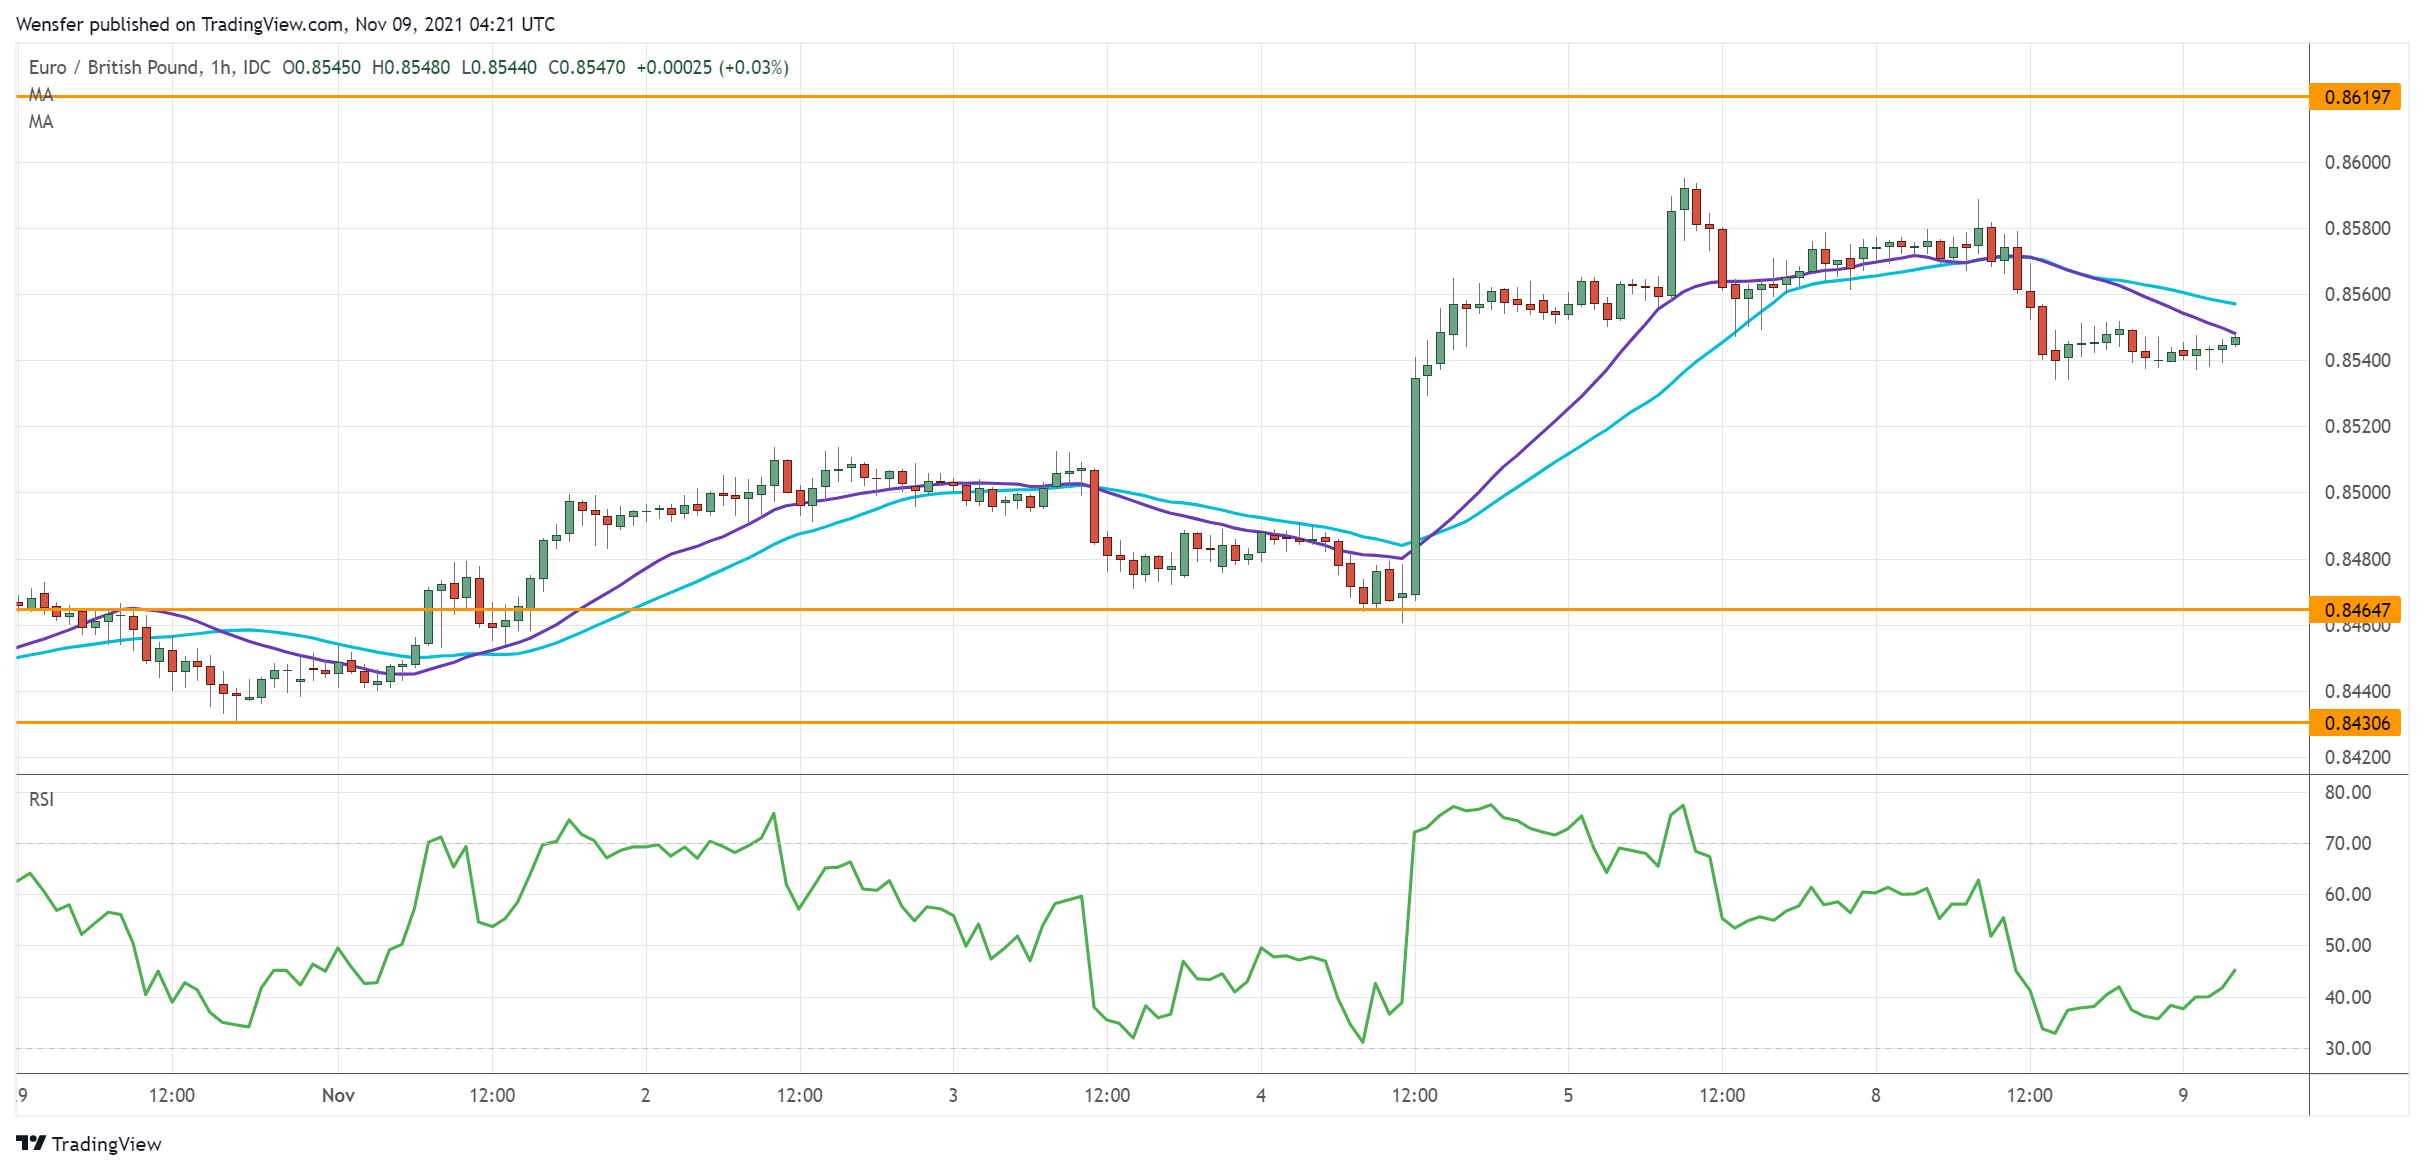
The sterling inched higher as traders took profit after the BOE’s dovish shift last week. The rally above the supply area of 0.8570 is a sign of commitment from the buy-side.
Strong momentum has forced the bears to rush for the exit door. 0.8620 is now the next resistance. Its break would bring the euro to September’s high at 0.8660, where a breakout may lead to a bullish reversal in the medium-term.
In the meantime, an overbought RSI is causing a pullback. The base of the latest surge at 0.8465 is an important support.
Daily Technical Analysis
EUR/USD
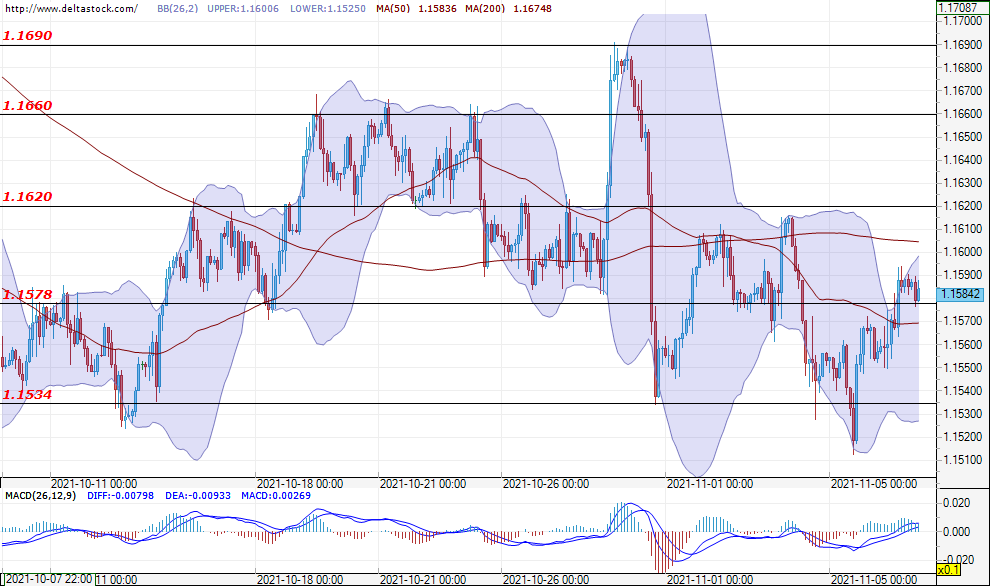
Current level - 1.1584
At the time of writing, the currency pair is trading just above the zone of 1.1578 as a result of the momentum gained by the bulls which, at the end of last week, managed to establish themselves on the market and successfully limited the sell-off to around 1.1510. The sentiment at the moment is rather neutral, with a range move between 1.1534 - 1.1620 remaining a possibility. Today's announcement of the U.S. PPI data (13:30 GMT) could lead to an increased volatility for the currency pair.
| Resistance | Support | ||
| intraday | intraweek | intraday | intraweek |
| 1.1620 | 1.1690 | 1.1578 | 1.1410 |
| 1.1660 | 1.1760 | 1.1534 | 1.1350 |
USD/JPY
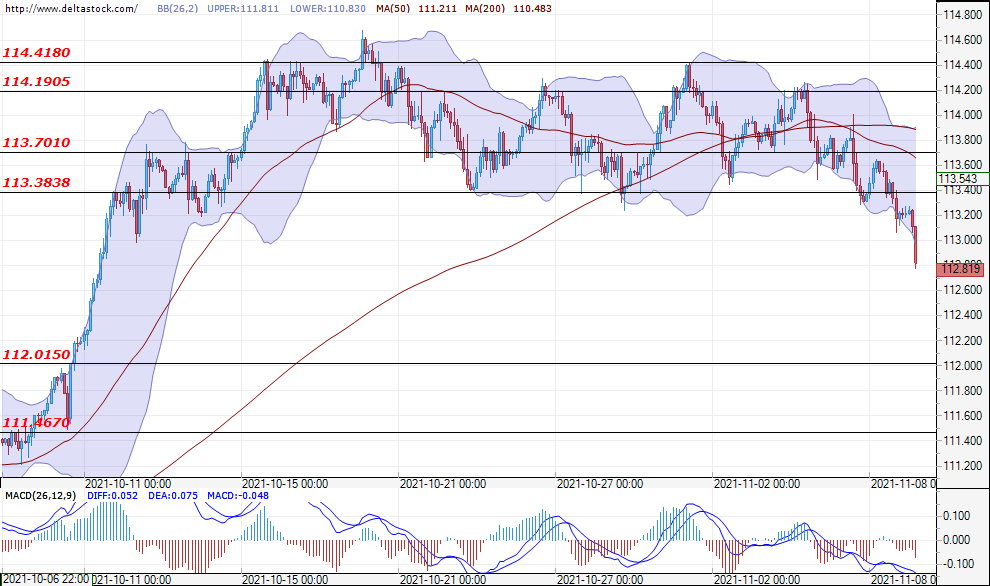
Current level - 112.81
After almost a month-long range movement in the range between 113.38 - 114.41, the bears managed to prevail and breach the support zone of 113.38. At the time of writing, the market is sitting at 112.81, with the most likely scenario being a test of the next significant support of 112.00. However, should the bulls return and only if the 113.38 level (now acting as the first important resistance) is breached, we could witness a resumption of the range-bound movement.
| Resistance | Support | ||
| intraday | intraweek | intraday | intraweek |
| 113.38 | 114.20 | 112.00 | 111.00 |
| 113.70 | 114.41 | 111.46 | 110.50 |
GBP/USD
Current level - 1.3554
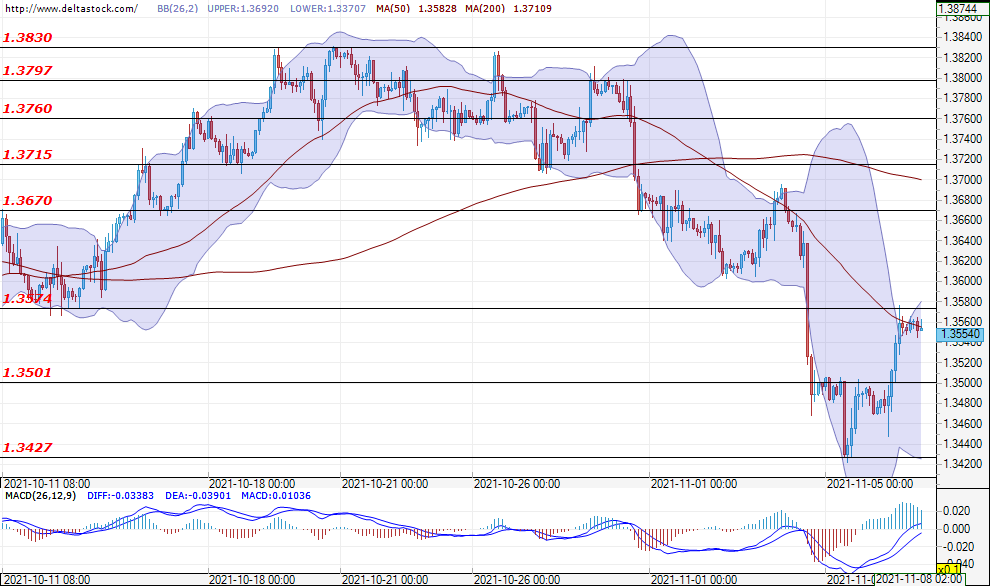
Since the end of last week, the U.S. dollar has been losing ground against the British pound, with the sell-off being limited down to the support level of 1.3427. At the time of writing, the currency pair is trading just below the resistance of 1.3574 and the most likely scenario is for an attack on the mentioned level. A successful breach here could strengthen the bullish sentiment and lead the market towards a test of the next significant resistance zone of 1.3670.
| Resistance | Support | ||
| intraday | intraweek | intraday | intraweek |
| 1.3574 | 1.3715 | 1.3500 | 1.3427 |
| 1.3670 | 1.3760 | 1.3500 | 1.3300 |