Sample Category Title
EUR/JPY Finds Resistance In 50-Huor SMA
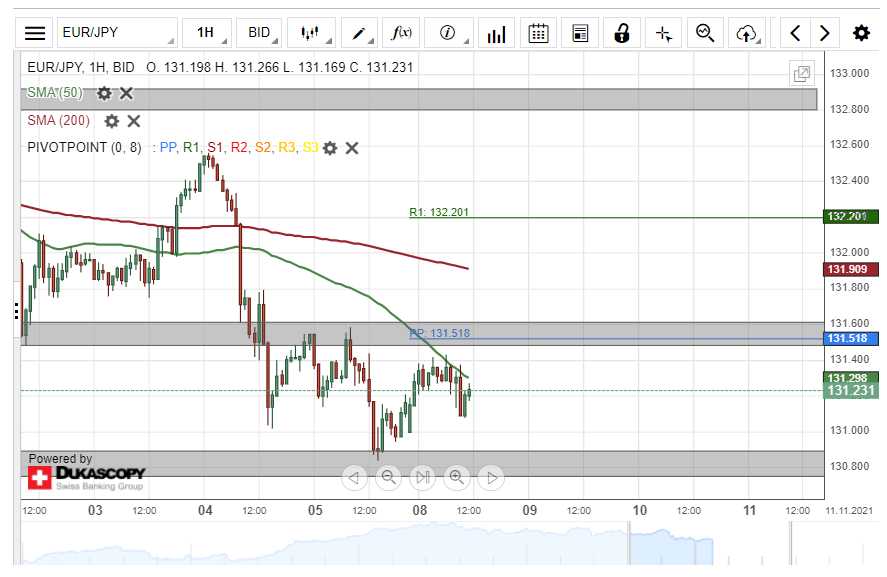
On Friday, the EUR/JPY currency exchange rate found support in the 130.75/130.90 zone. The following recovery continued into Monday until the rate encountered the resistance of the 50-hour simple moving average. Up to the middle of the day's European trading hours, the SMA was pushing the rate down.
If the simple moving average continues to push the pair down, it could once again look for support in the 130.75/130.90 zone. Below the zone, the weekly S1 simple pivot point might provide support at 130.48.
Meanwhile, a breaking of the resistance of the 50-hour SMA might result in a test of the 131.50/131.60 zone. In addition, note that the weekly simple pivot point was located at 131.52. Above the zone, the 200-hour SMA might act as a resistance level near 131.90.
China’s Trader Surplus Soared to Record High. 32 countries Scrapped Preferential Treatment amidst China’s Twisting of Trade Rules
China’s trade surplus soared to a record high of US$84.54B in October. Exports rose +27.1% y/y in October, down from +28.1% a month ago but exceeded consensus of +22.8%. Imports accelerated to +20.6% y/y from +17.6% in September. This, however, missed consensus of +26.2%.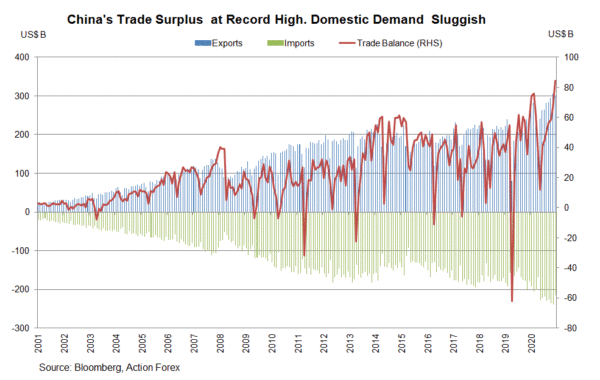
Concerning exports, shipment to EU jumped to +44.3% y/y in October, from +28.6% a month ago, while that to South Korea also accelerated to +33.1% y/y in October, from +27.9$ a month ago. Exports to India improved slightly to +46.4% y/y, compared with +46.2% in September while those to ASEAN members climbed +0.7 ppt higher to 18% y/y in October. Yet, growth of exports to the US moderated to +22.7% y/y in October, from +30.6% in the prior month.
The country’s power crisis resulted in strong energy imports. Crude oil imports expanded +56.3% y/y in October, up from +34.9% a month ago, while coal imports surged +292% y/y, following a +234% jumped in September. In contrast, iron ore imports fell -1.8% y/y in October, after gaining +41.1% in September. This was due to China’s “dual control policy” targeting high-emission sectors. While supply chain disruption delayed shipment of automobile and parts, the weaker than expected imports growth evidenced weaker domestic demand. This could be driven by China’s erratic policy change, including crackdown in real estate developers and tech companies, tightening restrictions in tuition and entertainment business. These affect employment and consumer confidence.
Outpacing of imports growth by exports growth resulted in China’s record high trade surplus. While the rise in net exports would boost GDP growth in 4Q21, the underlying reason reflected the fragile economic situation in China. Weaker domestic demand is doomed to challenge China’s plan of internal circulation in economy.
Concerning the outlook of international trade, 32 countries, including EU members, will scrap preferential tariff treatment to China from December. While economists anticipate limited impacts on China’s trade, this is a sign that the world has begun resisting China’s violation of trade rules. In WTO’s regular Trade Policy Review in October, the US, the EU, the UK among others, complained about China’s reluctance to conform to the international trade rules aiming at establishing a level playing field for all participants in the global exchange of goods and services. Supply chain disruption as a result of the coronavirus pandemic, which was originated in Wuhan, China, and the current power crisis in China, have evidenced the risks of over-reliance on China as world’s factory. Indeed, the US and its allies are in the process to shift the supply chain away from China. This could be detrimental to the country’s trade and economic growth in the long term.
NZDCAD Surpasses Its 50- And 200-Day SMA, Optimism Arises
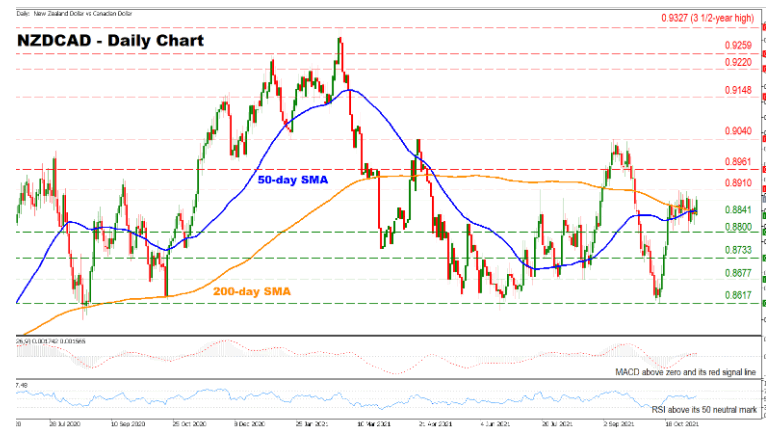
NZDCAD regained positive momentum as the pair surpassed its 50- and 200-day simple moving average (SMA) in the past couple of sessions. Moreover, the 50-day SMA has just crossed above the 200-day SMA, reviving hopes of a sustained bullish move, should this crossover be maintained over the next trading sessions.
The cautiously optimistic outlook and the recent price appreciation are also supported by the short-term momentum indicators as the RSI is increasing above its 50 neutral mark, while the MACD is found above zero and its red signal line.
Should the price break above its 0.8910 level, the bulls may then target the 0.8961 region. Surpassing this barrier could pave the way towards testing the strong 0.9040 resistance. Any advances beyond that crucial level could strengthen the positive outlook for the pair, sending the price towards its 0.9148 resistance.
On the flip side, if the price breaks below the congested region that includes the 0.8841 support and the 50- and 200-day SMA currently at 0.8855 and 0.8850 respectively, this could turn the cards around for the pair, sending the bears to test the 0.8800 support. A further descending movement from this level could intensify selling pressures, sending the pair to test its 0.8733 level.
In brief, the overall outlook for the NZDCAD is cautiously positive. However, this might change if the price breaks below the congested region, including the 50- and 200-day SMAs, while surpassing the strong 0.9040 level could strengthen the pair’s positive momentum.
The Analytical Overview Of The Main Currency Pairs
The EUR/USD currency pair
Technical indicators of the currency pair:
Prev Open: 1.1552
Prev Close: 1.1567
% chg. over the last day: +0.13%
Europe is again in the epicenter of the COVID-19 Pandemic. According to the WHO, hospitalizations of patients with Covid-19 have more than doubled in just one week, with cases approaching record levels due to the more infectious Delta strain. All of this could lead to new quarantine restrictions in European countries, undoubtedly leading to lower economic numbers.
Trading recommendations
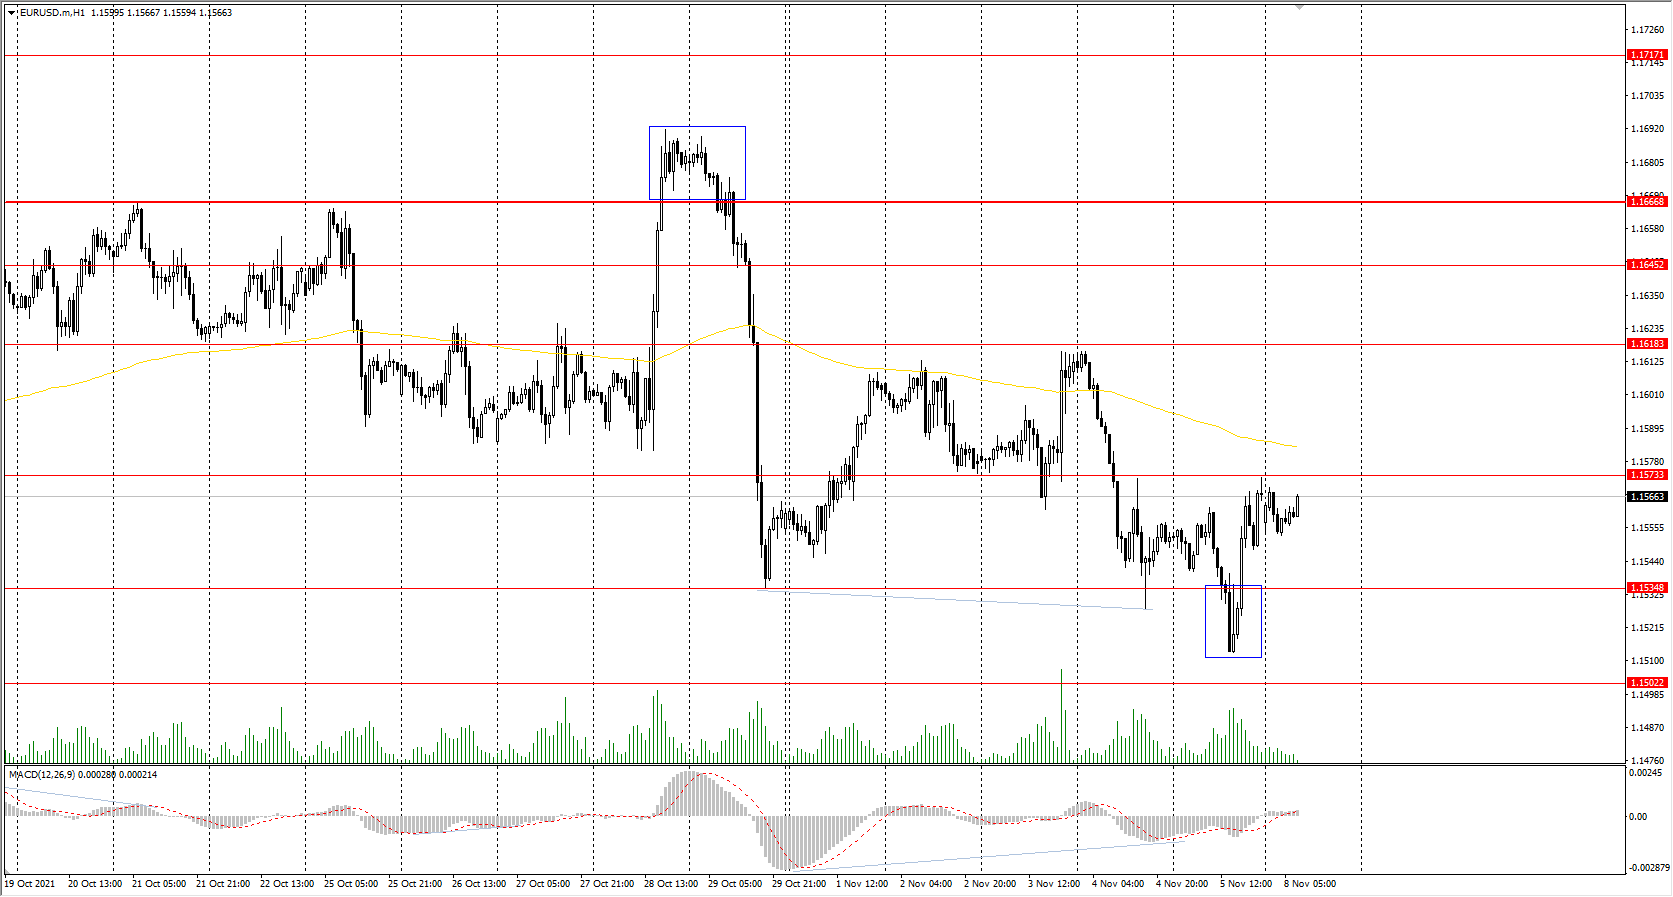
Support levels: 1.1535, 1.1502, 1.1453
Resistance levels: 1.1573, 1.1618, 1.1645, 1.1667, 1.1717, 1.1772
From the technical point of view, the EUR/USD on the hour time frame is bearish. But the price managed to return above the breakdown level, which indicates a possible false break move. The MACD indicator also shows a divergence. Under such market conditions, traders should consider sell positions from the resistance levels near the moving average. It is best to look for buy trades from the false breakdown zone.
Alternative scenario: if the price breaks out through the 1.1667 resistance level and fixes above, the mid-term uptrend will likely resume.
News feed for 2021.11.08:
- US FOMC Member Clarida’s Speech at 16:00 (GMT+2);
- US FED Chair Powell’s Speech at 17:30 (GMT+2);
- US FOMC Member Williams’s Speech at 17:55 (GMT+2);
- US FOMC Member Bowman’s Speech at 19:00 (GMT+2);
- US FOMC Member Evans’s Speech at 20:50 (GMT+2).
The GBP/USD currency pair
Technical indicators of the currency pair:
Prev Open: 1.3496
Prev Close: 1.3494
% chg. over the last day: -0.01%
The British pound is under intense selling pressure after the central bank of England did not tighten its monetary policy. Before the meeting, analysts were sure that it would happen, and the Governor of the Bank of England said that such a possibility existed. The British currency is now looking less confident than the Euro. The British pound may be supported only by the growing Brent oil quotes, as these two instruments are historically correlated.
Trading recommendations
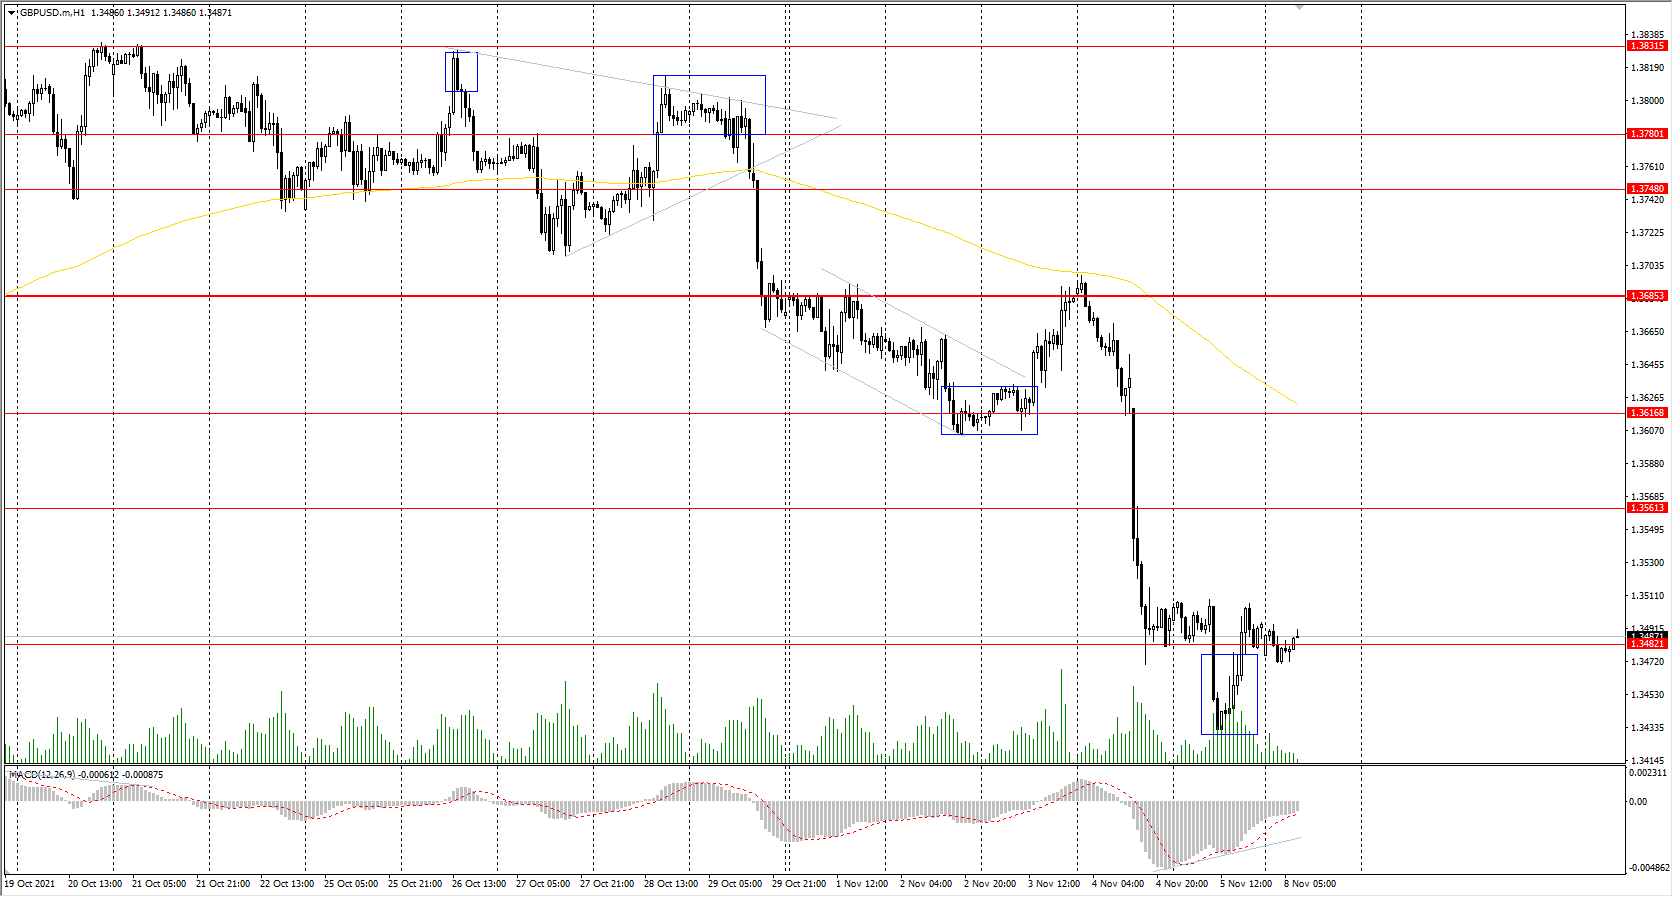
Support levels: 1.3482, 1.3360
Resistance levels: 1.3562, 1.3616, 1.3685, 1.3748, 1.3780, 1.3831, 1.3886
On the hourly time frame, the trend on GBP/USD is bearish. The MACD indicator is in the negative zone, but there are signs of divergence. After Friday's false breakdown, traders can look for buy trades on the lower time frames with the expectation of a technical rebound. It is best to look for sell deals from the resistance levels around the moving average, as prices have deviated strongly from the averages.
Alternative scenario: if the price breaks out through the 1.3685 resistance level and consolidates above, the bullish scenario will likely resume.
News feed for 2021.11.08:
- US FOMC Member Clarida’s Speech at 16:00 (GMT+2);
- US FED Chair Powell’s Speech at 17:30 (GMT+2);
- US FOMC Member Williams’s Speech at 17:55 (GMT+2);
- US FOMC Member Bowman’s Speech at 19:00 (GMT+2);
- US FOMC Member Evans’s Speech at 20:50 (GMT+2).
The GBP/USD currency pair
Technical indicators of the currency pair:
Prev Open: 1.3496
Prev Close: 1.3494
% chg. over the last day: -0.01%
The British pound is under intense selling pressure after the central bank of England did not tighten its monetary policy. Before the meeting, analysts were sure that it would happen, and the Governor of the Bank of England said that such a possibility existed. The British currency is now looking less confident than the Euro. The British pound may be supported only by the growing Brent oil quotes, as these two instruments are historically correlated.
Trading recommendations
Support levels: 1.3482, 1.3360
Resistance levels: 1.3562, 1.3616, 1.3685, 1.3748, 1.3780, 1.3831, 1.3886
On the hourly time frame, the trend on GBP/USD is bearish. The MACD indicator is in the negative zone, but there are signs of divergence. After Friday's false breakdown, traders can look for buy trades on the lower time frames with the expectation of a technical rebound. It is best to look for sell deals from the resistance levels around the moving average, as prices have deviated strongly from the averages.
Alternative scenario: if the price breaks out through the 1.3685 resistance level and consolidates above, the bullish scenario will likely resume.
The USD/CAD currency pair
Technical indicators of the currency pair:
Prev Open: 1.2455
Prev Close: 1.2452
% chg. over the last day: -0.02%
The Canadian dollar is a commodity currency, so the USD/CAD currency pair highly depends on the dollar index dynamics and oil prices. On Friday, the dollar index remained at the same level, while oil prices increased by the end of the day. As a result, USD/CAD quotes slightly decreased due to strengthening the Canadian currency. The unemployment rate in Canada fell from 6.9% to 6.7%.
Trading recommendations
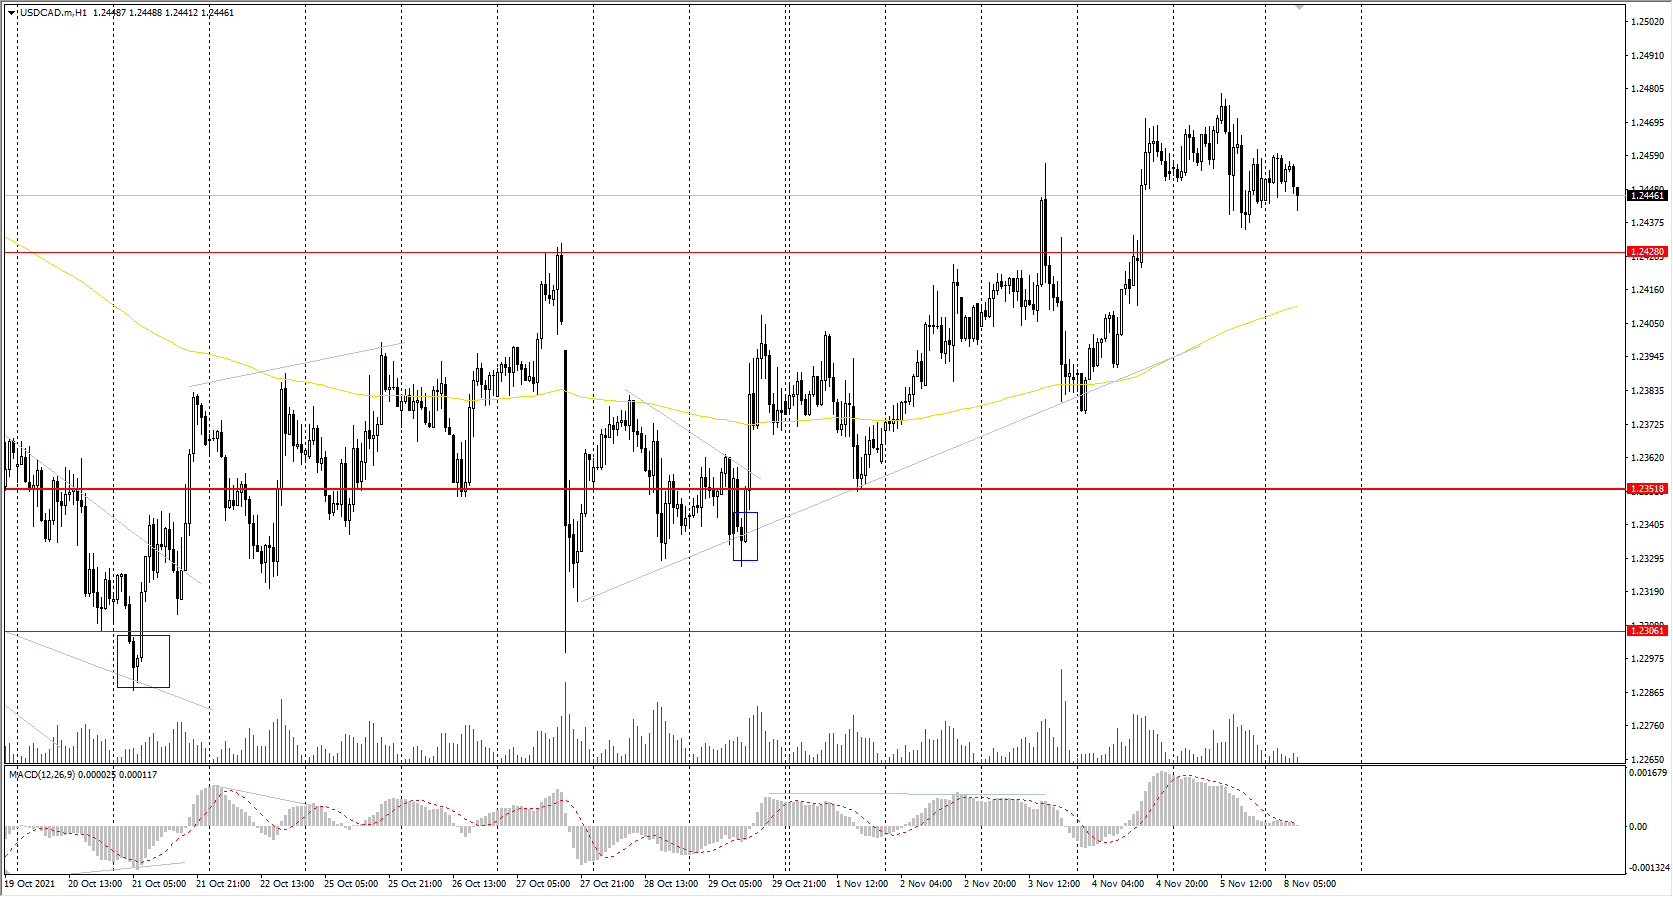
Support levels: 1.2428, 1.2352, 1.2306, 1.2260
Resistance levels: 1.2518, 1.2565, 1.2628, 1.2729, 1.2774
From the technical point of view, the USD/CAD currency trend has changed to bullish. The price broke through the priority change level and consolidated above. The MACD indicator has become inactive, and there are no signs of reversal. Under such market conditions, it is better to look for buy trades from the support levels, given there is the buyers' initiative. Sell deals should be considered from the resistance levels of the higher time frame.
Alternative scenario: if the price breaks down through the 1.2351 support level and fixes below, the downtrend will likely resume.
Pfizer And Merek Are Going To Approve Covid-19 Drug
Last week, investors' attention was focused on US nonfarm payrolls data and the FOMC meeting. The Federal Reserve officially announced the reduction of the QE program. An interest rate hike is scheduled for the middle of next year. The labor market statistics were improving. The US economy added 531,000 (vs. 455 000 expected) jobs in October. The US Unemployment Rate fell to 4.6%. On the other hand, the US labor productivity fell in the third quarter, reflecting a sharp slowdown in economic growth and an increase in the number of working hours.
The US stock market ended Friday's trading with growth. At the close of the day the Dow Jones increased by 0.56% (+1.38% for the week), the S&P 500 gained 0.37% (+1.88% for the week), and the NASDAQ technology index increased by 0.20% (+2.77% for the week). But last week's growth leader was the Russell 2000 index, which jumped by 5.88% by the end of the week, indicating the strengthening of small-cap companies. All four indices hit new all-time highs on Friday.
Pfizer announced that their antiviral COVID-19 drug reduced the risk of hospitalization or death by 89% in an interim analysis of the EPIC-HR phase 2/3 study. The company plans to provide data to the FDA soon for approval for emergency use of the drug. Already more than 50 countries appealed to Pfizer for the COVID-19 medicine.
The UK will begin releasing Merck's antiviral tablet Molnupiravir as part of a drug trial against COVID-19 later this month.
The White House says it is preparing to purchase the COVID-19 drug from both Merck and Pfizer.
European stock indices also closed the week with growth. By the end of the week, the British FTSE 100 gained 0.92%, the German DAX added 1.84%, the Spanish IBEX 35 increased by 0.7%, the Italian FTSE MIB added 2.24%, and the French CAC 40 jumped by 2.48% and became a growth leader. Eurozone industrial production unexpectedly decreased in September, indicating a long-term impact of restrictions on the supply and shortage of semiconductors.
Asian stocks fell on Friday. Japan's Nikkei index decreased by 0.61% (+2.75% for the week), Hong Kong's Hang Seng lost 1.41% (-1.57% for the week), China's benchmark CSI 300 index decreased by 0.54% (-0.73% for the week), the exception was Australia's ASX 200, which increased by 0.39% (+1.60% for the week) on Friday.
In the commodities market, sugar futures (+3.68%), natural gas (+3.63%), lumber (+3.3%), palladium (+2.46%), gold (+2.02%), and cotton (+1.95%) showed the biggest gains by the end of the week. Soybean oil futures (-3.93%), cocoa (-3.77%), soybeans (-3.64%), WTI oil (-2.87%), gasoline (-2.73%), corn (-2.73%), and orange juice (-2.72%) showed the largest drop.
Saudi Arabia and its OPEC+ allies rejected US President Joe Biden's calls for a significant increase in production. That leaves Biden's ability to use the US strategic reserve.
"The oil market is short of supply, it has entered a period of strong volatility, and prices will continue to rise in the near and medium-term. The emerging disagreement between OPEC and the US administration, the possible release of oil from the US strategic reserves, and the potential resumption of talks with Iran on the nuclear program will increase the volatility of oil prices in the coming weeks," Goldman Sachs analysts said.
Gold prices unexpectedly increased last week, despite rises in both the dollar index and government bond yields, which have an inverse correlation with gold prices. Analysts are confident that the rise in gold is not supported fundamentally, so they expect gold and silver prices to decline in the coming weeks.
Main market quotes:
- S&P 500 (F) 4,697.53 +17.47 (+0.37%)
- Dow Jones 36,327.95 +203.72 (+0.56%)
- DAX 16,054.36 +24.71 (+0.15%)
- FTSE 100 7,303.96 +24.05 (+0.33%)
- USD Index 94.22 -0.13 (-0.14%)
Important events for today:
- US FOMC Member Clarida’s Speech at 16:00 (GMT+2);
- US FED Chair Powell’s Speech at 17:30 (GMT+2);
- US FOMC Member Williams’s Speech at 17:55 (GMT+2);
- UK BoE Gov Bailey’s Speech at 19:00 (GMT+2)
- US FOMC Member Bowman’s Speech at 19:00 (GMT+2);
- US FOMC Member Evans’s Speech at 20:50 (GMT+2).
US Dollar Eases Post-NFP
US yields, dollar retreat despite strong NFP
The US dollar slipped once again on Friday after the recovery in US Non-Farm Payrolls data, as US yields retreated slightly in a somewhat surprising reaction. With markets twisting any data inputs to a recovery narrative linked to the FOMC’s no rate hikes post-taper mantra, the dollar index slipped slightly, falling 0.12% to 94.22. That said, currency markets appear to be distancing themselves from the ever-bullish equity space in this respect, with the greenback holding onto almost all its recent gains, remaining near two-month highs. With Nasdaq and S&P futures slipping in Asia, the dollar index has unwound Friday’s losses, rising 0.10% to 94.30 in Asia. 93.80 remains the index’s key pivot point and support, while it has well-defined resistance just above 94.50. A close above 94.60 will signal the next leg of the US dollar’s rally.
EUR/USD has slipped to 1.1560 this morning, with GBP/USD easing 0.15% to 1.3475, although both remain not far from Friday’s close. Threats by the UK to enact Brexit protocols over Northern Island are sharply escalating tensions and weighing on both currencies. 1.1500 and 1.3400 are the levels to watch with Brexit tensions likely to play more heavily with sterling. The Japanese yen was the primary winner from the Non-Farm data as the slide in US yields saw USD/JPY fall 0.30$ to 113.40 before rising to 115.60 in Asia. The cross remains at the mercy of the US/Japan rate differential with support holding at 113.40, while a rise through 114.70 signals more gains above 115.00.
AUD/USD and NZD/USD remain almost unchanged over the past two sessions, at 0.7400 and 0.7126, respectively. An easing of Auckland restrictions was announced today, lifting NZD/USD slightly. Interestingly, the wave of bullish sentiment in North America has failed to lift either currency and suggests that both remain vulnerable to further slides if that sentiment dips.
Asian currencies hardly moved on Friday after the US data, as China continues to hold the yuan firm to help offset higher energy prices. The record balance of payments data from China has had no reaction on forex markets today. Regional currencies remain locked in range trading with two notable exceptions, the Thai baht and Indonesian rupiah. The THB continued to receive an international travel reopening boost. Meanwhile, the IDR has rallied sharply today, USD/IDR falling 0.80% to 14,555.00 this morning. Higher oil prices will have helped, but I wonder if the Bank of Indonesia has intervened ahead of 14,400.00 as IDR has been trading to the weak side over the past week. Asian currencies remain in a cautiously watchful mood, perhaps nervous that US markets will have a delayed reaction to the recent run of data and the start of the Fed taper, sending US yields higher.
Saudi Raises Prices, Gold Jumps On NRP
Saudi Arabia hikes prices to Asia
With OPEC+ refusing to bow to external pressure last week and raise production targets, and with the US Non-Farm Payrolls data outperforming, oil prices finished last week on a very positive note. Brent crude rose 1.75% to USD 82.30, and WTI leapt 2.50% higher to USD 81.35 a barrel.
Over the weekend, Saudi Aramco announced a sharp hike in light crude prices to Asian customers in December by USD 1.40 to a USD 2.70 per barrel premium. Markets had forecast a hike of between USD 0.50 and USD 1.00, which caught Asia off guard this morning. Northern Asian markets, all massive energy importers, fell today, and crude prices have increased sharply in regional trading. Brent crude has jumped by 1.55% to USD 83.60, and WTI has risen by 1.05% to USD 82.25 a barrel.
With Reuters reporting today that China’s state grid is warning of tight winter supply still, and with international travel reopening today in the US, (think jet fuel demand), as well as ongoing easings in Asia/Pacific, and crude stocks at shallow levels in the US Cushing Hub, oil’s fundamentals remain constructive. OPEC+ is not raising production, and natural gas prices continue to hold at high levels.
Brent crude has resistance at USD 85.25 and USD 86.00 with support at USD 82.50 and USD 82.00 a barrel. WTI has resistance at USD 83.50 and USD 85.00, with support at USD 81.00 a barrel.
Gold explodes higher after US data
The rather bizarre post-Non-Farm Payroll price action was capped by gold’s explosive rally on Friday, despite US yields and the US dollar easing only slightly. Gold rose 1.50% to USD 1818.00 an ounce, gaining over 26 dollars on the day. In Asia, trading is subdued, but gold has slightly increased by 0.10% to USD 1819.85 an ounce.
As with previous gold rallies, I am taking Friday’s one with a massive grain of salt. The price action suggests that stop-losses were triggered through USD 1800.00 and USD 1810.00, along with the usual rush of trend-following and fast money buyers. If past performance is a judge, none of that positioning is “sticky,” with a zero tolerance for any adverse movements against the positioning. In other words, it will rush for the exit door and sell as soon as gold starts moving lower, causing another downside spike.
Nevertheless, if gold can hang on to these gains, things could be about to get interesting on the upside. If gold can hold above its well-defined resistance zone between USD 1832.00 and USD 1835.00 an ounce, it will trigger an inverse head-and-shoulders pattern that would target a return to USD 2000.00 an ounce. Support is at USD 1800.00 and USD 1785.00 an ounce, although I suspect that a fall through USD 1810.00 will be enough to trigger a mad fast-money dash for the exit door.
Focus On Upcoming US Inflation Data Later This Week
Notes/Observations
- Focus on upcoming US inflation data (PPI on Tues, CPI on Wed) and various Fed speakers.
- Brexit issues continue to fester with UK said to threaten Article 16 soon.
Asia
- China Oct Trade Balance registered a record surplus ($84.5B v $64.0Be); Exports Y/Y: 27.1% v 22.4%e; Imports Y/Y: 20.6% v 26.0%e.
- China Oct Foreign Reserves: $3.218T v $3.202Te.
Coronavirus
- No COVID deaths reported in Japan for 1st time in 15 months.
- New Zealand PM announced that Auckland's lockdown settings would ease from midnight Wednesday (Nov 10th) with retailers allowed to open.
Europe
- EU's Sefcovic stated that was trying intensely to find common ground with the UK but had not seen any movement at all from the UK side, urged UK side to engage with EU sincerely. Stressed that UK triggering Article 16 would be a serious matter for EU/UK relations. The agreement was clear on fishing rights and that all French vessels seeking a license should get one. To meet with UK Brexit Min Frost in London on Friday, Nov 12th.
Americas
- House passed bipartisan $1.2T infrastructure bill, clearing the way for President Biden's signature Reminder: The second bill, the "Build Back Better Act" now has $1.75T in planned expenditure).
Energy
- UAE Energy Min Mazrouei stated that OPEC+ was working to balance market and must incentive investments.
Speakers/Fixed income/FX/Commodities/Erratum
Equities
- Indices [Stoxx600 -0.05% at 483.20, FTSE -0.03% at 7,301.70, DAX -0.11% at 16,036.25, CAC-40 +0.09% at 7,046.77, IBEX-35 -0.02% at 9,128.50, FTSE MIB -0.21% at 27,738.00, SMI +0.10% at 12,333.66, S&P 500 Futures +0.04%].
- Market Focal Points/Key Themes: European indices open mixed with slight downward bias and failed to gain traction as the session wore on; sectors among those trending higher are materials and utilities; while sectors trending lower include industrials and consumer discretionary; Alcon Acquires Ivantis; focus on continuing EuroGroup meeting; Playtech confirms takeover approach from Gopher; Richemont discloses Third Point is building stake; earnings during the upcoming US session include RadNet, Astronics and CECO Environment.
Equities
- Healthcare: Coloplast [COLOB.DK] +4% (acquisition).
- Industrials: Henkel [HEN3.DE] -5% (earnings; outlook cut).
- Technology: Sonova [SOON.CH] -2% (implants recall).
- Materials: Covestro [1COV.DE] +1% (earnings), Kingspan [KGP.UK] +1% (trading update).
Speakers
- ECB's Lane (Ireland, chief economist) stated that the current level of inflation was very unusual but not chronic; reiterated Council view of expecting inflation rate to fall in 2022 and that it must not overreact to temporary rise in inflation.
- Ireland Foreign Min Coveney stated that evidence suggested UK govt was preparing to trigger Article 16 of the Northern Ireland Protocol. He saw this as a very severe and something the EU would want to prevent.
- German govt said to be eyeing up to €10B in additional tax revenue per year.
- EU Commission Pres Von der Leyen stated at a budget conference that the region needed €470B investment for the 2030 climate targets.
- Poland Central Bank's Gatner stated that CPI projections might be out of date. CPI might reach 7% already in Nov while the projection probably saw it at that level in 1Q. Did not rule out CPI reaching 9% in Jan.
- Poland Central Bank (NBP) Quarterly Inflation Report (QIR) raised the 2021 CPI forecast from 4.2% to 4.9% and raised the 2022 CPI forecast from 3.3% to 5.8% (both above target range). It tweaked the 2023 CPI from 3.4% to 3.6%. QIR raised the 2021 GDP growth forecast from 5.0% to 5.3% while cutting the 2022 GDP growth outlook from 5.4% to 4.9%.
- Japan PM Kishida stated to support investment into high-end semi-conductors. To create new IPO system to support start-ups.
- Japan New Capitalism Panel said to recommend tax breaks for companies that raise wages. Considering review of quarterly reporting system and consider SPACs to help startups.
Currencies/Fixed Income
- USD steady with focus on upcoming US inflation data (PPI on Tues, CPI on Wed) and Fed speakers.
- EUR/USD at 1.1560 in quiet trading while USD/JPY drifted lower to test 113.40.
- GBP/USD was initially softer as rising tensions continued to percolate between the UK and EU over the Norther Ireland protocol. Pair tested 1.3450 before rebounding back towards the 1.35 area.
Economic data
- (SE) Sweden Oct SEB Housing-Price Indicator: No est v 38 prior.
- (ZA) South Africa Oct Gross Reserves: $57.5B v $57.1B prior; Net Reserves: $55.4B v $55.2Be.
- (CH) Swiss Oct Unemployment Rate: 2.5% v 2.6%e; Unemployment Rate (seasonally adj): 2.7% v 2.7%e.
- (FI) Finland Sept Preliminary Trade Balance: +€0.1B v -€0.6B prior.
- (NO) Norway Sept Industrial Production M/M: 3.3% v 2.7% prior; Y/Y: 7.9% v 2.7% prior.
- (NO) Norway Sept Manufacturing Production M/M: 0.6% v 0.0% prior; Y/Y: 3.6% v 2.2% prior.
- (MY) Malaysia end-Oct Foreign Reserves: $116.1B v $115.6B mid-month reading.
- (CZ) Czech Sept National Trade Balance (CZK): -13.3B v -3.5Be.
- (CZ) Czech Sept Industrial Output Y/Y: -4.0% v -1.7%e; Construction Output Y/Y: 2.2% v 1.2% prior.
- (HU) Hungary Sept Preliminary Trade Balance: €0.0B v -€0.8B prior.
- (TW) Taiwan Oct Trade Balance: $6.1B v $6.6Be; Exports Y/Y: 24.6% v 25.0%e; Imports Y/Y: 37.1% v 38.0%e.
- (CZ) Czech Oct Unemployment Rate: 3.4% v 3.5% prior.
- (CH) Swiss weekly Total Sight Deposits (CHF): 718.4B v 717.1B prior; Domestic Sight Deposits: 643.7B v 645.3B prior.
- (EU) Euro Zone Nov Sentix Investor Confidence: 18.3 v 15.0e.
Fixed income Issuance
- None seen.
Looking Ahead
- (EU) European Finance Ministers (Eurogroup).
- (RU) Russia Oct Light Vehicle Car Sales Y/Y: No est v -22.6% prior.
- (IT) Bank of Italy (BOI) Balance-Sheet Aggregates.
- (CO) Colombia Oct Consumer Confidence Index: No est v -3 prior.
- 05:25 (EU) Daily ECB Liquidity Stats.
- 05:30 ((DE) Germany to sell €4.0B in 6-month BuBills.
- 06:00 (IL) Israel to sell bonds.
- 06:00 (IE) Ireland Sept Industrial Production M/M: No est v -2.8% prior; Y/Y: No est v 24.3% prior.
- 06:00 (CL) Chile Oct CPI M/M: 0.9%e v 1.2% prior; Y/Y: 5.6%e v 5.3% prior.
- 06:00 (BR) Brazil Oct FGV Inflation IGP-DI M/M: 1.3%e v -0.6% prior; Y/Y: 20.7%e v 23.4% prior.
- 06:25 (BR) Brazil Central Bank Weekly Economists Survey.
- 06:30 (CL) Chile Oct Trade Balance: -$0.3Be v +$0.1B prior; Total Exports: No est v $7.4B prior; Total Imports: No est v $7.4B prior; Copper Exports: No est v $4.2B prior.
- 06:30 (CL) Chile Oct International Reserves: No est v $53.3B prior.
- 06:55 (US) Daily Libor Fixing.
- 07:00 (MX) Mexico Aug Gross Fixed Investment: 11.8%e v 15.7% prior.
- 07:00 (MX) Mexico Oct Vehicle Production: No est v 208.1K prior; Vehicle Exports: No est v 195.3K prior.
- 08:00 (RU) Russia Gold and Forex Reserve w/e Nov 5th: No est v $621.6B prior (Oct 22nd week).
- 08:00 (BR) Brazil Oct Vehicle Production: No est v 173.3K prior; Vehicle Sales: No est v 155.1K prior; Vehicle Exports: No est v 195.3K prior.
- 08:00 (UK) Daily Baltic Dry Bulk Index.
- 08:00 (IN) India announces details of upcoming bond sale (held on Fridays).
- 09:00 (FR) France Debt Agency (AFT) to sell €5.1-6.3B in 3-month, 6-month and 12-month bills.
- 09:45 (UK) BOE to buy £1.47B in APF Gilt purchase operation.
- 10:30 (US) Fed Chair Powell opening remarks at conference.
- 11:30 (US) Treasury to sell 13-Week and 26-Week Bills.
- 13:00 (US) Treasury to sell 3-Year Notes.
- 14:00 (US) Fed’s Harker.
- 14:00 (US) Fed’s Bowman.
- 15:30 (US) Fed’s Evans.
- 16:00 (NZ) New Zealand Oct Heavy Truckometer M/M: No est v 13.4% prior.
- 16:45 (NZ) New Zealand Oct Total Card Spending M/M: No est v 1.6% prior; Retail Card Spending M/M: No est v 0.9% prior.
- 17:30 (AU) Australia ANZ Roy Morgan Weekly Consumer Confidence Index: No est v 108.4 prior.
- 18:30 (JP) Japan Sept Labor Cash Earnings Y/Y: 0.6%e v 0.6% prior (revised from 0.7%); Real Cash Earnings Y/Y: -0.1%e v +0.1% prior (revised from 0.2%).
- 18:50 (JP) Japan Oct Bank Lending: No est v 0.6% prior ; Bank Lending (ex-trusts): No est v 0.4% prior.
- 18:50 (JP) Japan Current Account Balance: ¥1.050Te v ¥1.666T prior; Adjusted Current Account Balance: ¥847.2Be v ¥1.043T prior; Trade Balance (BoP Basis): -¥360.1Be v -¥372.4B prior.
- 19:01 (UK) Oct BRC Sales Like-For-Like Y/Y: No est v -0.4% prior.
- 19:30 (AU) Australia Oct Business Confidence: No est v -1 prior; Business Conditions: No est v 17 prior.
- 21:00 (PH) Philippines Q3 GDP Q/Q: +1.5%e v -1.3% prior; Y/Y: 5.0%e v 11.8% prior.
- 22:30 (HK) Hong Kong to sell 3-month Bills.
- 22:30 (JP) Japan to sell 6-Month Bills.
- 22:35 (JP) Japan to sell 30-Year Bonds.
- 23:00 (MY) Malaysia Sept Industrial Production Y/Y: +4.0%e v -0.7% prior; Manufacturing Sales Value Y/Y: No est v 6.8% prior.
- 23:30 (JP) Japan Oct Bankruptcies Y/Y: No est v -10.6% prior.
- 23:30 (TW) Taiwan to sell NT$30B in 20-year Bonds.
EURUSD Buyers’ Efforts May Be In Vain, Bias Negative
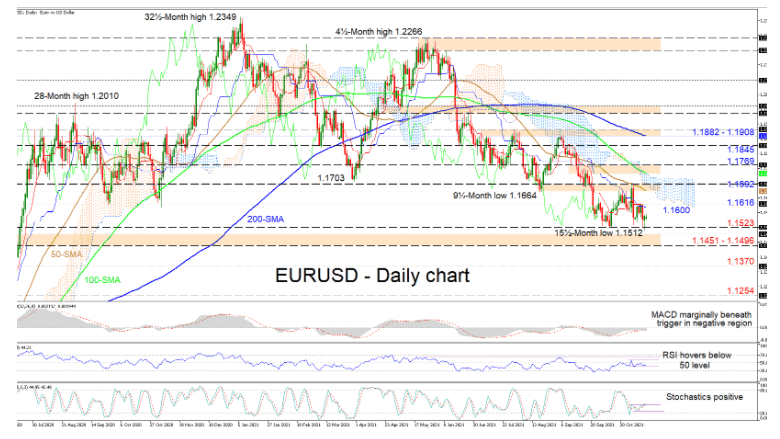
EURUSD buyers have re-emerged again around the previous low of October 12 at 1.1523 and are trying to recoup lost ground. Despite these positive efforts, the pair is maintaining a strong bearish demeanour, something also being reflected in the falling simple moving averages (SMAs).
The Ichimoku lines are demonstrating the price's recent unclear direction but are indicating that positive impetus is somewhat lacking. The short-term oscillators are conveying the recent pick up in positive momentum, but this remains shaky. The MACD, in the negative region, is a tad beneath its red trigger line, while the RSI is hovering in bearish territory. The stochastic oscillator's positive charge appears to be struggling, signalling that upside forces could become overwhelmed.
If buyers retain the reins, initial resistance could commence from the converged Ichimoku lines around 1.1600 and the neighbouring 1.1616 high. Additional advances may then face upside limitations within the region of the 50-day SMA at 1.1665 until the 1.1692 high. Conquering the Ichimoku cloud, which overlaps the previous barrier, the bulls could then test the 1.1734-1.1769 resistance section, the former being the 100-day SMA. Should upside momentum bolster, the price may then test the 1.1845 obstacle before targeting the fortified border of 1.1882-1.1908.
Otherwise, if selling interest increases, downside constraints could evolve from the 1.1523 low and the nearby support barricade of 1.1451-1.1496, which involves the March 2020 high of 1.1496. Should the downward trajectory accelerate, a dive in the price may snag around the 1.1370 low before the focus turns towards the 1.1254 trough.
Summarizing, EURUSD remains negatively skewed in the short- and medium-term timeframe. Nevertheless, the pair is fighting to gain ground and for upside forces to intensify, the price would need to elevate above the 1.1692 high and the cloud.
EURGBP Capped By Its 200-SMA, Bullish Bias Arises
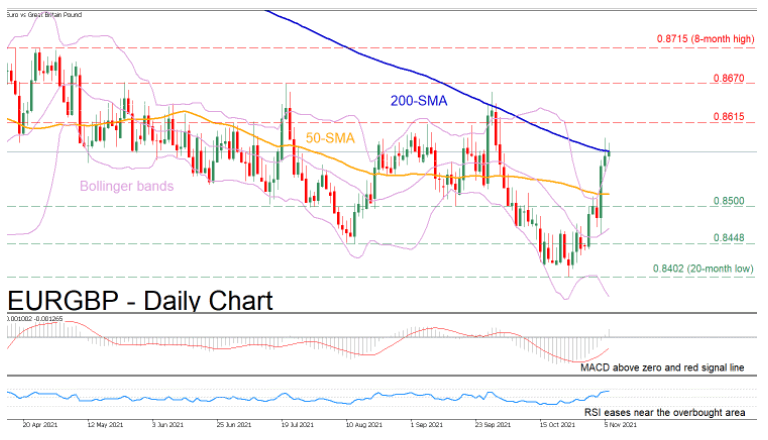
EURGBP has managed to partially rebound after its long-term downtrend halted at the 20-month low of 0.8402. Although the pair has been gaining ground in the short term, it is currently being held down by its 200-day simple moving average (SMA).
The pair’s positive short-term trend is likely to strengthen as the immediate bias looks bullish as well, with the momentum indicators further reinforcing this view. The MACD histogram is above both zero and its red signal line, while the RSI is flatlining near the 70-overbought area.
Should the price continue its ascent, the first resistance barrier might be met at the 0.8615 level. If the bulls manage to push the price even higher, the next obstacle might be the 0.8670 region that rejected price advances both in May and July. Higher up, the next hurdle for buyers could be the eight-month high of 0.8715.
Alternatively, should the selling pressure intensify, the initial hurdle might be found at the 0.8500 psychological mark, which has provided support several times in recent months. If sellers manage to conquer this barricade, then the next challenge could be the 0.8448 level. Failing to find support in the aforementioned level, the bears might target the 20-month low of 0.8402.
Overall, EURGBP has been trending downwards since early May. While the pair has bounced back lately, a clear move above 0.8670 is needed to turn the medium-term picture back to positive.