Sample Category Title
Strong Jobs Report Can’t Lift Dollar, But Equities Shoot Up
- Dollar unable to capitalize on solid US employment report
- But stock markets push higher, powered by decline in yields
- Gold shines as well, focus now turns to litany of Fed speakers
Strong NFP not enough to boost dollar
The US employment report for October was pretty solid. Nonfarm payrolls overcame forecasts, the previous month's number was revised higher, the unemployment rate fell another two ticks to reach 4.6%, and wage growth accelerated. Yet investors were not impressed.
Treasury yields fell in the aftermath, taking the shine off the US dollar as expectations for swift Fed rate hikes were priced out. The market reaction suggests that while the labor market is healing quickly, it is not booming enough to force the FOMC into multiple rate increases next year.
There's also some extrapolating from foreign economies at play. The Bank of England got cold feet last week and didn't raise interest rates, putting investors on alert for a similar disappointment by the Fed when the time comes. It seems central banks will tread cautiously, so anything less than stellar data isn't enough to reawaken rate hike fears.
This playbook will be put to the test on Wednesday when the latest edition of US inflation is released. Inflationary pressures are expected to have intensified further, with the Markit PMIs even hinting at an upside surprise as companies raised their selling prices "at the fastest pace on record". That might be just enough to set off another cascade of worries around faster Fed rate hikes and reignite the dollar's rally.
Wall Street goes wild
Stock markets have gone into overdrive in recent weeks. The S&P 500 closed at yet another record on Friday, drawing fuel from the retreat in Treasury yields. With the economy doing better but not so much that the Fed will slam on the brakes immediately, this is the sweet spot for equity markets.
The issue is that this entire market is starting to resemble one colossal momentum trade, empowered by a whirlwind in the options arena. A cheerful earnings season has seen volume in bullish options go through the roof, with momentum chasing strategies and forced dealer hedging adding fuel to the rally. Tesla and Nvidia are two prime examples.
This is an incredibly unstable dynamic that can work the same 'magic' on the way down if market sentiment turns around. There are still several threats on the radar, from surging inflation forcing the Fed to accelerate normalization, to an earnings slowdown next year accompanied by the introduction of the minimum corporate tax, to credit risks and weaker growth in China.
With markets so overextended, it wouldn't take much to spark a correction.
Sterling struggles, gold shines
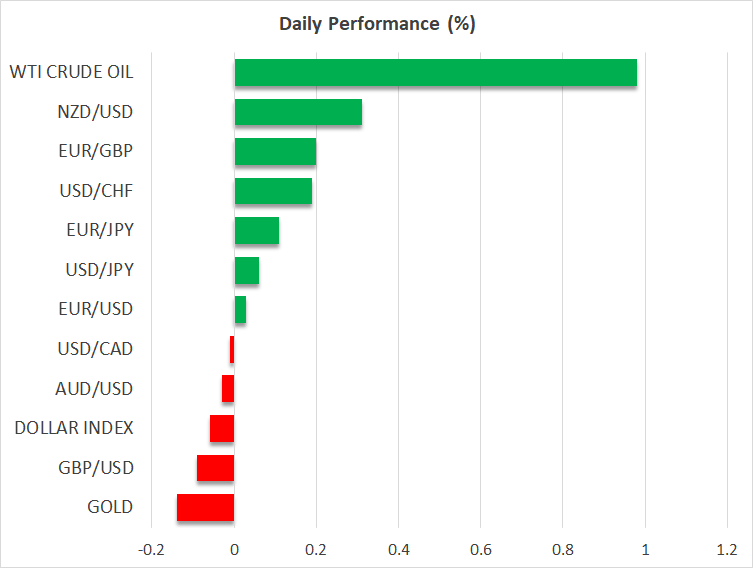
Things have been relatively quiet in the broader FX complex. The British pound and the Japanese have been the only notable movers, with sterling still feeling the blues after the Bank of England's change of heart and the yen capitalizing on the pullback in foreign bond yields.
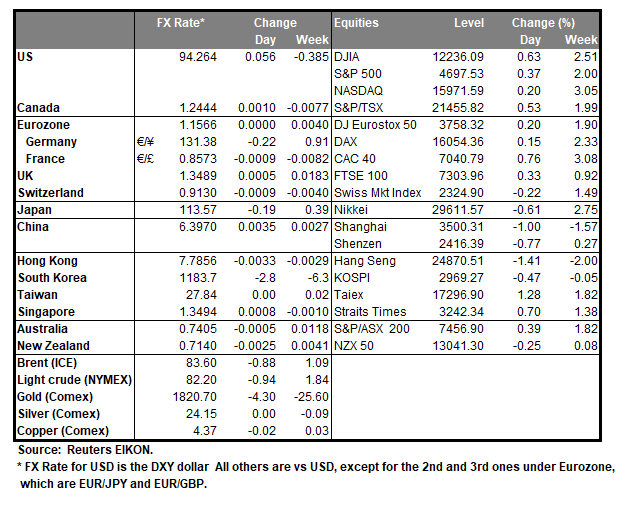
The retreat in yields also breathed life back into gold prices, which hit a two-month high on Friday. Bullion has essentially turned into a trade on how quickly the Fed will pull the rate hike trigger, benefiting every time normalization expectations are pushed back and suffering each time they are brought forward.
Finally, the US Congress passed the infrastructure bill that includes $550 billion in new spending on Friday, although judging by the muted reaction, most of that was priced in already. The focus now turns to a parade of Fed speakers today, including Vice Chairman Clarida at 13:00 and Chairman Powell at 14:30 GMT.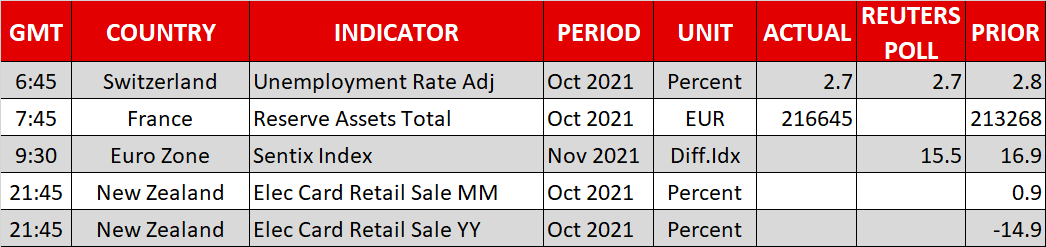
Gold Price Is Now Consolidating Gains From The 1,820 High
Gold price found support near $1,760 and started a fresh increase against the US Dollar. The price was able to surpass the $1,780 and $1,788 resistance levels.
There was a break above the $1,800 level and a close above the 50 hourly simple moving average. The price traded as high as $1,820 and it is now consolidating gains. On the downside, an initial support is near the $1,815 level.
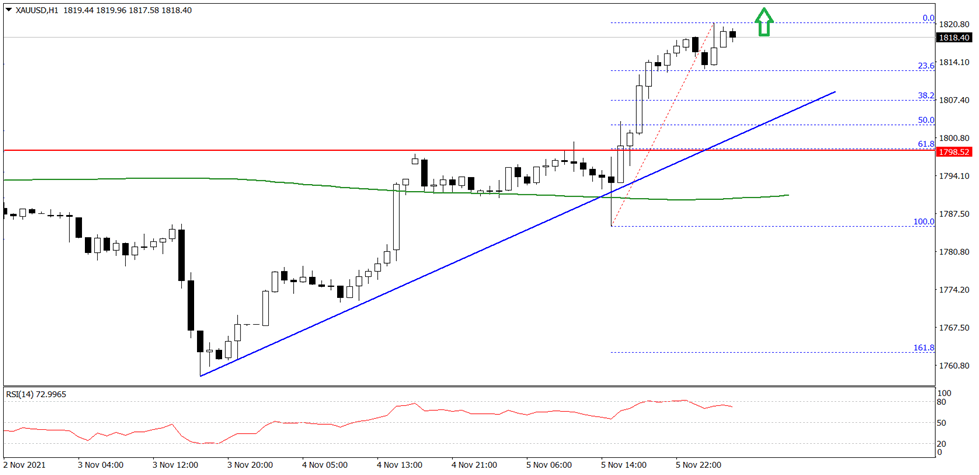
There is also a major bullish trend line forming with support near $1,808 on the hourly chart. The next key support is near the $1,788 level and the 50 hourly simple moving average, below which the price could revisit $1,760 on FXOpen.
On the upside, an immediate resistance is near the $1,820 level. A clear break above the $1,820 resistance could push the price further higher. The next main resistance could be near the $1,845 level.
Asian Equities Mixed
Asian stocks stage North Asia/ASEAN split
On Friday, Wall Street ignored the inflationary noise of the Non-Farm Payrolls, choosing to take the broad-based jump in jobs as a sign of accelerating recovery, and duly sent equity indexes to record-high closes. With momentum clearly with buy-everything on anything FOMO camp, the S&P 500 rose by 0.37%, the Nasdaq rose by 0.20%, and the Dow Jones rose by 0.56%. Pfizer’s oral Covid-19 treatment boosting the S&P 500, while a loosening of US travel restrictions starting today, and the passage of the infrastructure bill, played well with the Dow.
In Asia, however, the picture has not been nearly so clear cut. Saudi Arabia’s decision to raise crude prices in December to Asian customers by another USD 1.40, much higher than the USD 0.50 to USD 1.0 range expected, has not played well with the North Asia heavyweight. Additionally, JP Morgan has cut its China growth forecast once again, Evergrande has not made another payment, and S&P 500 and Nasdaq futures have given back all of Friday’s gains this morning.
That has left Asia in its usual North/South split with Northern heavyweights slipping, while investors have flocked to the more resource-centric ASEAN markets. With S&P 500 futures falling 0.22%, and Nasdaq futures falling 0.40%, Japan’s Nikkei 225 has edged 0.20% lower, with South Korea’s Kospi tumbling by 1.0%, although Taipei has risen slightly by 0.20%.
In China, today’s rise in oil prices also weighs along with the procession of negatives I have outlined above. The Shanghai Composite is unchanged, while the CSI 300 is down 0.20% and Hong Kong by 0.50%. Beware of false dawns this week in China equities. As with the Central Committee in progress, I fully expect China’s “national team” to be “smoothing” any equity negativity by buying any dips in prices.
As usual, these days, a down day in North Asia seems to cause a rotation into ASEAN markets, where heavyweights such as Indonesia and Malaysia have a resource beta. The rise in oil prices has lifted Jakarta by 0.50%, with Kuala Lumpur climbing by 0.20% and Singapore rising by 0.50%. Manila has jumped by 1.05%, with Bangkok up by 0.25%. Australian markets are treading water to start the week, with a robust weekly finish by Wall Street and further reopening measures offset fixed-rate mortgages rise and base metal price falls. The ASX 200 and All Ordinaries are unchanged for the session.
Brexit and Northern Island nerves, and a weak performance by US futures in Asia, are likely to weigh on the UK and European markets this afternoon. However, given Wall Street’s religious zeal-like faith in Jerome Powell’s read my lips, no rate hikes mantra, it is hard to see the negatively seen in Asia, dragging down North American markets.
Five Reasons Why The Bull Market Should Remain Intact
Nothing appears to stop the bullish run in equity markets that took the major US indices to new record highs last week. The S&P 500 added 2%, bringing its year-to-date gains to 25.1%. The robust performance came despite the Federal Reserve's announcement that it will begin normalising policy by winding down its asset purchases by $15 billion a month. The Nasdaq Composite is catching up with the S&P 500 gains and ended last week at a new record at 15,971.
The hefty year-to-date gains may worry some investors, especially in stocks and sectors where valuations look overstretched. Still, with the volatility index trading near 2021 lows, there doesn't seem to be much concern. Unless there is an unpredictable shock, I continue to see further potential for new record highs in the remainder of the year. Here’s five reasons for the bull market to remain intact:
1. The Fed passed the test of tapering without upsetting markets. While inflation is at decade highs, officials continue to believe it's transitory and there is no reason to tighten conditions prematurely. The labour market needs to heal and we're not at full employment yet, hence another reason for rates to remain low through 2022. Overall monetary conditions will remain loose even as the Fed begins to scale back purchases of assets.
2. The US House of Representatives approved President Biden's $1.2 trillion bipartisan infrastructure bill late last week, with $550 billion to be spent on roads, bridges, and other projects. This bill should continue supporting economic growth and increase demand for basic materials.
3. The latest earnings season showed that profits and revenues were still robust despite the economy slowing down in the third quarter. More than 80% of S&P companies reported a positive EPS surprise and 75% surprised on the revenue side. In addition, profit margins stood near record highs in another sign that most corporates could pass higher costs on to consumers.
4. Economic data is finally showing signs of improvement after stalling over the last few months. Unemployment dipped to 4.6% after job creation roared back in October, with non-farm payrolls rising by 531,000, which beat estimates of 450,000. More interestingly, the Supply Management Service index advanced to an all-time high reading of 66.7 from 61.9 in September. This indicates that consumers are highly active and will continue to be the key driver in the final three months of the year.
5. US Treasury yields have tumbled despite robust economic data. The benchmark US Treasury 10-year yield fell to its lowest levels since September below 1.45%. This has taken real yields below -1% and should discourage investors from rotating from stocks to bonds. As long as yields remain depressed, high equity valuations remain justified.
AUD/NZD Continuation Of Downtrend: The Price Is Taking Off As Planned
AUD/NZD technical analysis
- Downtrend continues.
- The retracement is over.
- We should see a move down.
- M L5 Pivot should be the target.
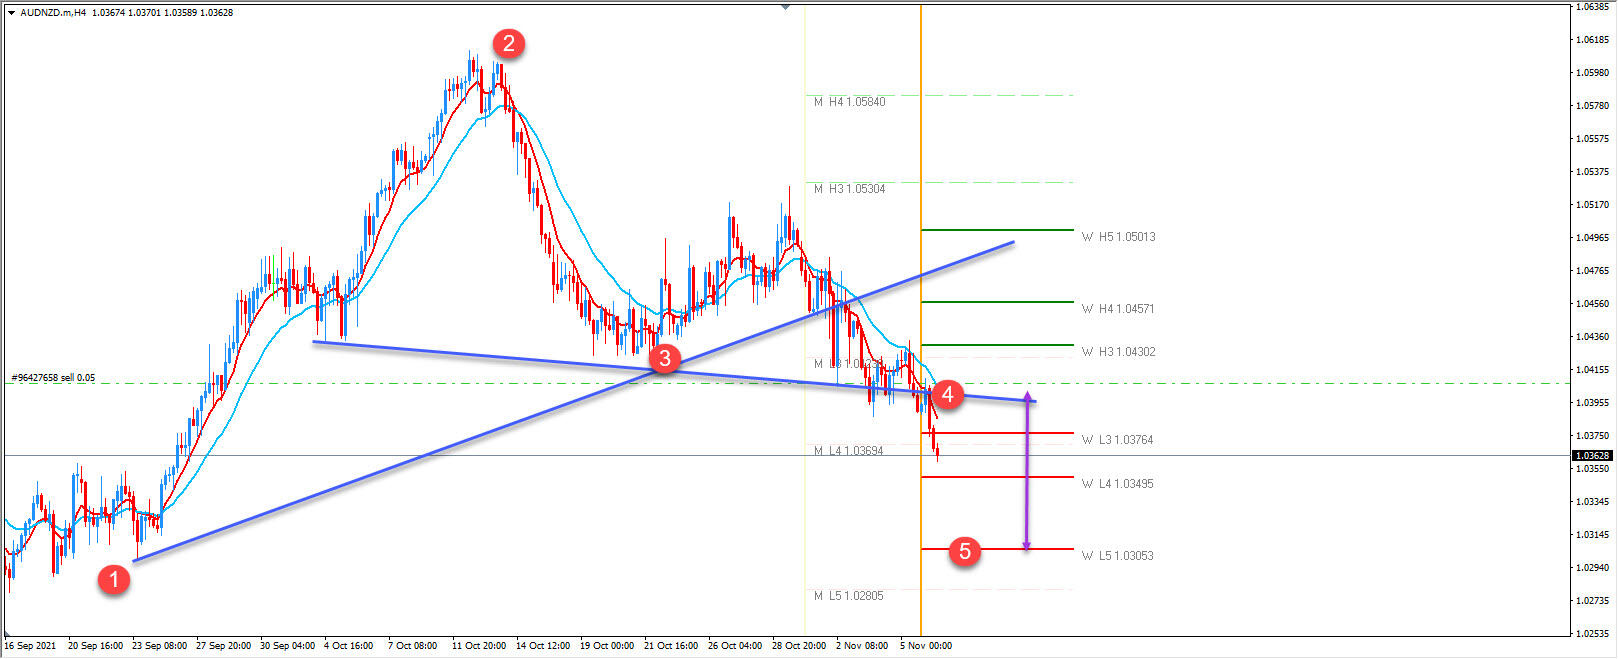
- The swing low.
- Swing High.
- X Cross of the trendline.
- Entry.
- Target.
The price is bearish. After a bigger retracement, the AUD/NZD is making a move to the downside. We should have a continuation of a downtrend. It is clear that sellers are taking over. Bearish RBA stance further ignited bearish momentum. 1.0420 zone is bearish. This is where sellers are. Overnight momentum dropped the price. The main targets are W L4 camarilla - 1.0349 and W L5/ M L5 camarilla pivots 1.0305-1.0280.
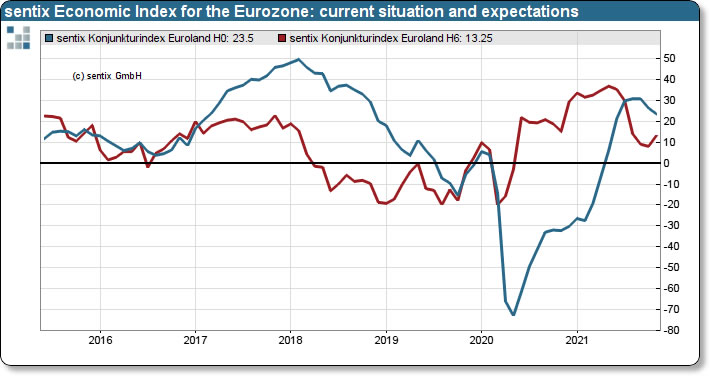
Eurozone Sentix investor confidence rose to 18.3, mid-cycle slowdown coming to an end
Eurozone Sentix Investor Confidence rose to 18.3 in November, up from 16.9, slightly below expectation of 18.6. That also the first rise since July. However, current situation index dropped from 26.3 to 23.5, lowest since June. Expectations, on the other hand, rose from 8.0 to 13.3.
Sentix said, the economic slowdown is "coming to an end". Economic expectations suggested that the latest declines were just a "mid-cycle slowdown". "This thesis seems to be con-firmed by the November data. The threat of an economic turnaround is thus off the table."
EUR/USD Outlook: Bears Continue To Face Strong Headwinds From 1.15 Support Zone
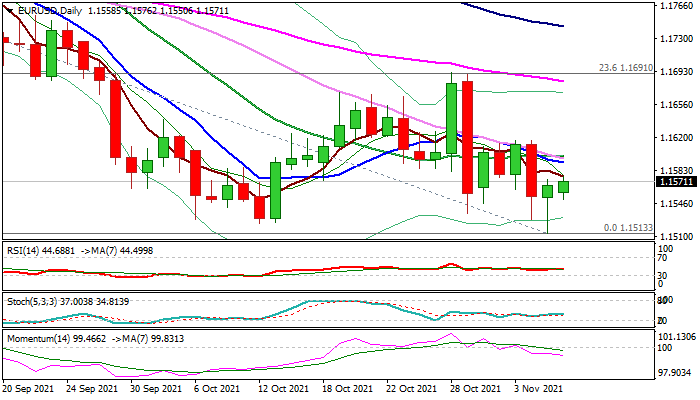
The Euro stands at the front foot in early Monday, following strong downside rejection on Friday that left a hammer candle, generating an initial reversal signal.
Multiple downside rejections on approach to pivotal Fibo support at 1.1492 (50% retracement of 1.0635/1.2349 rally) in past four weeks and also failures to clearly break below 200WMA (1.1565), suggest that larger bears face strong headwinds at this zone.
Bearish studies on daily and weekly charts suggest prolonged consolidation before bears resume, with a clear break of 1.1492 support to spark fresh acceleration lower.
Four-week consolidation top (1.1692) is also broken Fibo 38.2% of 1.0635/1.2349 and Fibo 23.6% of 1.2266/1.1513 bear-leg, marking strong resistance which is expected to cap and bears in play. Only break here would put bears on hold for a stronger correction.
Res: 1.1592, 1.1616, 1.1665, 1.1692.
Sup: 1.1550, 1.1525, 1.1513, 1.1492.
USD Drops On Lower Yields
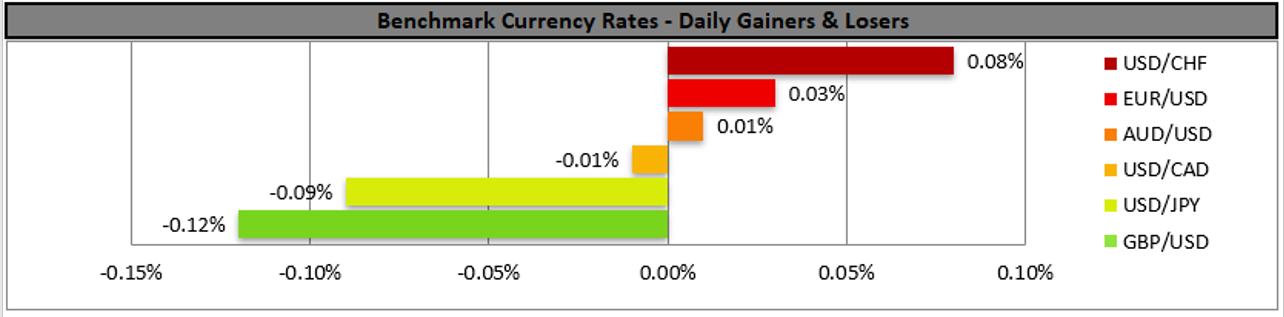
The USD despite getting some support from the solid employment data for October released on Friday, ultimately ended the day lower than what it began against a number of its counterparts as US yields dived to lower grounds. The next big bet for the markets after the release of the US employment data for October seems to be the release of the US CPI rates for October on Wednesday, while six Fed officials are scheduled to speak today, and we place some attention more on Fed Vice Chair Clarida. On the contrary the US stockmarkets gained on Friday, with Dow Jones, S&P 500 and Nasdaq reaching new record highs expressing the positive, risk on sentiment of the markets. Over the weekend, we note that Elan Musk’s tweet on whether he should sell 10% of his stake in Tesla was answered by a majority positively and that could have an adverse effect on the share’s price. Remaining on the equities front, Pfizer’s share price soared on Friday as it’s Covid pill study produced strong results, while competitors Merck’s and Moderna’s share prices dropped considerably. As for precious metals Gold’s price gained on the back of a weaker USD as well as dropping US yields. On the commodities front, oil prices were on the rise as expectations for strong demand remained elevated, especially after Saudi Aramco, raised its Asia prices for its light crude, while supply is expected to remain tight. The Looney on the other managed to remain steady against the USD as despite a lower-than-expected employment change figure for October the unemployment rate still ticked down in the Canadian October employment data, while higher oil prices tended to provide some support as well. On the other hand, the Aussie also remained stable despite China’s Trade surplus boom as imports seem to slow down.
The USD Index dropped on Friday and maintained low volatility during today’s Asian session. We tend to maintain a bias for a sideways motion for the index currently between the 94.10 (S1) and the 94.60 (R1) level. Should a buying interest be expressed for the index we may see it breaking the 94.60 (R1) level and aim for the 95.10 (R2) resistance line. Should the market decide to sell the Dollar, we may see the index breaking the 94.10 (S1) support line and aim for the 93.70 (S2) level.
Gold’s price continued to rise on Friday breaking the 1808 (S1) resistance line, now turned to support. We tend to maintain a bullish outlook for the precious metal’s prices as long as it remains above the upward trendline incepted since the 3rd of November. Should the bulls actually maintain control over gold, we may see its price breaking the 1831 (R1) resistance line and take aim of the 1851 (R2) level. Should the bears take over we may see gold’s prices breaking the 1808 (S1) support line and aim for the 1786 (S2) level.
Today’s events and expectations
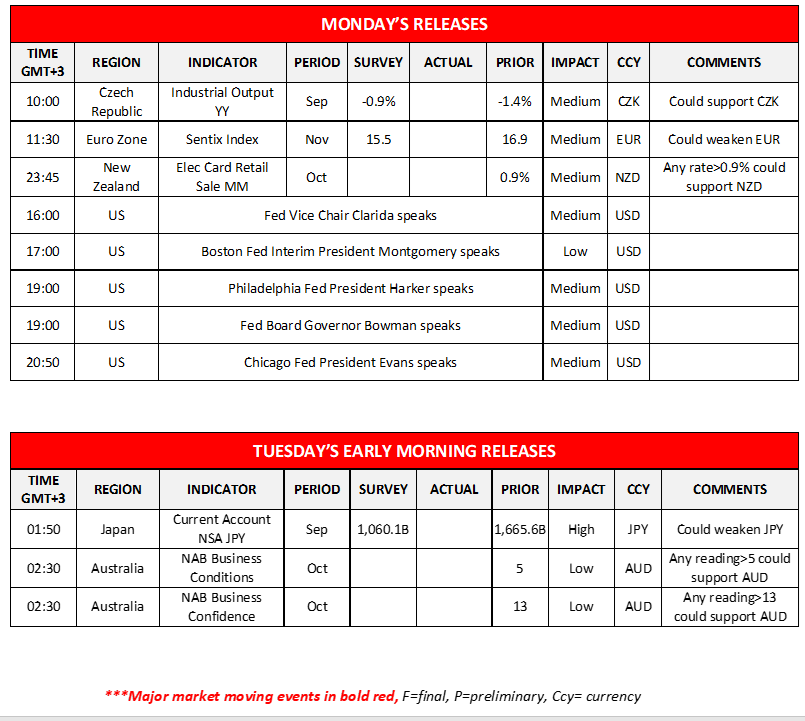
Today we get from the Eurozone the Sentix index for November and just before the Asian session New Zealand’s electronic card sales for October. During Tuesday’s Asian session, we get Japan’s current account balance for September and from Australia NAB’s October Business Conditions and Business Confidence.
As for the rest of the week
On Tuesday we get from Japan the current account balance for September and Germany’s ZEW indicators for November. On Wednesday we note the release of Inflation measures from China, Germany, Norway, the Czech Republic, and most importantly from the US, all being for the month of October as well as the US weekly initial jobless claims figure. On Thursday we get Japan’s Corporate Goods Prices for October, Australia’s employment data or October as well as UK’s GDP rates for September and Q3 and Manufacturing output for September. On Friday, we get Norway’s GDP rate for Q3, Eurozone’s industrial production for September and the preliminary US University of Michigan consumer sentiment reading for November.
USD Index H4 Chart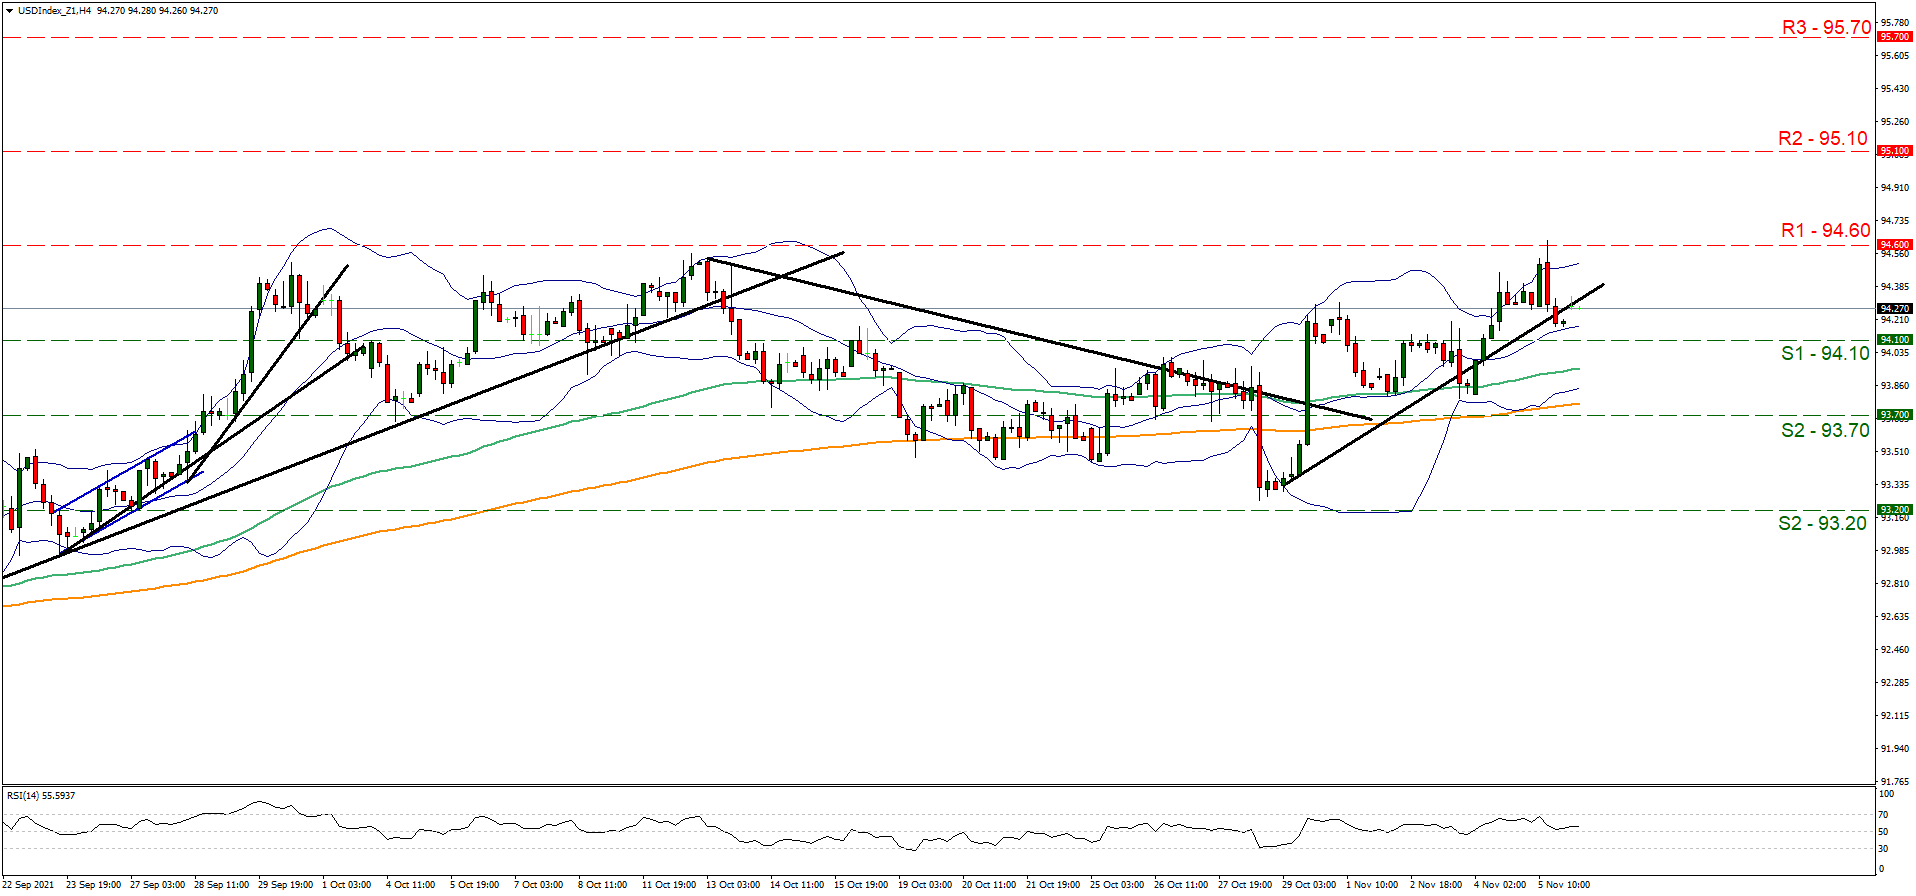
Support: 94.10 (S1), 93.70 (S2), 93.20 (S3)
Resistance: 94.60 (R1), 95.10 (R2), 95.70 (R3)
XAU/USD H4 Chart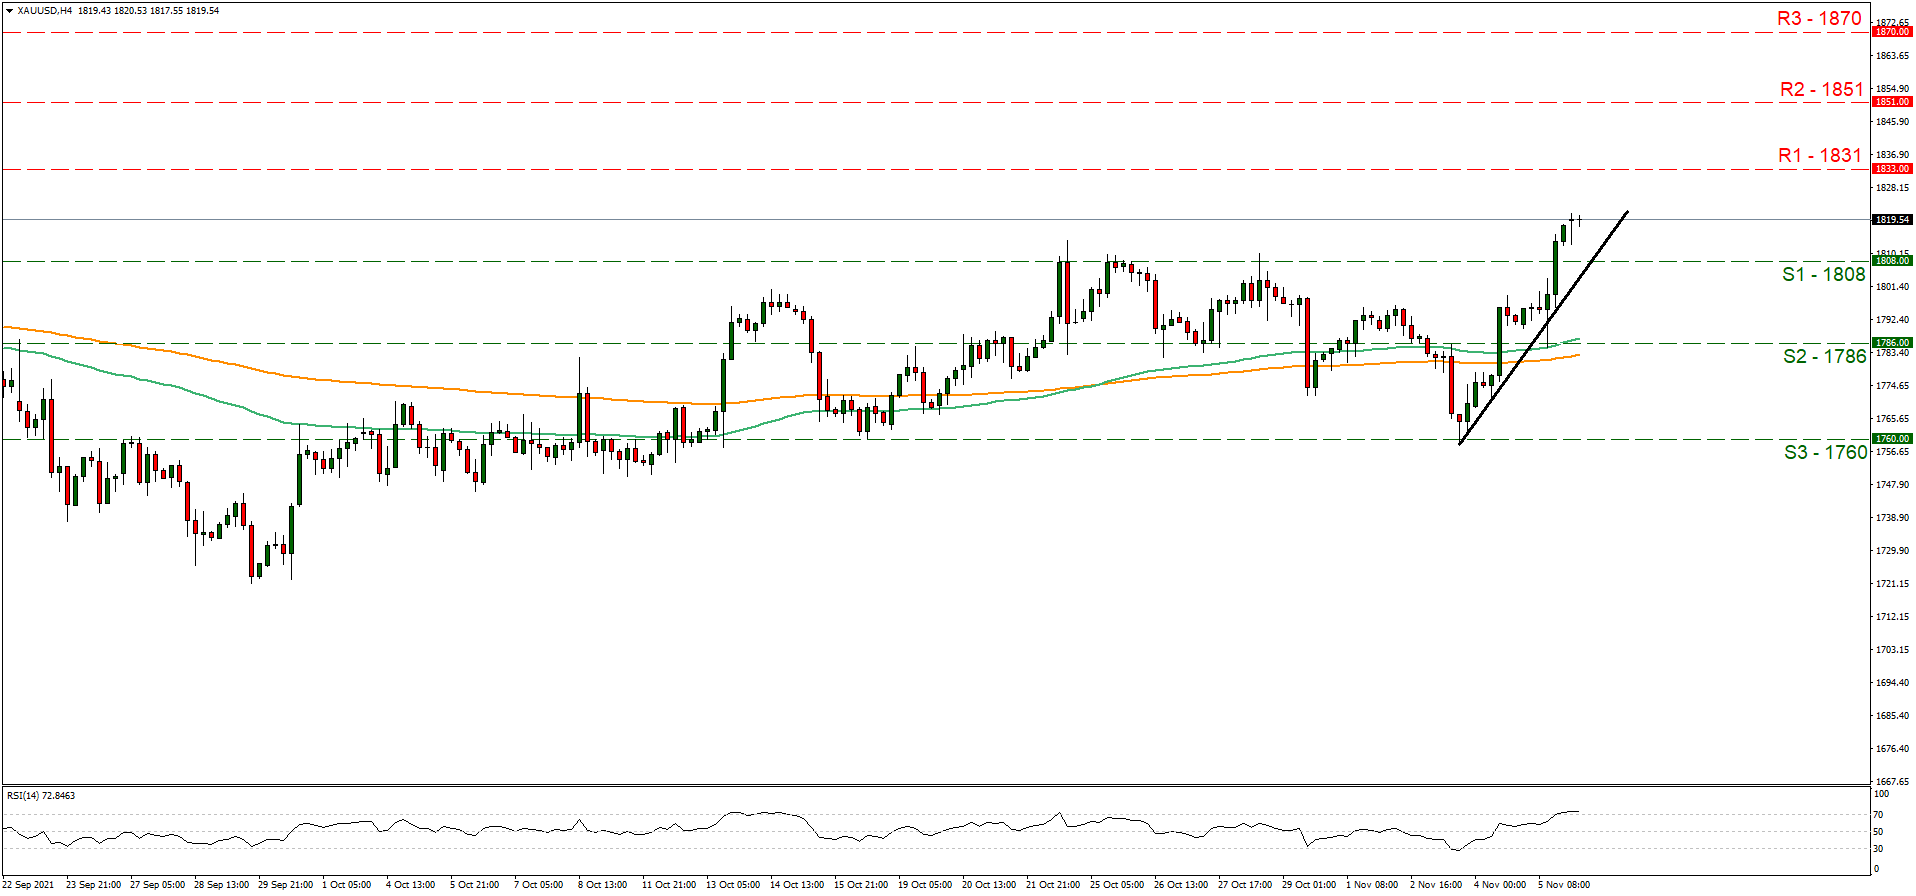
Support: 1808 (S1), 1786 (S2), 1760 (S3)
Resistance: 1831 (R1), 1851 (R2), 1870 (R3)
Gold Eyes Crucial Breakpoint After Fast Rally
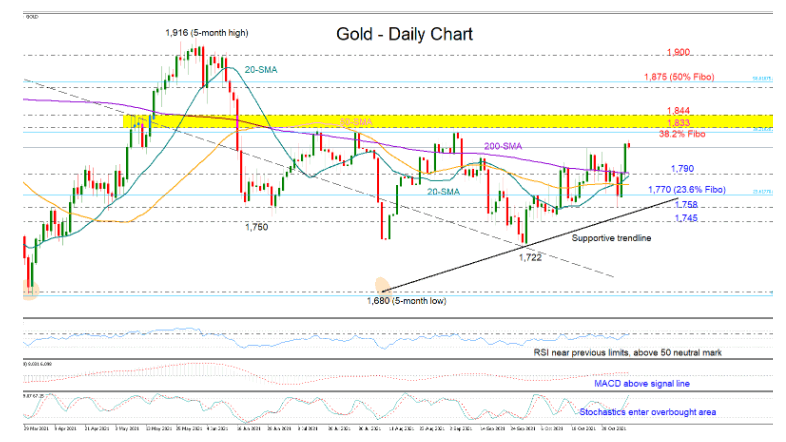
Gold ticked to a fresh 2-month high of 1,821 on Monday following the speedy recovery during the past two trading days, which boosted the price by a whopping 2.7% but it was still not enough to reach the crucial resistance of 1.833. Note this is where the 38.2% Fibonacci retracement of the 2,079 – 1,676 downfall is also positioned.
The momentum indicators keep feeding some optimism that the latest rally could gain extra legs in the coming sessions. Despite testing its previous limits, the RSI remains elevated above its 50 neutral mark, the MACD is positively charged above its red signal line, and the Stochastics are just entering the overbought territory, all keeping the short-term bias skewed to the upside.
Should the wall around 1,833 collapse, the bulls may face immediate suspension near the 1,845 barrier last seen in the middle of the year. A clear move above the latter could attract significant buying interest, with the price likely advancing up to 1,870, though long-term traders may not participate until the 1,900 – 1,916 ceiling cracks.
If sellers come into play, the 20- and 200-day simple moving averages (SMAs) may eliminate downside pressures around 1,790. The 23.6% Fibonacci of 1,770 proved a hard obstacle last week. Hence, any close below it could confirm additional losses, probably until the supportive trendline currently seen near the swing low of 1,758. Lower, some consolidation could develop near 1,754 before all eyes turn to September’s bottom line at 1,722.
Summarizing, gold is expected to push for more gains in the short-term, though whether it will clearly exit its three-month-old range area above 1,833 remains to be seen.
USDJPY Trades Parallel With SMAs, Neutral Bias In Short-Term
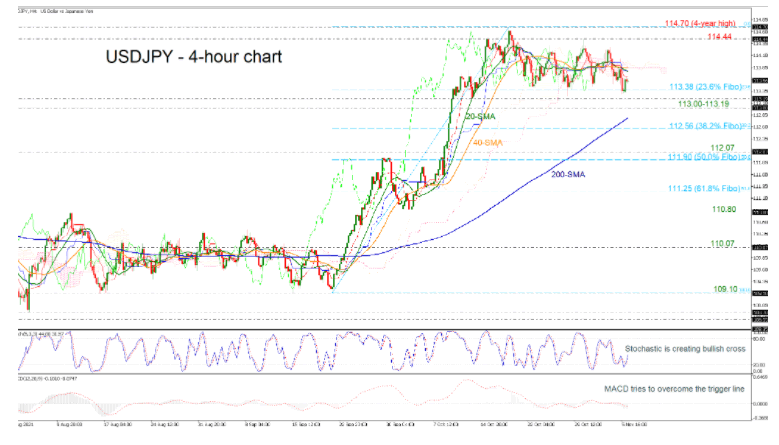
USDJPY has been in a sideways move after peaking at a fresh four-year high of 114.70 on October 20.
The 20- and 40-period simple moving averages (SMAs) and the Ichimoku cloud are confirming the recent neutral bias. However, the stochastic is creating a bullish crossover within the %K and %D lines in the oversold zone, while the MACD oscillator is in the process to surpass its trigger line in the negative region. Both are suggesting that the next move may be to the upside rather to the downside.
In case that the price overcomes the short-term SMAs, the bulls could test the 114.44 resistance ahead of the four-year peak of 114.70.
On the other side, the price could hit the 23.6% Fibonacci retracement level of the up leg from 109.10 to 114.70 at 113.38 ahead of the immediate support area of 113.00-113.19. More downside moves could take the market until the 200-period SMA at 112.80 before touching the 38.2% Fibonacci of 112.56.
To sum up, USDJPY is neutral in the short-term and only a jump above the 114.70 key level may switch the outlook back to a bullish one.