Sample Category Title
GBP/JPY Daily Outlook
Daily Pivots: (S1) 151.79; (P) 152.04; (R1) 152.30; More...
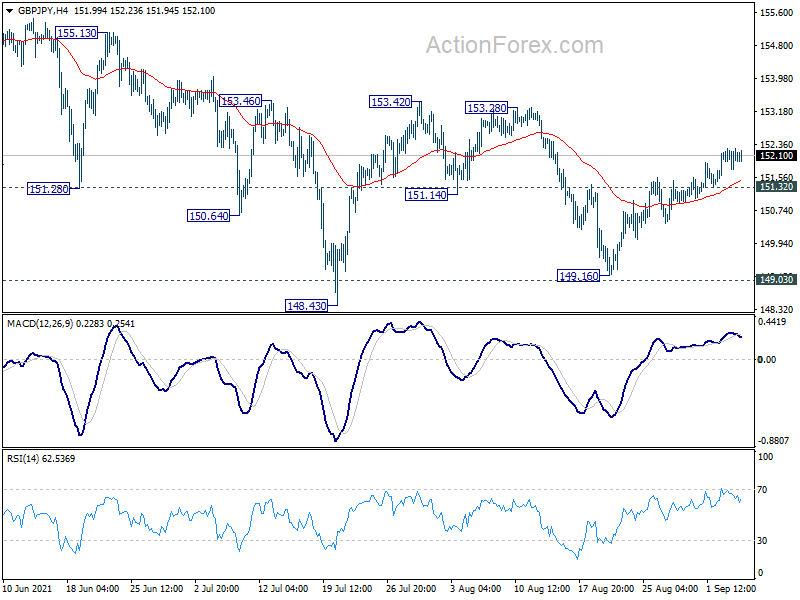
With 151.32 minor support intact, intraday bias in GBP/JPY stays mildly on the upside for 153.42 resistance first. Decisive break there will argue that whole corrective pattern from 156.05 has completed, and bring retest of this high. On the downside, however, break of 151.32 minor support will turn bias back to the downside for 149.16 support instead.
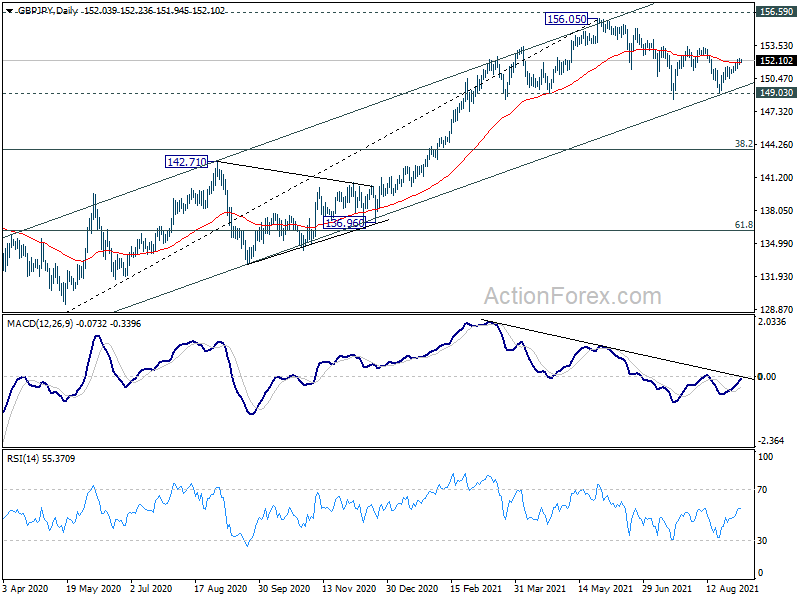
In the bigger picture, rise from 123.94 is seen as the third leg of the pattern from 122.75 (2016 low). As long as 149.03 support holds, such rise would still resume at a later stage. However, sustained break of 149.03 support will indicate rejection by 156.59. Fall from 156.05 would be at least correcting the whole rise from 123.94. Deeper fall would be seen back 38.2% retracement of 123.94 to 156.05 at 143.78 first.
EUR/JPY Daily Outlook
Daily Pivots: (S1) 130.08; (P) 130.41; (R1) 130.64; More....
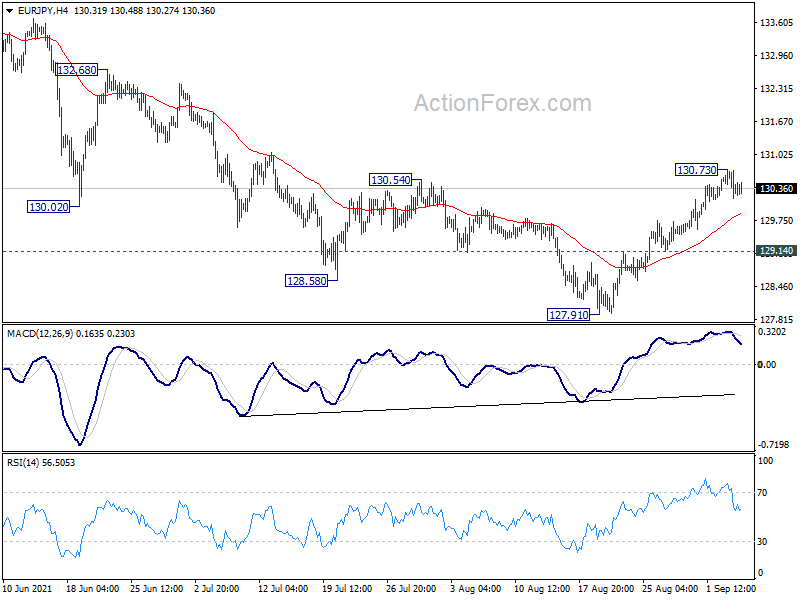
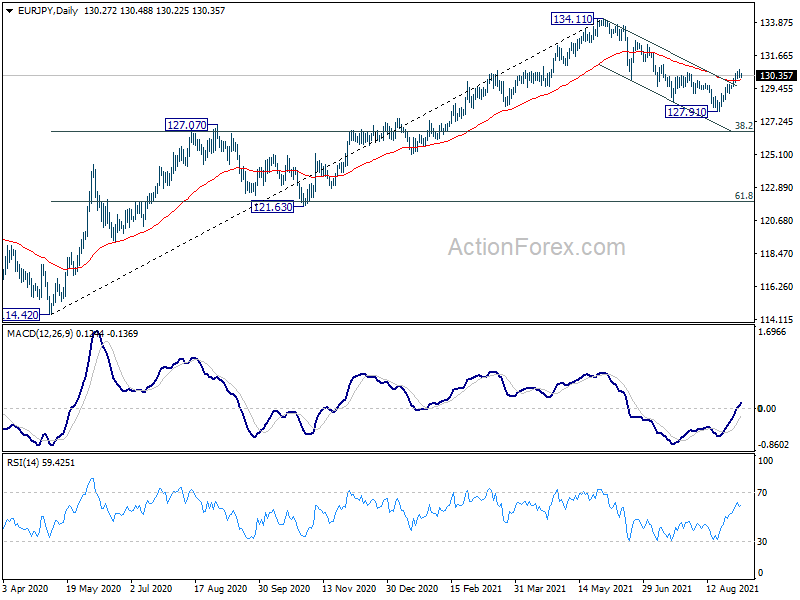
Intraday bias in EUR/JPY remains neutral for some consolidations, but further rise is expected with 129.14 minor support intact. Corrective fall from 134.11 could have completed at 127.91 already. On the upside, break of 130.73 will resume the rebound from 127.91 to 132.68 resistance next. However, break of 129.14 will dampen this bullish view and bring retest of 127.91 low instead.
In the bigger picture, rise from 114.42 is seen as a medium term rising leg inside a long term sideway pattern. As long as 127.07 resistance turned support holds, further rise is still expected to retest 137.49 (2018 high). However, firm break of 127.07 will argue that the medium term trend has reversed, deeper fall would be seen to 61.8% retracement of 114.42 to 134.11 at 121.94.
EUR/GBP Daily Outlook
Daily Pivots: (S1) 0.8557; (P) 0.8576; (R1) 0.8590; More...
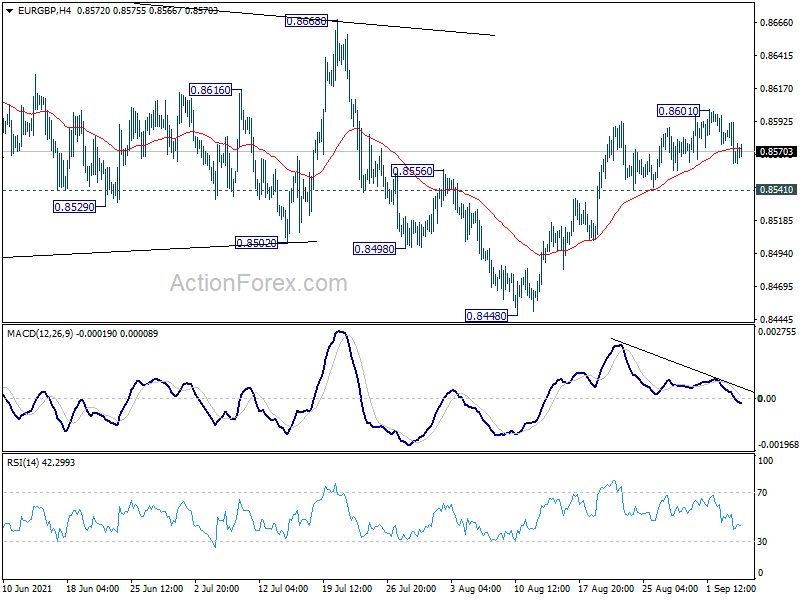
Intraday bias in EUR/GBP remains neutral first and another rise is in favor with 0.8541 minor support intact. On the upside, above 0.8601 will resume the rebound from 0.8558 to 0.8668 resistance. Firm break there will be a strong sign of near term bullish reversal at least. On the downside, however, break of 0.8541 support will turn bias back to the downside for retesting 0.8448 low instead.
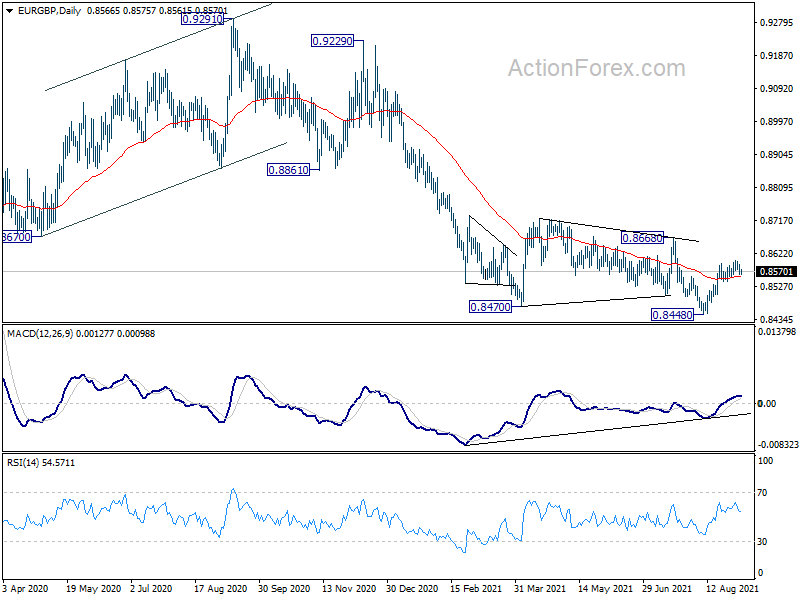
In the bigger picture, price actions from 0.9499 (2020 high) are still seen as developing into a corrective pattern. Deeper fall could be seen as long as 0.8668 resistance holds, towards long term support at 0.8276. However, firm break of 0.8668 resistance would argue that a medium term bottom was already formed. Stronger rise would be seen to 0.8861 support turned resistance to confirm completion of the corrective pattern.
USD/CAD Decline Could Continue
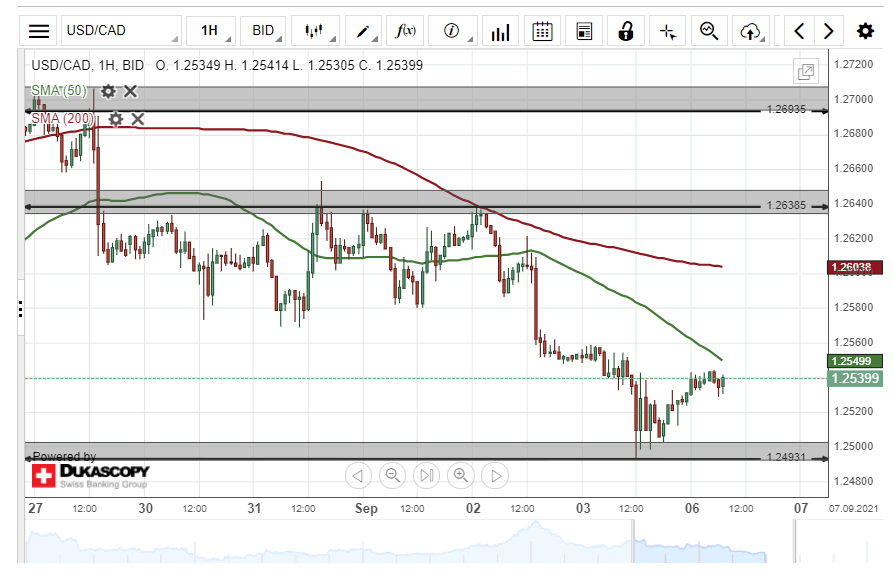
On Friday, the US Dollar declined by 56 pips or 0.45% against the Canadian Dollar. The USD/CAD currency pair tested the 1.2500 level support during Friday's trading session.
Given that the 50– and 200– hour SMAs are above the price level, bearish traders are likely to continue to drive the exchange rate lower during the following trading session.
However, sellers could still encounter support near the 1.2500 level within Monday's trading session
EUR/AUD Daily Outlook
Daily Pivots: (S1) 1.5891; (P) 1.5977; (R1) 1.6030; More...
Intraday bias in EUR/AUD remains on the downside for 1.5898 support first. Sustained break there will indicate that corrective rise from 1.5250 has already completed. Near term outlook will be turned bearish for retesting 1.5250 low. On the upside, break of 1.6116 resistance will revive near term bullishness and bring retest of 1.6434 high instead.
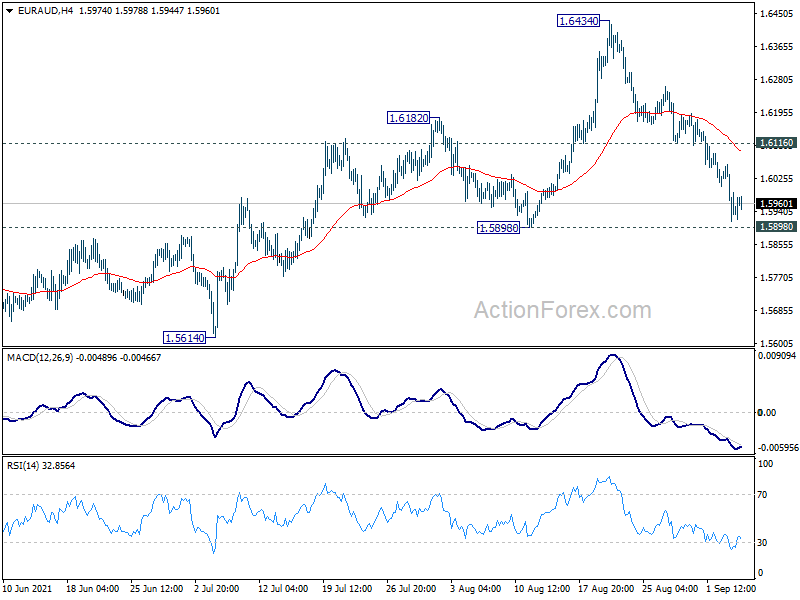
In the bigger picture, rise from 1.5250 medium term bottom is currently seen as a correction to the down trend from 1.9799 first. Stronger rise could be seen to 38.2% retracement of 1.9799 to 1.5250 at 1.6988 next. We'd tentatively expect strong resistance from there to limit upside, at least on first attempt. Meanwhile, break of 1.5898 support will indicate that the rebound has completed. Larger down trend from 1.9799 might be ready to resume through 1.5250 low.
GBP/JPY Two Scenarios Likley
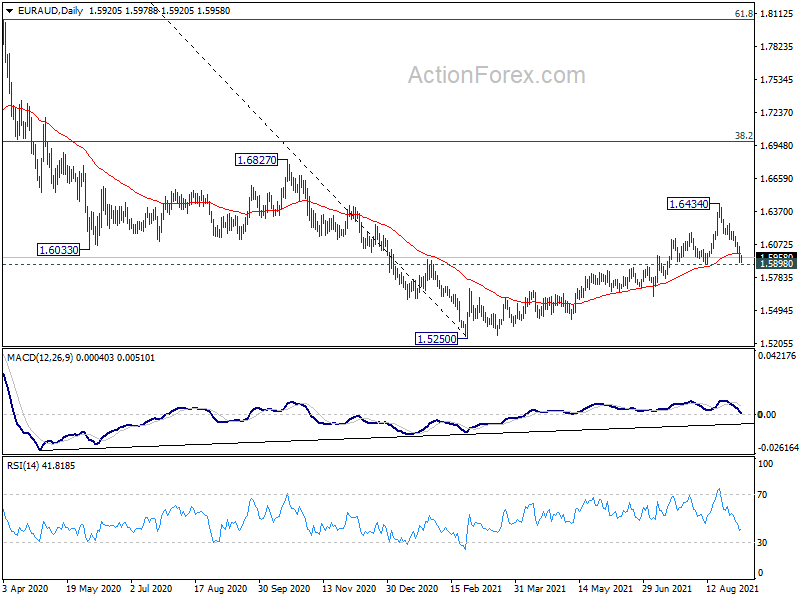
On Friday, the British Pound edged higher by 42 pips or 0.28% against the Japanese Yen. The decline was stopped by the 50– hour simple moving average during Friday's trading session.
Currently, the exchange rate is trading near the lower boundary of an ascending channel pattern and could be set for a breakout.
If the breakout occurs, a decline towards a support level formed by the 200– hour SMA at 151.36 within this session.
However, if the channel pattern holds, the currency exchange rate may continue to edge higher in an ascending channel pattern today.
AUD/USD Bulls Likely To Prevail
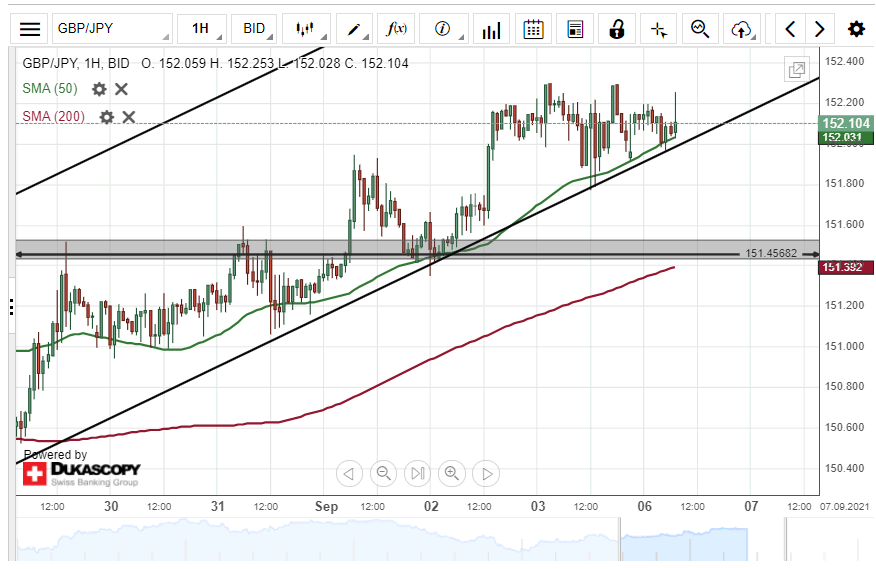
On Friday, the Australian Dollar edged higher by 62 pips or 0.84% against the US Dollar. The currency pair tested the upper line of an ascending channel pattern at 0.7464 during Friday's trading session.
Everything being equal, the AUD/USD exchange rate is likely to continue to trend bullish during the following trading session. The potential target for bulls would be near the 0.7520 level.
However, the upper boundary of the channel pattern could provide resistance for the currency exchange rate within this session.
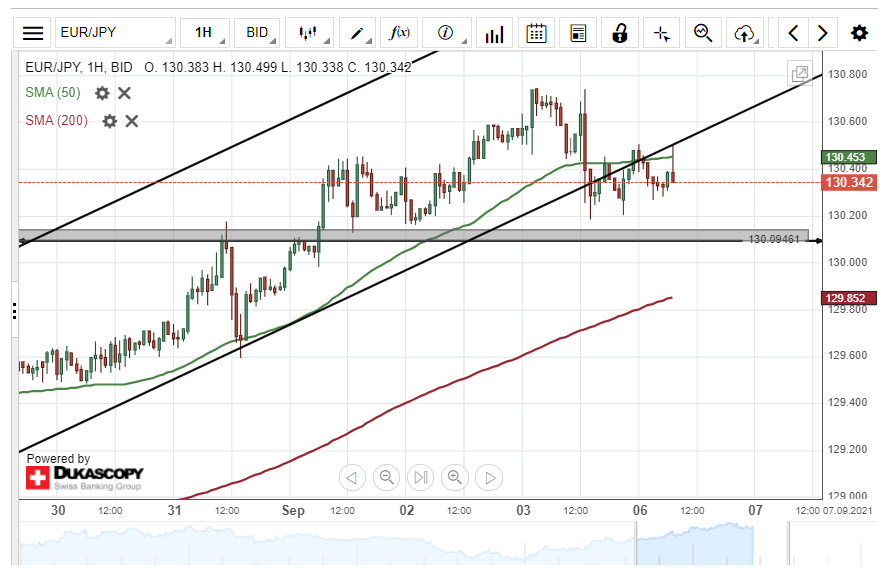
EUR/JPY Breached Channel Pattern
During Friday's trading session, the common European currency declined by 50 pips or 0.38% against the Japanese Yen. The currency pair breached the lower boundary of an ascending channel pattern on Friday.
All things being equal, the exchange rate could continue to edge lower during the following trading session. The potential target for sellers would be near the 129.83 level.
However, the EUR/JPY currency exchange rate could encounter support at 130.09 within this session.
EUR/CHF Daily Outlook
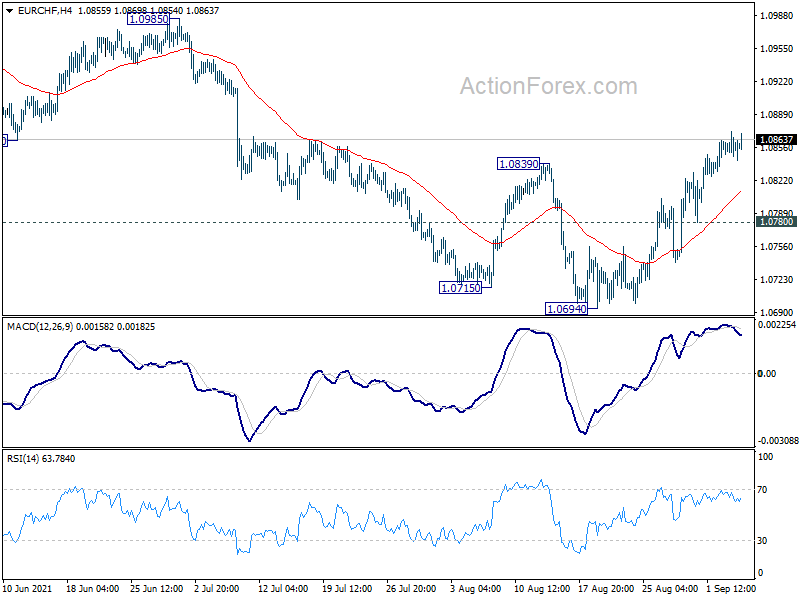
Daily Pivots: (S1) 1.0845; (P) 1.0859; (R1) 1.0870; More....
Intraday bias in EUR/CHF remains mildly on the upside as rise from 1.0694 is still in progress. Current development suggests that fall from 1.1149 has completed already. Further rally is expected to 1.0985 resistance next. However, on the downside, break of 1.0780 will turn bias back to the downside for retesting 1.0694 low instead.
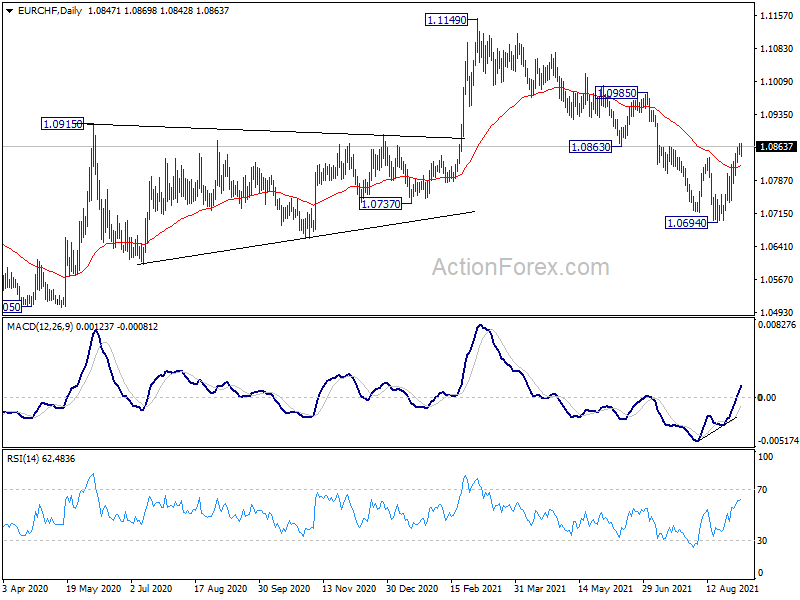
In the bigger picture, rebound from 1.0505 (2020 low) should have completed at 1.1149 already. The three-wave corrective structure argues that the downtrend from 1.2004 (2018 high) is not over yet. Medium term outlook will now stay bearish as long as 55 week EMA (now at 1.0859) holds. Break of 1.0505 low would be seen at a later stage. However, sustained trading above 55 week EMA will bring retest of 1.1149 high instead.
NASDAQ 100 And S&P 500 Holds Steady As Global Dealmaking Accelerates
The US dollar index sell-off continued Monday morning as investors reflected on the latest American jobs numbers. The data, published on Friday, showed that the American economy added more than 235k jobs in August, which was a dramatic decline from the previous month’s increase of more than 1 million. It was not all that bad as the unemployment rate declined to 5.2%, which was the lowest level since the pandemic started. Also, the participation rate remained steady at 61.7% while wages rose by 4.3%. Additional data by the Institute of Supply Management (ISM) showed that the country’s non-manufacturing PMI rose to 61.7 in August.
The financial market will be relatively muted today since the US will be on holiday. Still, investors will be looking at the ongoing deliberations on Joe Biden’s $3.5 trillion anti-poverty plan. Some of Biden’s advisors have recommended shelving the plan, citing the potential rise in inflation. In a piece in the Wall Street Journal last week, Senator Joe Manchin asked Biden to take a strategic pause on the plan. He argued that the pause was necessary since the country has already absorbed more than $5 trillion of aid in the past few months.
US and some European stocks remain close to an all-time high as sentiment in the market improves. The ongoing wave of corporate consolidation has also helped boost sentiment. An analysis by the Financial Times found that deals worth more than $4 trillion have been passed this year. $500 billion of these transactions happened in August, which is usually a relatively quiet month. Deals worth more than $289 billion were passed in the same month in 2020. Some of the key deals announced this year have been GE’s disposal of AerCap and Salesforce acquisition of Slack.
NDX100
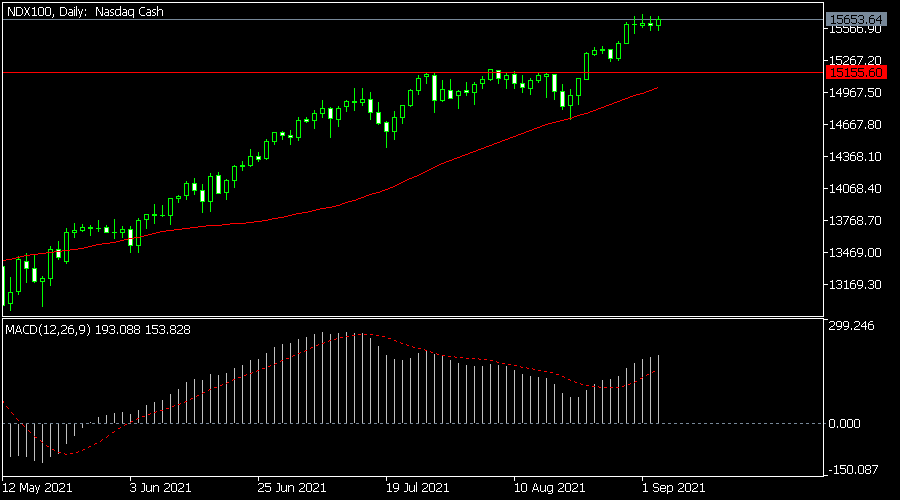
The Nasdaq 100 index has been in a strong bullish trend in the past few weeks. It is trading at an all-time high of $15,653. On the daily chart, the index is being supported by the 25-day and 50-day moving averages. It has also managed to move above the key level at $15,155, which was the highest level in August. At the same time, the MACD and the Relative Strength Index (RSI) has been rising. Therefore, the index will likely keep rising as bulls target the key resistance level at $16,000.
EURUSD
The EURUSD declined slightly after strong US non-manufacturing PMI data helped to offset the mixed jobs numbers. The pair is trading at 1.1878, which is slightly below last week’s high at 1.1904. On the four-hour chart, the pair has moved back to the previously ascending channel pattern. It is also slightly above the 25-day moving average. Therefore, the pair may resume the upward trend ahead of the ECB decision.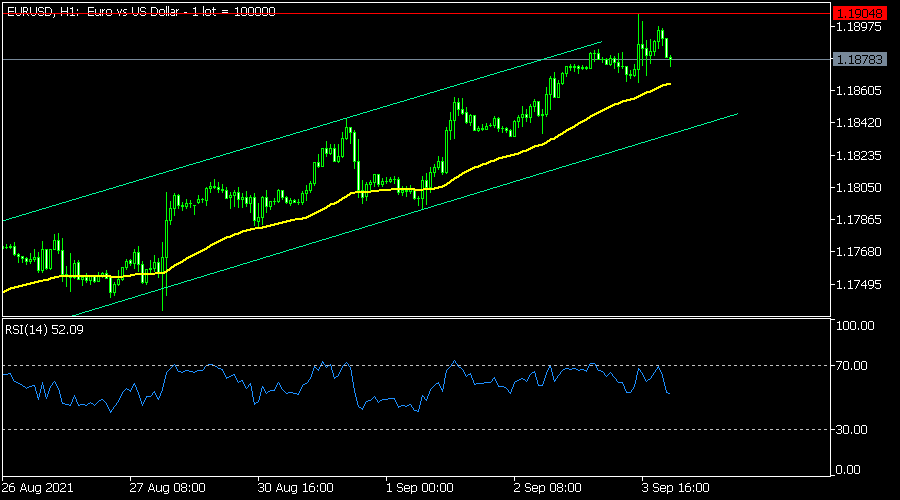
GBPUSD
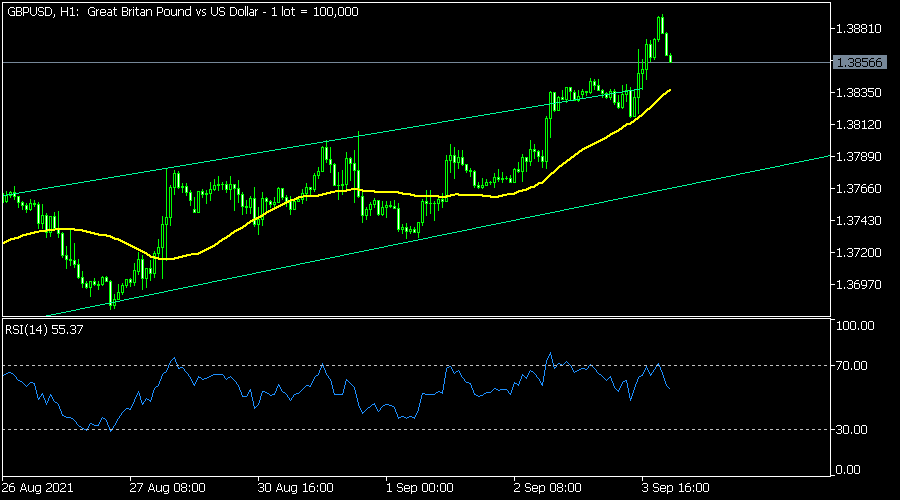
The GBPUSD pair broke out higher on Friday after the NFP data. It rose to a high of 1.3890, the highest level since mid-August. The pair then pulled back and is currently slightly above the upper side of the ascending channel. It is also being supported by the 25-day moving average while the MACD has moved slightly below the overbought level. Therefore, the pair will likely move lower as the break and retest pattern forms.