Sample Category Title
August US Payrolls to Delay, Not Stop, the FOMC’s Taper Decision
December is now seen as the most likely decision point, with the taper program still to run January to June 2022. A December 2022 first rate hike also remains likely, assuming Delta risks abate.
In his recent Jackson Hole Symposium speech, Chair Powell noted that at “the FOMC's recent July meeting, I was of the view, as were most participants, that if the economy evolved broadly as anticipated, it could be appropriate to start reducing the pace of asset purchases this year”.
In the same paragraph however, he also emphasised a need to monitor “the further spread of the Delta variant”. This latter point has proved prescient given the severity of the third wave of COVID-19 now being experienced by the US and, of course, August’s nonfarm payrolls.
At less than one third of the average of the prior three months, August’s 235k increase was a shocking outcome, particularly as these jobs would have been finalised in mid/late-July when new delta cases were but a fraction of the current level. There were some odd outcomes by industry such as leisure and hospitality stalling after increasing 350k per month for the past six, but no definitive reason to believe August’s print should be dismissed as a statistical aberration.
The questions that need to be asked at this point are: (1) did August’s payroll outcome come about because of changing demand or lingering supply constraints; and (2) how far off course does it put the economy in pursuit of full employment, a pre-requisite for rate hikes.
Given job openings are at historic highs and other indicators of labour demand remain strong, the August nonfarm payrolls surprise looks to stem from supply constraints. This assertion is backed up by the participation rate remaining unchanged for the past four months, 1.7ppts below its pre-pandemic level. If we assume, as the world is, that this surge in US Delta cases will be brought back under control soon, the uncertainty presently impeding job matches should abate in coming months.
This one outcome is enough to preclude a September taper announcement. But, unless it proves the first of a string of weak outcomes, a taper decision at the December meeting will be made, allowing the process to still run to our existing forecasted timetable of January to June 2022.
Employment growth does not have to bounce back to near a million a month for this to occur. Ahead of the August print, we had anticipated a material weakening in job creation from September, with gains from that point to end-2022 forecast to average 450k – a little over half the pace of May to July, and only 80k more than August’s print if prior month revisions are incorporated.
Importantly, job creation of this scale would not only be strong enough to eradicate the remaining pandemic employment deficit of 5.3 million by September next year, but would also, come December 2022, see the creation of a quarter of the jobs that could have been established absent the pandemic, based on the pace of employment growth in the 12 months immediately prior to the pandemic.
Not only can we therefore still justify a first-half 2022 taper timeline, but also a first rate hike in December 2022. This, of course, assumes the current wave of COVID-19 in the US does not get any worse, which is why the FOMC now need to wait until December to make their decision.
However, it is important to emphasise here that August’s weakness was due to supply rather than demand. If average monthly employment growth instead slows materially below 450k into year-end due to a marked weakening in demand, the FOMC will find it difficult to forecast full employment by end-2022. Knowing well from their GFC experience the challenges a protracted recovery poses for an economy and its policy makers, this is not a situation the Committee will want to risk. Hence, if such downside risks crystalise, a taper decision is likely to be further delayed and its pace slowed while rate hikes would be pushed out into 2023.
Eco Data 9/6/21
[php_everywhere instance="1"]
Forex and Cryptocurrency Forecast
EUR/USD: Falling Dollar and Rising Risk Appetite
The majority is not always right. Thus, only 30% of the experts voted for EUR/USD to grow to 1.1900 last week. But they were the ones who proved right. After the release of data from the US labour market on Friday 03 September, the pair soared to a height of 1.1908, and finished five days at 1.1880. The weakening of the US currency continues after Fed chief Jerome Powell's dovish statements in Jackson Hole and amid uncertainty with the timing of the beginning to wind down the fiscal stimulation program (QE).
Fed management cites sustained improvement in the employment situation as a major condition for reducing stimulus. However, ADP data on changes in the number of US private sector employment released on Wednesday was significantly worse than expected, with 374K instead of the projected 613K. Such an important indicator as the number of new jobs created in August outside the agricultural sector (NFP) added pessimism: the real figure was 3.2 times lower than the forecast (235K instead of 750K). And this despite the fact that the NFP was 1053K in July. All this suggests strongly that the pace of recovery in the US economy is falling, and it is too early to talk of the start of QE reduction and, even more so, of an interest rate rise on the dollar.
As a result, the DXY dollar index (the ratio of USD to a basket of six major foreign currencies) has dropped from 93.63 to 92.07 since August 20, while risk sentiment in the market, on the contrary, has increased. The S&P500 stock index continues to update historic highs, and its chart resembles a north-easterly straight now. It is very similar to the one drawn by the martingale-based expert advisor until... a collapse occurs. A number of experts predict the fate of a bursting bubble in the future for the stock market as well.
As for the EUR/USD pair's future, only 35% of the experts surveyed vote for its continued growth, 20% vote for the pair's fall. The remaining 45% have taken a neutral position in anticipation of clearer signals from the US Federal Reserve regarding the start of QE curtailment.
The indicators on D1 are as follows. Among the oscillators, 85% point north, the remaining 15% give signals that the pair is overbought. Among the trend indicators, 75% are directed upward (note that there were only 20% of those a week earlier). Support levels are 1.1845, 1.1800, 1.1750, 1.1705 and 1.1665. Resistance levels are 1.1910, 1.1975, 1.2025 and 1.2100.
As for the events of the coming week, the release on September 7 of the data on GDP of the Eurozone for Q2 should be noted. The forecast here is disappointing: it is expected to fall 0.6% compared to a 2.0% increase in the previous period. The ECB's interest rate decision will be known on Thursday September 09, but it is very likely to remain unchanged at 0%. Therefore, a subsequent press conference by the European regulator's leadership will be of much greater interest. Finally, Germany's HICP, the Consumer Price Index, which estimates the inflation rate of the country that is the locomotive of the European economy, will be unveiled on Friday, September 10.
GBP/USD: Wherever the Euro Goes, the Pound Goes
We called this part of the review "Wherever the Euro Goes, the Pound Goes" last time and we left the title unchanged this week. Because nothing that would initiate an independent movement of the GBP/USD pair has happened. Just like the European currency, and for the same reasons, the British one has been growing against the dollar since August 20. The two-week high was reached on September 03 at 1.3890, and the last chord of the trading session sounded at 1.3865.
The pair is currently in the central part of the 1.3800-1.4000 channel, where it appears periodically since February 2021. If it goes north (this scenario is now supported by 60% of analysts), then the nearest strong resistance will be met at the level of 1.3960, then 1.4100. The bulls aim to refresh the June 01 high at 1.4250. In case of the opposite development (20% of experts' votes), it will be supported in zones 1.3730, 1.3665 and 1.3600. The remaining 20% of analysts vote for a sideways trend.
Among the oscillators on D1, 60% are colored green, 20% have taken a neutral position, and another 20% indicate that the pair is overbought. In trend indicators, greens win with a score of 9:1.
As we know, the main indicators of economic recovery and the signal for the start of contraction of monetary stimulus programs are two factors: labour market health and inflation. That is why it is worth paying attention this week to the hearing of the UK Inflation Report, which will take place on Friday September 10.
USD/JPY: Most Unflappable Pair
As a safe haven, the USD/JPY pair has been moving along the 110.00 horizon since last March, making rare attempts to get out of the 108.30-111.00 trading channel. So this time, having started the five-day week at 109.80, it first dropped by 20 points, then rose by 80, then dropped again and ended the week almost at the same place where it started, at the level of 109.70.
Even the statement of Japanese Prime Minister Yoshihide Suga about his intention to resign could not influence the yen rate. His popularity was hit by the Tokyo Olympics this summer. Many considered their hosting not a celebration of sport but a fueling of another wave of coronovirus, leaving COVID-19 incidence in the country now three times higher than during the previous waves.
A number of experts consider the departure of Yoshihide Suga a harbinger of possible changes in the economic policy of the Japanese government, in connection with which the Nikkei index rose by 2%, but the yen rate decided not to react to this, showing a truly icy calm.
The experts' forecast for the near future looks like this: 35% of them side with the bulls, 45% - with the bears, and 20% have taken a neutral position. As for the indicators on D1, here it is still impossible to give priority to any of the directions.
Support levels are 109.40, 109.10, 108.70 and 108.30. The bears' dream is to retest the April low of 107.45. The nearest resistance levels are 109.85, 110.25, 110.55, 110.80, 111.00 and 111.65. The ultimate goal of the bulls is still the same: to get to the cherished height of 112.00.
CRYPTOCURRENCIES: Ethereum vs Bitcoin
Amid the continued weakening of the dollar and rising risk appetite, the BTC/USD pair is trying to gain a foothold above the important psychological level of $50,000 for the second week. It broke through this resistance for the third time and reached $51.085 at the time of this writing, on Friday September 03.
The Crypto Fear & Greed Index added just 1 point for the week, rising from 71 to 74. But the total crypto market capitalization has grown from $2.021 trillion to $2.275 trillion. And the core cryptocurrency accounts for only about $58bn: bitcoin's dominance continues to decline. It fell from 43.77% to 41.41% in seven days, while ethereum is improving its position step by step. So, if the share of ETH was 18.07% of the total market capitalization on August 28, it was already 20.45% on September 03.
Many analysts and influencers continue to sing difirambs to ethereum, preening that it will push bitcoin back to the second line at some point. A week ago, we cited the opinion of the creator of this altcoin, Vitalik Buterin, who expects the price of ETH to reach $30,000. In this case, the capitalization of the coin will rise to $3 trillion, and exceed the capitalization of all major technology companies in the world.
Analyst Aaron Arnold agrees with Buterin. In his YouTube channel (952 thousand subscribers) he named the fundamental factors that, in his opinion, will provoke the "explosive" growth of ethereum. The expert considers a key feature the recent change in the altcoin blockchain, which introduced a digital coin burning mechanism. The London update was released on ethereum network on August 05, which completely changed the transaction fee mechanism. A portion of the commission that miners previously received as a reward is now burned. According to the Ultrasound.Money service, more than 174,000 coins worth more than $565 million have been burned since the activation of this update. The average burning rate is 3.77 coins per minute.
The analyst named the decrease in net inflation in Ethereum as the second growth factor. According to Arnold's calculations, it is only 1.1% in annual terms at the moment, while the same indicator for bitcoin is at the level of 1.75%.
Arnold also recalled the multiple growth of funds blocked in the decentralized finance (DeFi) sector. In his view, this is the third factor that contributes to ethereum's price hike. According to DeFi Pulse, if the volume of blocked funds was $16 billion on January 1 of this year, this figure had already reached $82 billion by August 30 (an increase of 412% since the beginning of the year).
It should be noted that the dynamics of recent months confirms the rosy forecasts for ethereum in full. If BTC has risen in price by about 72% since July 20, ETH has grown by 130%. In the last week alone, this altcoin is up 22%, while bitcoin is up just 2.5%. The advantage of ethereum is also obvious at a distance of 12 months: plus 820% for ETH, plus 350% for BTC.
If Vitalik Buterin predicts the growth of his brainchild to $30,000, you can still hear the figure of $100,000 in the forecasts for the BTC/USD pair. It is exactly the height that British analyst and Northstar & Badcharts co-founder Kevin Wadsworth believes the pair will reach before the end of 2021. After that, the current bullish stage for the cryptocurrency will be completed.
Speaking of the first cryptocurrency, Wadsworth believes that its value will increase "in September, October and, presumably, in November." Some of the leading altcoins (such as ethereum), he said, could also rise significantly, since a rise in prices by 3-4 times is quite likely.
PlanB analyst is also confident that BTC will break the $100,000 level by Christmas. This is indicated by the signals of his S2F forecasting model.
Bitcoin's prospects for further growth are also indicated by year analysis of cryptocurrency behavior. Analysts at Twitter Root channel are confident that the main driver of BTC is halvings (a 2-time reduction in mining awards). They form a shortage of coins in the market, which positively affects the value of a digital asset. As for bitcoin, it has yet to fulfil the growth potential that halving put into it in May 2020.
Another growth driver, besides halving, is the US Federal Reserve's full-fledged printing press. Moreover, both corporations and individuals get substantial chunks of this dollar "pie". CNBC revealed that 11 per cent of young US residents have invested some of the capital they received in the form of assistance from the state during the COVID-19 pandemic in bitcoin and other coins. And 60 per cent of them are set to hold the asset long-term.
On the other hand, the CEO of Euro Pacific Capital and the "golden beetle" Peter Schiff, said that he considers those who hold and do not sell bitcoins to be "real idiots". Investor John Paulson expressed a similar opinion. This billionaire called cryptocurrency a "bubble" in an interview with Bloomberg. In his view, the digital asset market will "ultimately prove worthless," so it is not worth investing in it. "Cryptocurrencies are a bubble. I would describe them as a limited supply of nothing. If the demand is greater than the limited supply, the price will rise. But, if demand falls, the price will also fall. None of the cryptocurrencies have intrinsic value," Paulson explained his point.
And in conclusion, as usual, our not very serious section of life hacks with another piece of advice on how to get rich on cryptocurrency. It turns out that you just need to purchase an electric car of the IM brand for this. Backed by the Internet giant Alibaba, electric car maker Zhiji Auto has developed an app for car owners to earn digital currency per mileage traveled.
Motorists will have to enter information about each kilometer they run in order to enter the mining pool. They will receive the Stone digital currency as a reward. The company plans to issue 500 coins 144 times a day for a start. The issue will be halved every four years to maintain liquidity.
The asset can be exchanged for various services of the company. When the car's mileage reaches 5,000 km, its owner will be able to purchase a next-generation smart driving system for coins or increase the battery capacity to 120 kWh.
ECB Preview: Recalibrating, Not Tapering – But Hawks Will Squawk
The ECB meeting on Thursday next week is set to focus on the PEPP re-calibration and
the inflation outlook. With stable and benign financial market conditions, record low
real rates and an economy that is recovering well in Q3 as well, the conditions are met
to slow the PEPP purchase pace…
… but ECB will not call this tapering. We expect ECB and president Lagarde to stress
that the re-calibration is not be compared to tapering, but ECB responding to the
changes in financing and economics conditions by aligning its PEPP volume. We
expect PEPP purchases to be similar to the January/February level of EUR60bn/month,
down from the current c. EUR80bn/month. That said, without an external shock to the
economy we find it hard to argue to for a higher PEPP volume in the current ECB
growth and inflation narrative.
Diverging views in the Governing council have already started to show in recent weeks.
The July minutes showed varying views about how to align the communication to the
new strategy. We expect further discussions about de-linking the rates forward
guidance and APP to play a role at upcoming meetings, but foresee no changes to the
guidance yet.
At the December meeting, we expect a bigger QE calibration ‘battle’ to take place.
Lane’s interview last week said that APP volume cannot be seen in isolation of net
supply, hence scaling up of APP cannot be ruled out at this stage. We also expect
liquidity operations will be extended at the December meeting.
That also means that from a market perspective, ECB will attempt to keep this meeting
as uneventful as possible, yet the fall will be very interesting as hawks start to squawk
more loudly than previous. We continue to expect Bunds to stay in a -60bp to -20bp
range for the foreseeable future.
Growth Rate Slashed – RBA Should Respond
Following the stubbornly high Victorian case count and the associated decision by the Victorian government to abandon the zero case objective we have reviewed our growth forecasts for the Australian economy.
The Growth Numbers
Our forecasting process is based around using our estimates for growth in hours worked in the states which rolls up into the national numbers. This approach gives allows us to cross check our estimates against previous Lock Downs while also taking into account the proprietary information on credit and debit card usage with our Card Tracker Index.
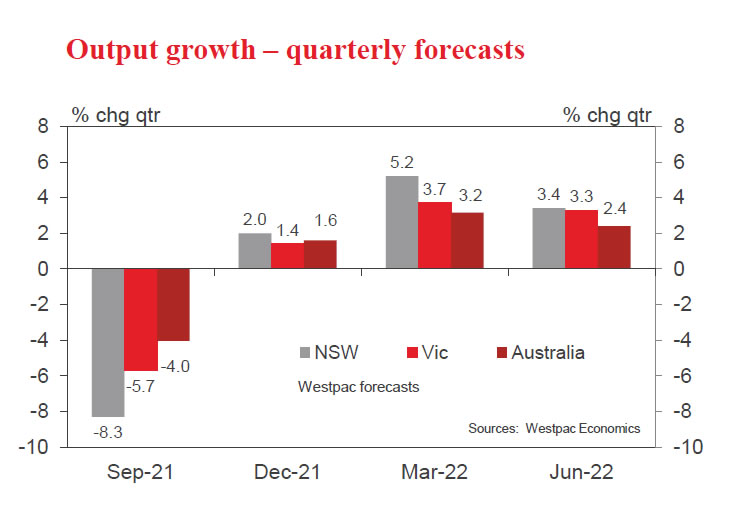
We have lowered our forecast for GDP growth in the September quarter from –2.6% to –4.0%.
We have lowered our growth forecast in the December quarter from 2.6% to 1.6%.
We have lowered our growth forecast for 2021 from 2.4% to 0%.
We have increased our forecast for growth in 2022 from 5% to 7.4%.
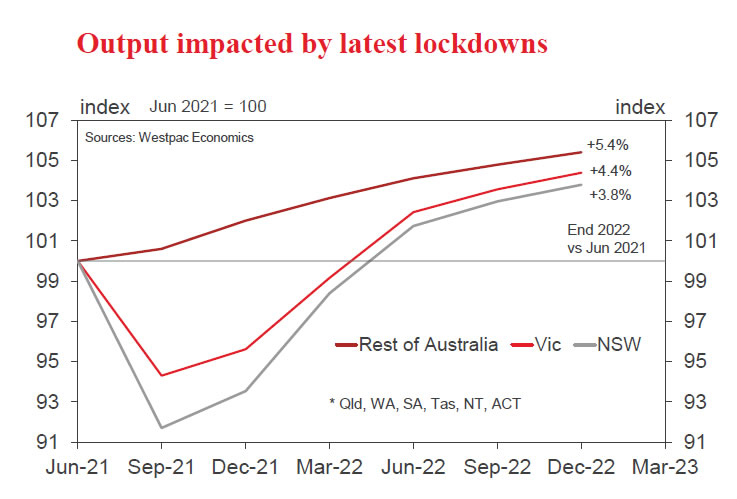
For the September quarter we maintain our forecast that NSW will contract by 8.3% but now expect Victoria to contract by 5.7% – recall Melbourne went into Lock Down on August 6 and is now forecast to stay there until the end of October.
The forecast recovery pace in NSW in the December quarter has been lowered to 2% while the Victorian pace of recovery is forecast at 1.9%.
Recognising this weaker near-term growth outlook will mainly impact the labour market through falls in hours worked and the participation rate we have retained our forecast unemployment rate by end October at 5.8% while the slower recovery in the December quarter sees the unemployment rate down to 5.4% in December compared to 4.9% in our earlier forecast.
With a strong recovery expected in 2022 we have retained our target unemployment rate of 4% by end 2022.
The Background
Our most recent set of forecasts was released on August 16 and was underpinned by the assumptions that the NSW Lock Down would continue until early November but the Victorian Lock Down would be eased in early September.
On August 16 NSW reported 478 cases while Victoria announced 22 new cases.
Today NSW reported 1431 new cases and Victoria reported 208.
As Victoria has struggled to contain the virus in the intervening weeks it became clear that extensions to the Lock Down would be necessary but we have waited for more concrete guidance from the Government. That guidance was delivered this week with Premier Andrews abandoning the zero cases target in favour of a vaccination target.
Our new forecasts assume that Melbourne will remain in Lock Down until the end of October, although there will be some easing in the Victorian regions.
Our assumptions around NSW and the rest of the country (no significant Lock Downs) remain unchanged from the August 16 estimates.
We have also reviewed our assumptions about the shape of the recovery in the months of November and December once the NSW and Melbourne Lock Downs are eased.
The early stages of the recovery are now expected to be much more restrained than earlier expected as state borders remain closed and the NSW and Victorian governments, despite achieving the 80% vaccination targets, are cautious about overwhelming already stretched hospital systems in the early stages of a reopening.
The openings in both NSW and Victoria are now expected to be in the context of ongoing heavy case loads.
The current pace of vaccination in Queensland and Western Australia points to the 80% vaccination rate in those states not being reached until well into December making it highly likely that these states will continue to close their borders to NSW and Victoria.
A report in the Australian Financial Review recently quoted statistics from NSW Health that in the four weeks to August 14 of the 6480 positive cases reported in NSW only 2.7% were fully vaccinated, compared to around 30% fully vaccinated in the community.
This statistic best summarises the power of full vaccination and as we move into 2022 when the nation is set to reach 80% vaccination (16 and above, with the 1.2 million children in the 12–15 age groups also rising quickly) and likely to move to 90% (surveys show that only around 10% of the population are opposed to vaccination) allowing the economy to recover quickly.
That will be underpinned by a large boost in federal government stimulus as the federal election draws near; the reopening of NSW and Victoria after a "slow start" in the December quarter of 2021; a strong household balance sheet (household savings rate likely to start the year well above 10%); the reopening of all borders including the foreign border (by mid-year); a booming housing market and a strong world economy.
It is worth noting the 9.6% growth rate in the Australian economy in the year to June 2021, as printed in this week's national accounts, reflected the benefits of the previous reopening.
In that context our 7.4% for 2022 seems achievable.
Also note that our forecast of a 1.4% fall in the unemployment rate in 2022 compares with the 3.0% fall we have seen in the last year.
While there seems little doubt that the Australian economy will contract sharply in the September quarter the recovery profile carries much uncertainty.
We have already highlighted some issues for the near term while the medium-term outlook carries even more risk.
Low levels of vaccination in the developing world raise the prospect of new vaccine resistant mutations. Questions about the duration of the efficacy of the current vaccines have been raised with the prospect of regular boosters on the horizon. Vaccine hesitancy, particularly in the "zero case" states may be higher than currently estimated – delaying the reopening of borders or risking the problems we see in the US where the rate of vaccination varies widely across states leading to crises in those states with low vaccination.
Domestic risks centre around potential scarring in the business sector as policy support for business in these Lock Downs is much less generous than JobKeeper, especially in Victoria where there has been a patchwork of support measures compared to the Job Saver package in NSW.
We expect that now that the Victorian picture is clearer there will be a more coordinated support package for business where the Federal government plays a key role.
So, while our 7.4% recovery pace in 2022 is our base case the forecast carries much more uncertainty than is usually the case where risks are typically dominated by the more familiar policy risk; structural imbalances and the global outlook.
The Reserve Bank
The Reserve Bank Board meets next week on September 7.
Markets will be focussed on the Board's decision on its Quantitative Easing Policy.
Last month the Board confirmed its decision in July to scale back bond purchases from $5 billion per month to $4 billion from early September.
Daily cases in NSW were running at around 200 and Melbourne was still open. Today NSW has just reported 1431 cases and Victoria 208.
The Board was advised that the economy was likely to contract by "1% at least" in the September quarter and the economy was set to expand 4% in 2021.
At the time of the August meeting Westpac had forecast that the economy would contract by 2.2% in the September quarter as NSW was in Lock Down.
As discussed above, Westpac is now forecasting a contraction of 4% in the September quarter and zero growth in 2021.
We expect that the Board will now be getting advice that the contraction in the September quarter will be much greater than 1% and the growth forecast in 2021 will be slashed.
Recall the Board's comments in the July Minutes, "Given the high degree of uncertainty about the economic outlook members agreed that there should be flexibility to increase or reduce weekly bond purchases in the future, as warranted by the state of the economy AT THE TIME."
With that guidance in mind, it came as a surprise that the Board decided to persist with its taper policy – effectively reducing the amount of policy stimulus at a time when it was being advised that the economy was contracting.
The explanation was (SOMP, August 6) "The need for additional policy support in response to the outbreaks is in the short term…strong growth is expected to resume next year…fiscal policy is the more appropriate instrument" BUT, "the Board will nonetheless keep the rate of bond purchases under review in light of the evolving health situation and is prepared to act if worsening health outcomes affect the economic outlook."
I think there is no doubt of "worsening health outcomes" so it would be quite extraordinary if the Board did not decide to delay the taper.
The subtle issue is around timing. If the view at the Board is that QE is only effective in the medium term then I think they are underrating the only flexible instrument (highly unlikely to increase the TFF; no need for negative rates or extending YCT) which it has at its disposal.
Recall the almost immediate market response back in September last year (when the recovery was clearly underway), after the Deputy Governor hinted at the possible introduction of QE – bond spreads and AUD responded immediately.
A delay in the taper is unlikely to generate much market response but a decision to actually lift weekly purchases from $5 billion to $6 billion would impact markets, including bond spreads and the AUD.
It would not be the size of the increase but the signal that the RBA was prepared to do more than just reverse the August decision and respond to the deteriorating outlook.
Some may describe the current situation as merely a temporary contraction that will soon be unwound. And our forecast of 7.4% growth in 2022 is consistent with that view. But it is unprecedented and while base cases point to a strong recovery there are formidable risks (as discussed above), firstly around the shape of the near-term recovery and secondly with ongoing and unique health uncertainties.
The view of others is that the Board could not save face if it flipped from confirming a taper to boosting purchases. But the health situation has deteriorated alarmingly and the uncertainties with the virus cast meaningful doubt around the outlook for 2022.
And the wording in the July Minutes and the August SOMP have cleared the way for a policy surprise.
Perhaps there are considerations of limited supply. But the cost of support packages already in place; along with further packages, including additional pressure on NSW and Victorian governments could lift supply by $30 –$40 billion while the automatic stabilisers associated with a fall in GDP growth in 2021/22 from 4.25% (Budget estimate) to 2.5% will also lift the deficit by a further $10– $5 billion.
In fact, a pivot towards more support for State governments in any lift in purchases would be prudent. (Perhaps the additional $1 billion could be allocated 50/50 between Commonwealth and States).
Conclusion
We fully expect that the taper commitment will be deferred.
But an even better response would be to lift purchases from $5 billion to $6 billion with a review at the November Board meeting when the risks around the reopening of the economies and the spread of the virus will be much clearer.
The Reserve Bank has always been prepared to contribute to policy efforts to assist in dealing with economic shocks. This brutal contraction in the economy should be no exception.
CFTC Commitments of Traders – Risk Currencies to Gain Ground after Weaker-than-Expected Nonfarm Payrolls
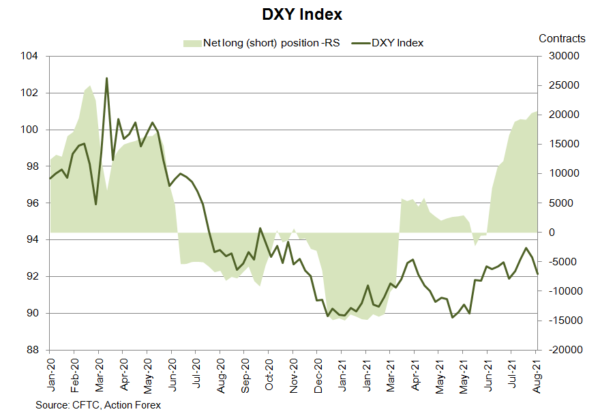
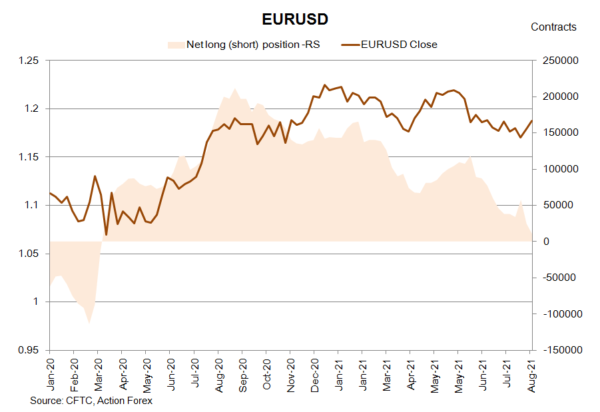
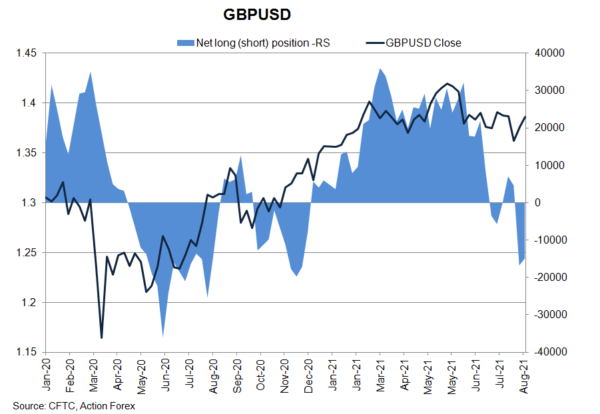
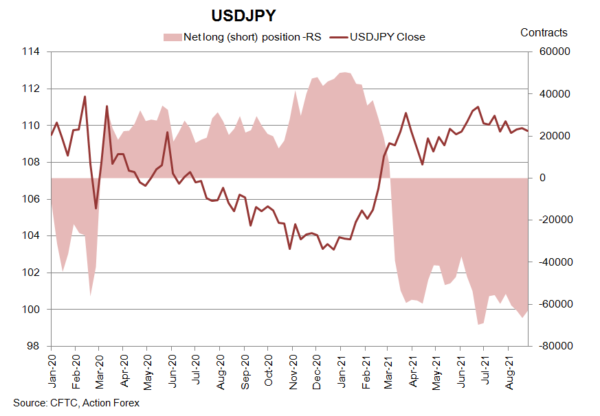
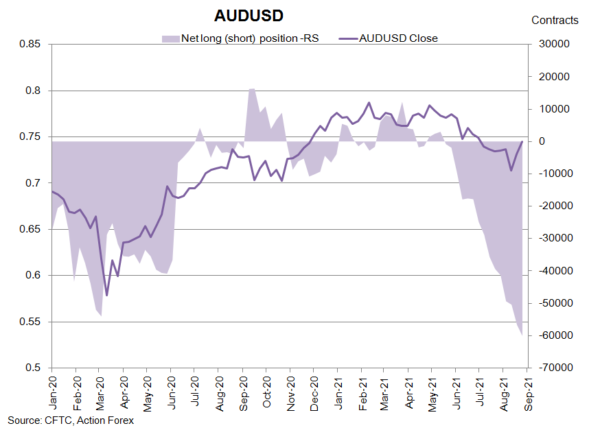
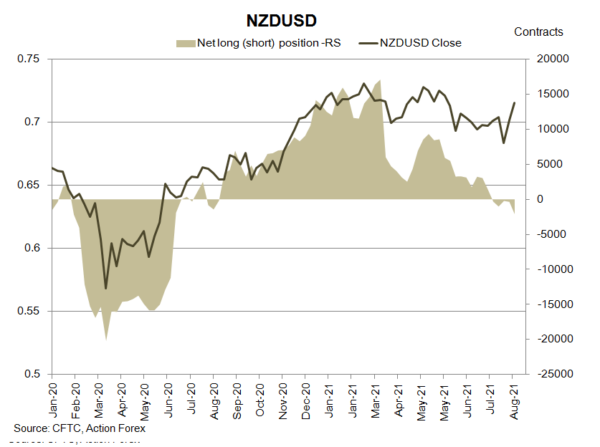
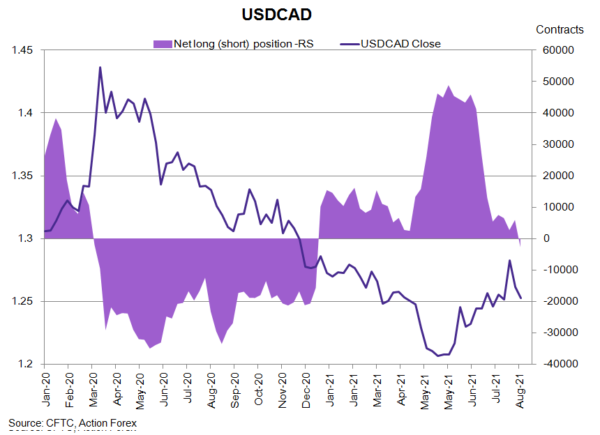
In the last week of August, bets on USD index futures fell on both sides as traders pondered Fed Chair Powell's Jackson Hole speech and awaited the August employment report. As speculations of Fed's tapering tamed after both events, it is likely that the euro, as well as commodity currencies, would see increase(decrease) in net longs (shorts) in the coming week. As suggested in the CFTC Commitments of Traders report in the week ended August 31, NET SHORT of USD index futures gained +328 contracts to 20 690. Speculative long positions slipped -709 contracts while speculative shorts dropped -1 037. NET LENGTH in EUR futures more than halved to 10 476 contracts. GBP futures' NET SHORT fell -1 845 contracts.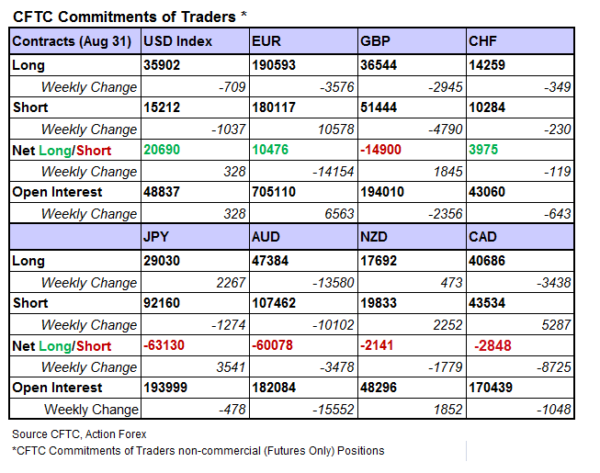
On safe-haven currencies, NET LENGTH of CHF future dropped -119 contracts to 3 975 while while NET SHORT of JPY futures declined -3 541 contracts to 63 130. Concerning commodity currencies, NET SHORT of AUD futures rose 3 478 contracts to 60 078 while that of NZD futures tgained +1 779 contracts to 2 141 during the week. CAD futures drifted to NET SHORT of 2 848 contracts.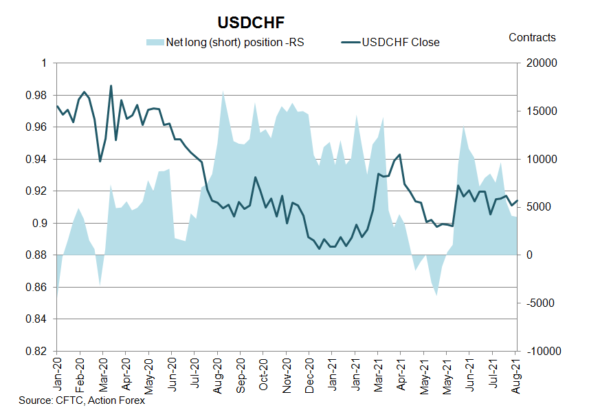
CFTC Commitments of Traders – Gold Strengthened Further as Tapering Hopes Faltered
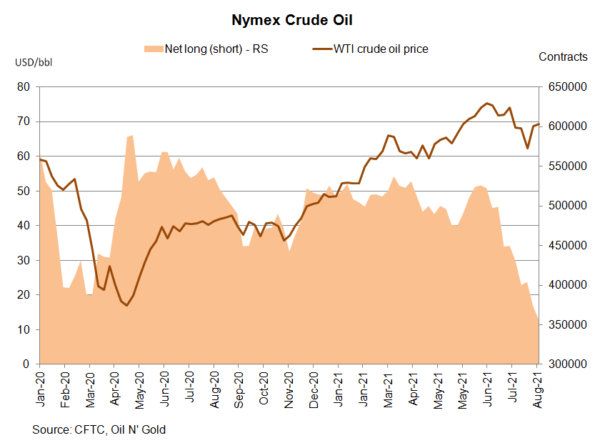
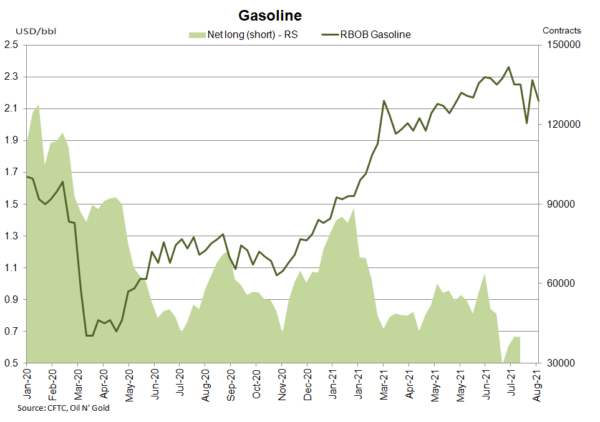
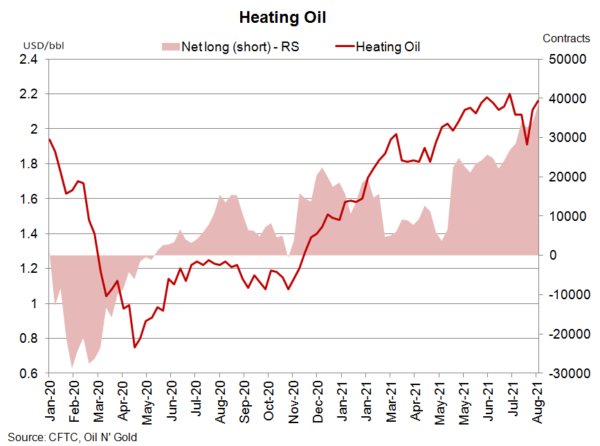
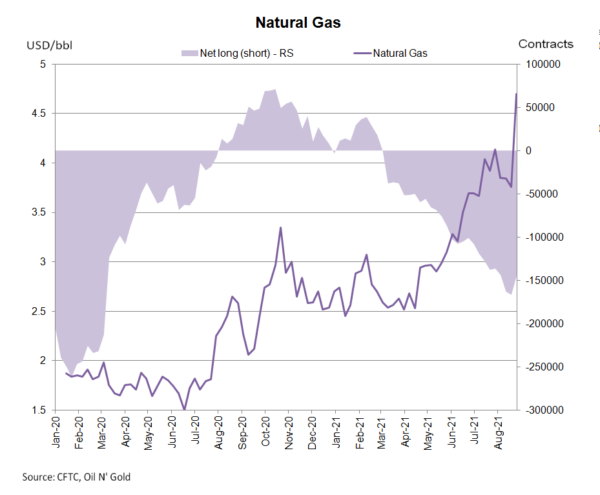
According to the CFTC Commitments of Traders report for the week ended August 31, NET LENGTH for crude oil futures sank -17 784 contracts to 356 528 for the week. Speculative long position declined -13 154 contracts, while shorts gained +4 630 contracts. It is possible to see an increase in net longs next week as crude oil prices strengthened after disappointing US job report. Yet, we expect the rebound to be short-lived. For refined oil products, NET LENGTH for heating oil rose 4 563 contracts to 38 583, while that for gasoline increased +5 337 contracts to 42 221. NET SHORT of natural gas futures declined -21 882 contracts to 144 695 during the week.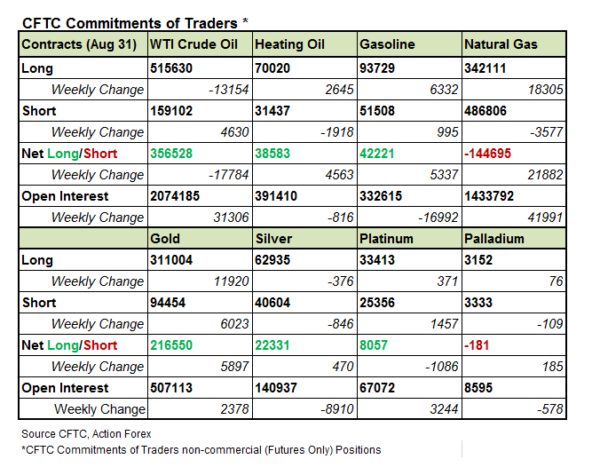
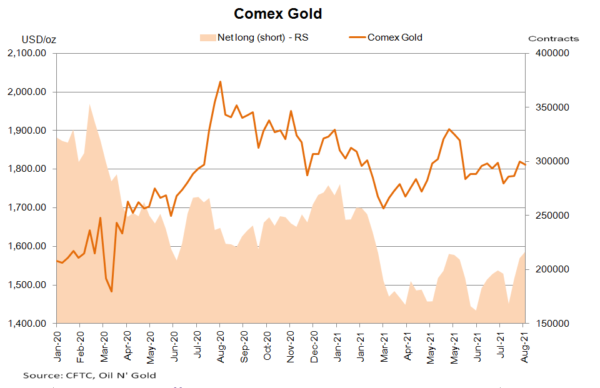
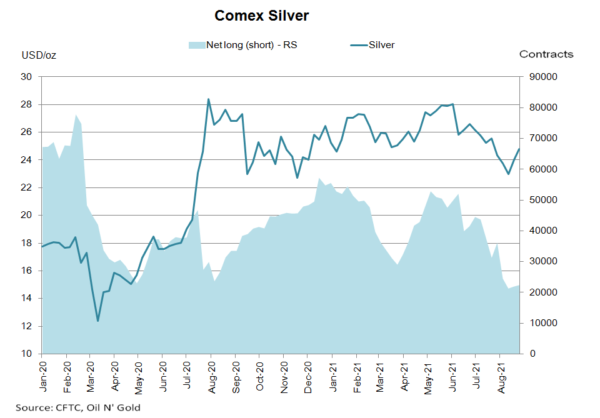
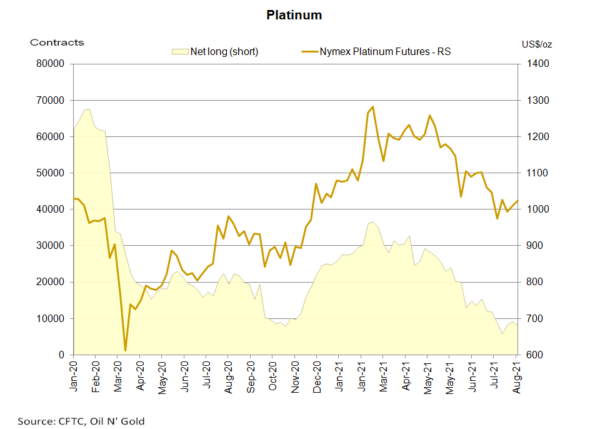
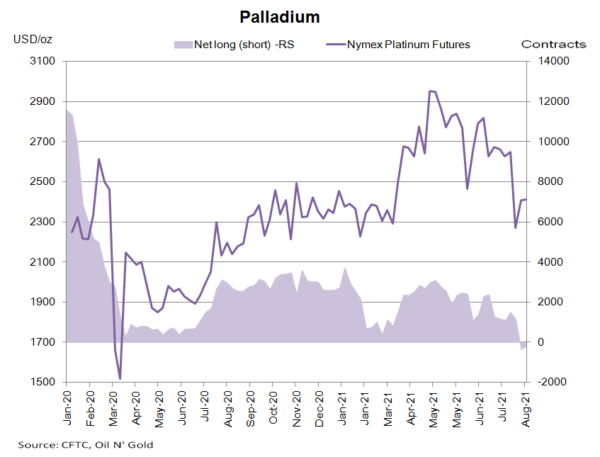
 Gold futures’ NET LENGTH gained +5 897 contracts to 216 550. Strength in gold price over the past week signals that net longs would increase further. The yellow metal has gained support from tamed speculations of Fed's tapering after the Jackson Hole symposium and a softer than expected nonfarm payrolls report. Silver futures’ NET LENGTH added +470 contracts to 22 331. Note, however, that bets were trimmed on both sides. For PGMs, NET LENGTH of Nymex platinum futures dropped -1 086 contracts to 8 057, while NET SHORT for palladium futures slipped -185 contracts of 181.
EUR/USD Weekly Outlook
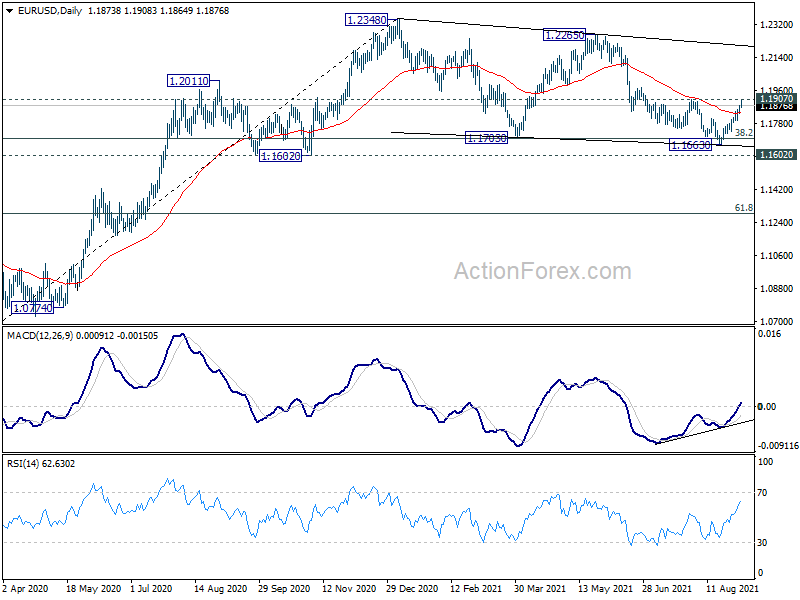
EUR/USD's rebound from 1.1663 extended higher last week. Initial bias remains on the upside this week with focus on 1.1907 resistance. Decisive break there will indicate that fall from 1.2265, as well as the consolidation pattern from 1.2348, have completed. Near term outlook will be turned bullish for 1.2265/2348 resistance zone. However, on the downside, rejection by 1.1907 followed by break of 1.1792 support will dampen the bullish case, and turn bias back to the downside for 1.1663 support instead.

In the bigger picture, rise from 1.0635 is seen as the third leg of the pattern from 1.0339 (2017 low). Further rally remains in favors long as 1.1602 support holds, to cluster resistance at 1.2555 next, (38.2% retracement of 1.6039 to 1.0339 at 1.2516). However sustained break of 1.1602 will argue that the rise from 1.0635 is over, and turn medium term outlook bearish again. Deeper fall would be seen to 61.8% retracement of 1.0635 to 1.2348 at 1.1289 and below.
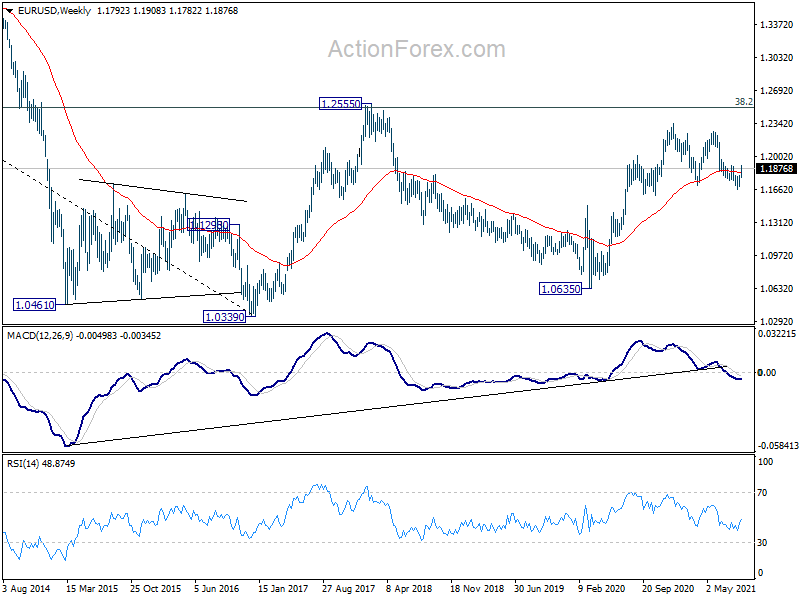
In the long term picture, focus remains on 1.2555 cluster resistance (38.2% retracement of 1.6039 to 1.0339 at 1.2516). Sustained break there should confirm long term bullish reversal and target 61.8% retracement at 1.3862 and above. However, rejection by 1.2555 will keep long term outlook neutral first, and raise the prospect of down trend resumption at a later stage.

USD/JPY Weekly Outlook
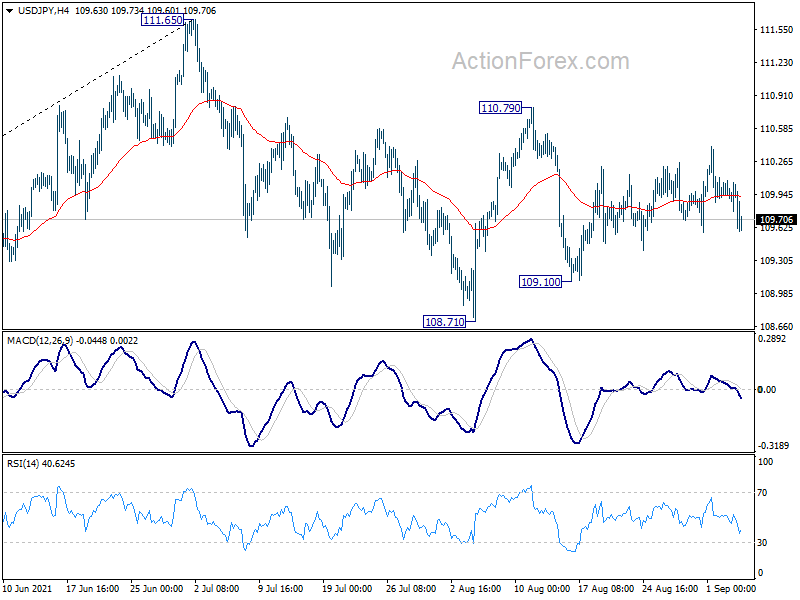
Range trading continued in USD/JPY last week again and outlook is unchanged. Initial bias remains neutral this week first. On the upside, break of 110.79 will resume the rebound from 108.71 to retest 111.65 high. On the downside, break of 109.10 will target 108.71 support first. Firm break there will resume the decline from 111.65 and target 38.2% retracement of 102.58 to 111.65 at 108.18 next.
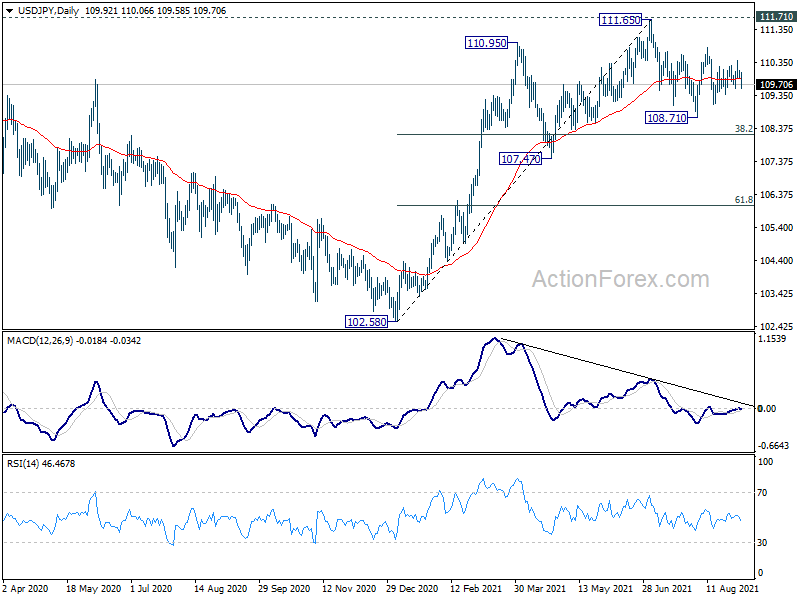
In the bigger picture, medium term outlook is staying neutral with 111.71 resistance intact. The pattern from 101.18 could still extend with another falling leg. Sustained trading below 55 day EMA will bring deeper fall to 107.47 support and below. Nevertheless, strong break of 111.71 resistance will confirm completion of the corrective decline from 118.65 (2016 high). Further rise should then be seen to 114.54 and then 118.65 resistance.
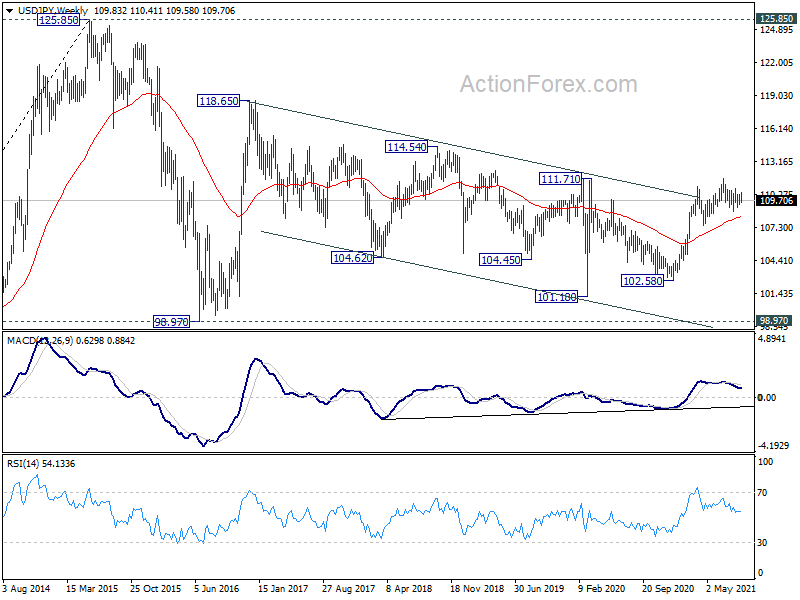
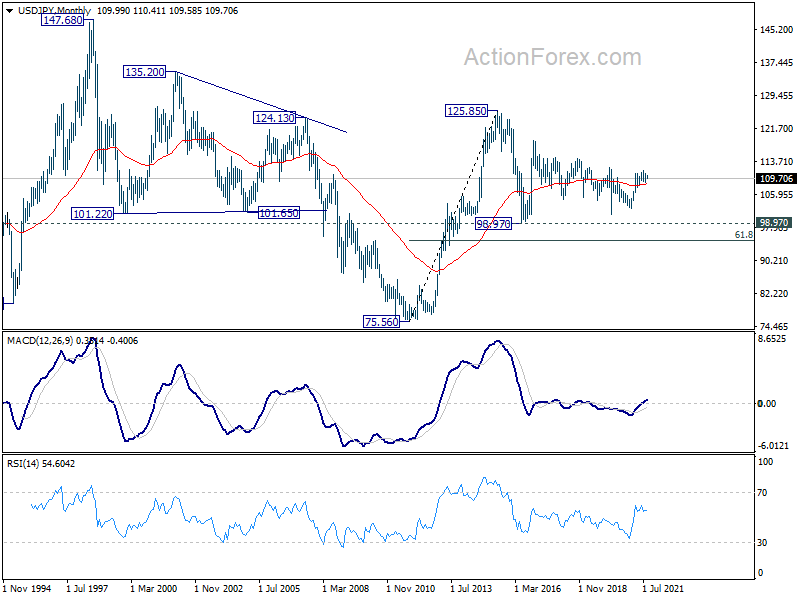
In the long term picture, the rise from 75.56 (2011 low) long term bottom to 125.85 (2015 high) is viewed as an impulsive move, no change in this view. Price actions from 125.85 are seen as a corrective pattern which could still extend. In case of deeper fall, downside should be contained by 61.8% retracement of 75.56 to 125.85 at 94.77. Up trend from 75.56 is expected to resume at a later stage for above 135.20/147.68 resistance zone.
GBP/USD Weekly Outlook
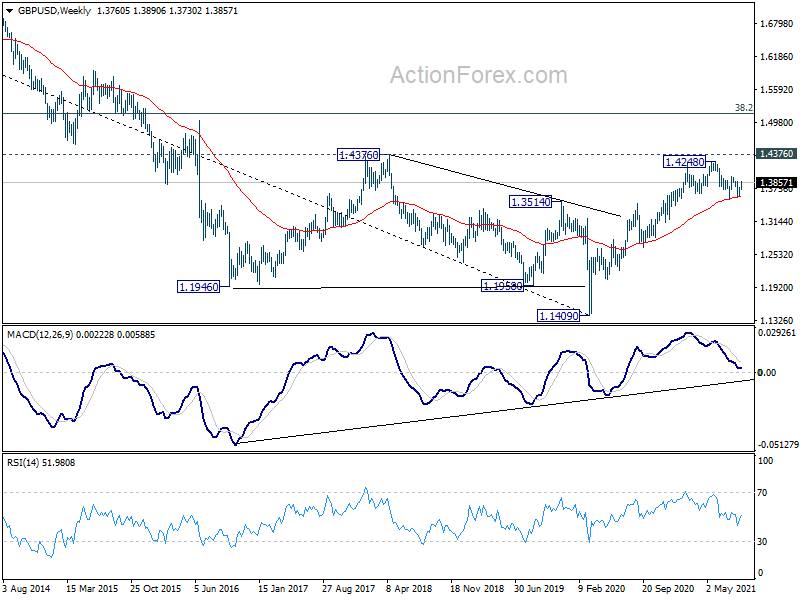
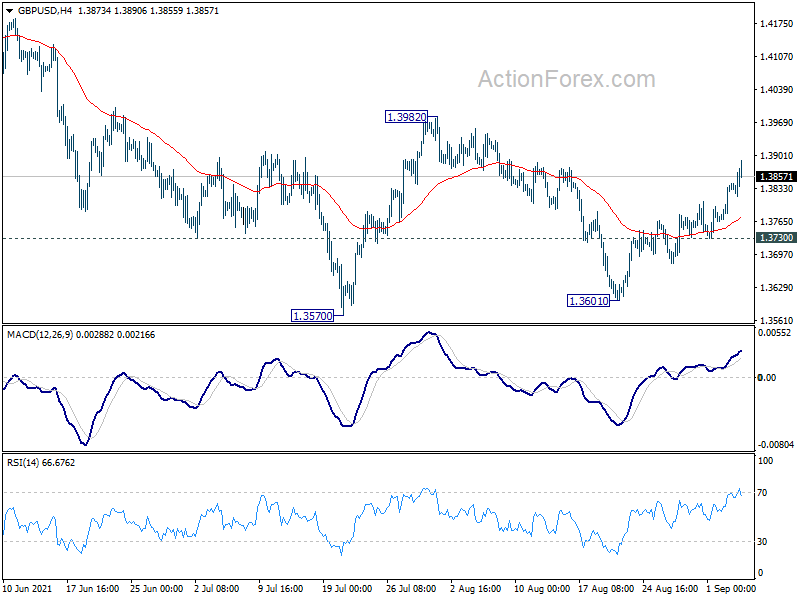
GBP/USD's rise from 1.3601 extended further last week and hit as high as 1.3890. Initial bias stays on the upside this week for 1.3982 resistance first. Decisive break there will l indicate that fall from 1.4248 has completed. Near term outlook will be turned bullish for retesting 1.4248. However, on the downside, break of 1.3730 support will bring retest of 1.3570/3601 support zone instead.
In the bigger picture, as long as 1.3482 resistance turned support holds, we'd still treat price actions from 1.4248 as a corrective move. That is, up trend from 1.1409 (2020 low) is in favor to resume. Decisive break of 1.4376 key resistance (2018 high) would indeed carry long term bullish implications. However, sustained break of 1.3482 will at least bring deeper fall to 38.2% retracement of 1.1409 to 1.4248 at 1.3164, or even further to 61.8% retracement at 1.2493.
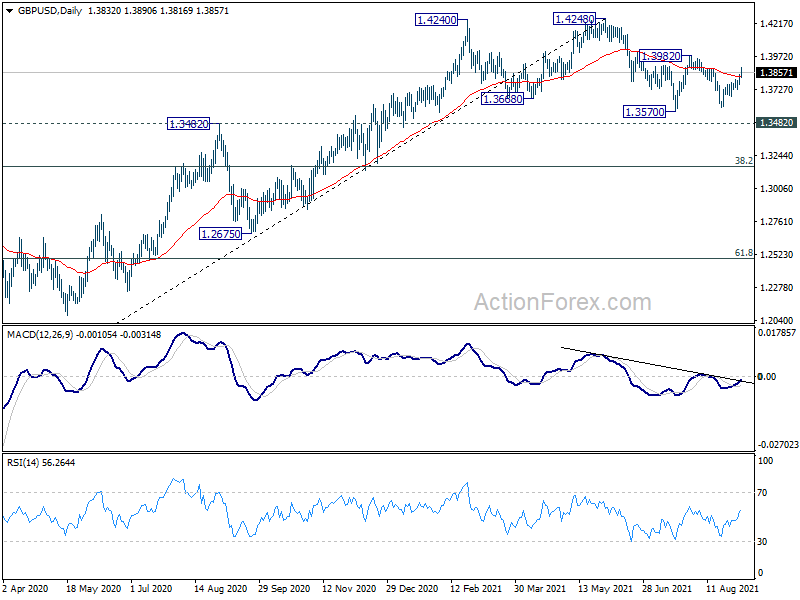
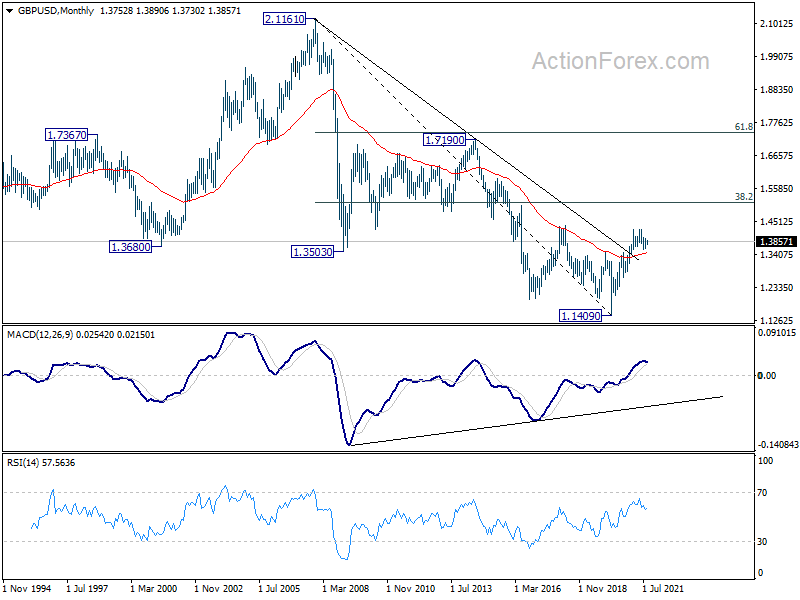
In the longer term picture, a long term bottom should be in place at 1.1409, on bullish convergence condition in monthly MACD. Rise from there would target 38.2% retracement of 2.1161 to 1.1409 at 1.5134. Reaction from there would reveal whether rise from 1.1409 is just a correction, or developing into a long term up trend.