Sample Category Title
The Analytical Overview Of The Main Currency Pairs
The EUR/USD currency pair
Technical indicators of the currency pair:
Prev Open: 1.1874
Prev Close: 1.1878
% chg. over the last day: +0.03%
Despite the decline in the dollar index, the EUR/USD currency pair remained at about the same level by the end of the day on Friday. The European currency is under pressure since some ECB officials began calling for a reduction in the QE program after last week's poor inflation data. The ECB meeting on monetary policy will be held on Wednesday, so no strong growth in quotes should be expected before that time.
Trading recommendations
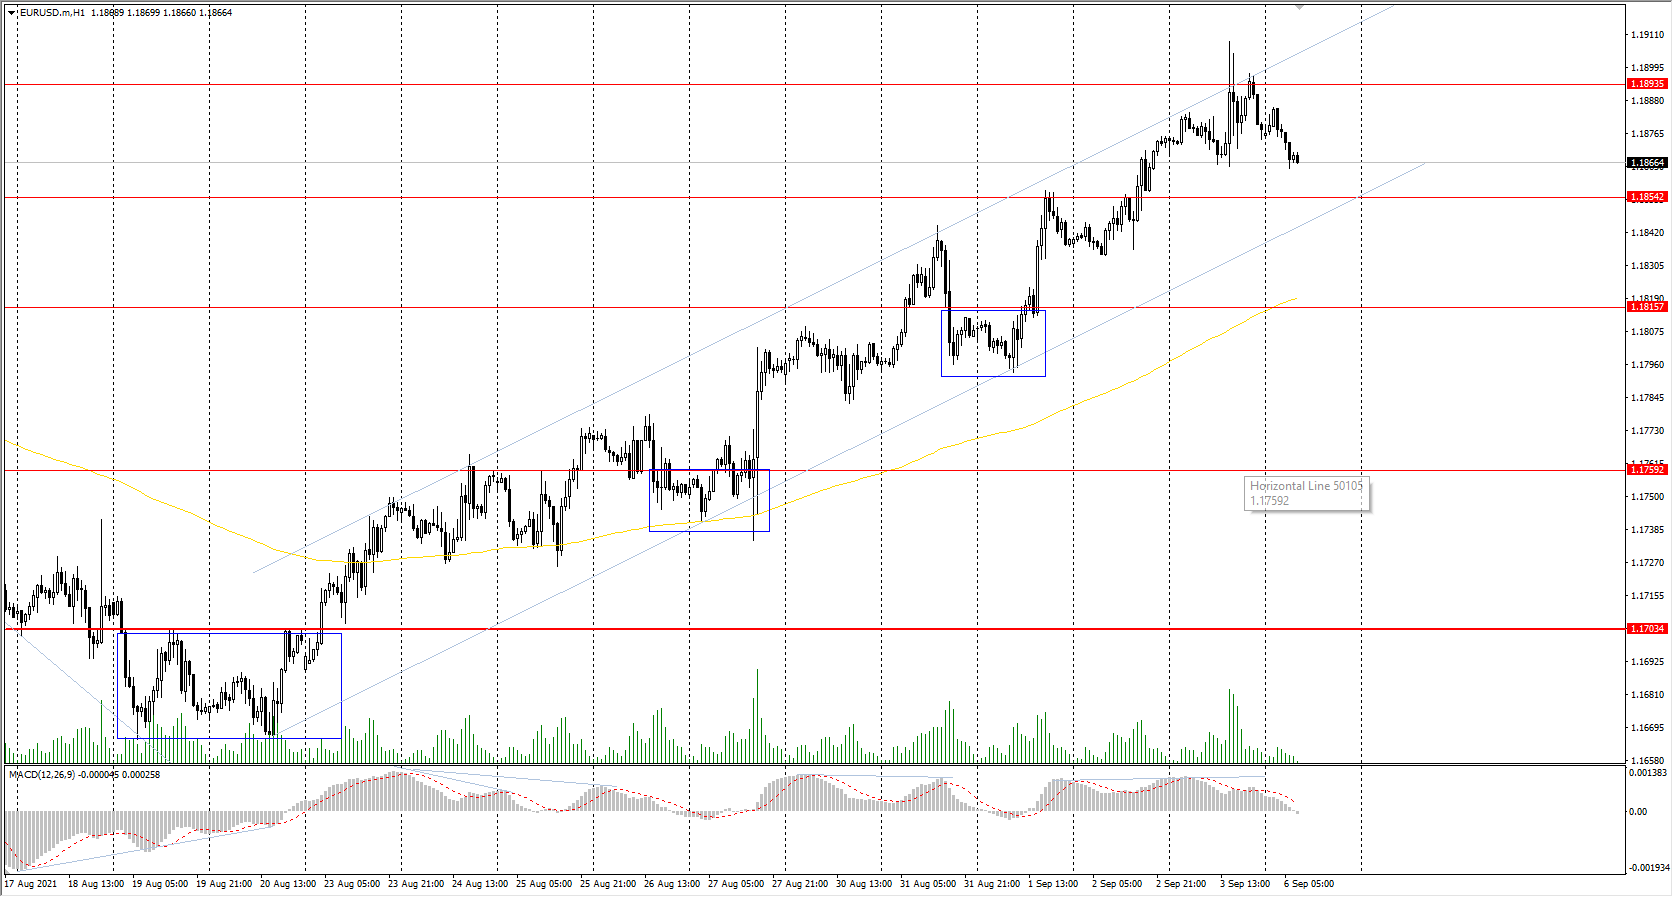
Support levels: 1.1854, 1.1816, 1.1799, 1.1759, 1.1704, 1.1620
Resistance levels: 1.1894, 1.1934, 1.1969
From a technical point of view, the general trend of the EUR/USD currency pair is bullish. The price broke through the priority change level and consolidated above. The MACD indicator is still signaling a divergence in the opposite direction. The price has deviated from the moving average; given the divergence, there is an increasing probability of a corrective downward movement. Under such market conditions, it is best to look for sell trades from the resistance levels, where sellers show initiative. Buy trades can be considered only after a pullback to the support levels near the moving average.
Alternative scenario: if the price breaks through the 1.1704 support level and fixes below, the mid-term uptrend will likely be broken.
The GBP/USD currency pair
Technical indicators of the currency pair:
Prev Open: 1.3832
Prev Close: 1.3843
% chg. over the last day: +0.08%
The British pound is also getting stronger against the background of the dollar index decline. However, statistical data from the industrial and service sectors showed a slowdown in the recovery, which will have a negative impact on the national currency as well.
Trading recommendations
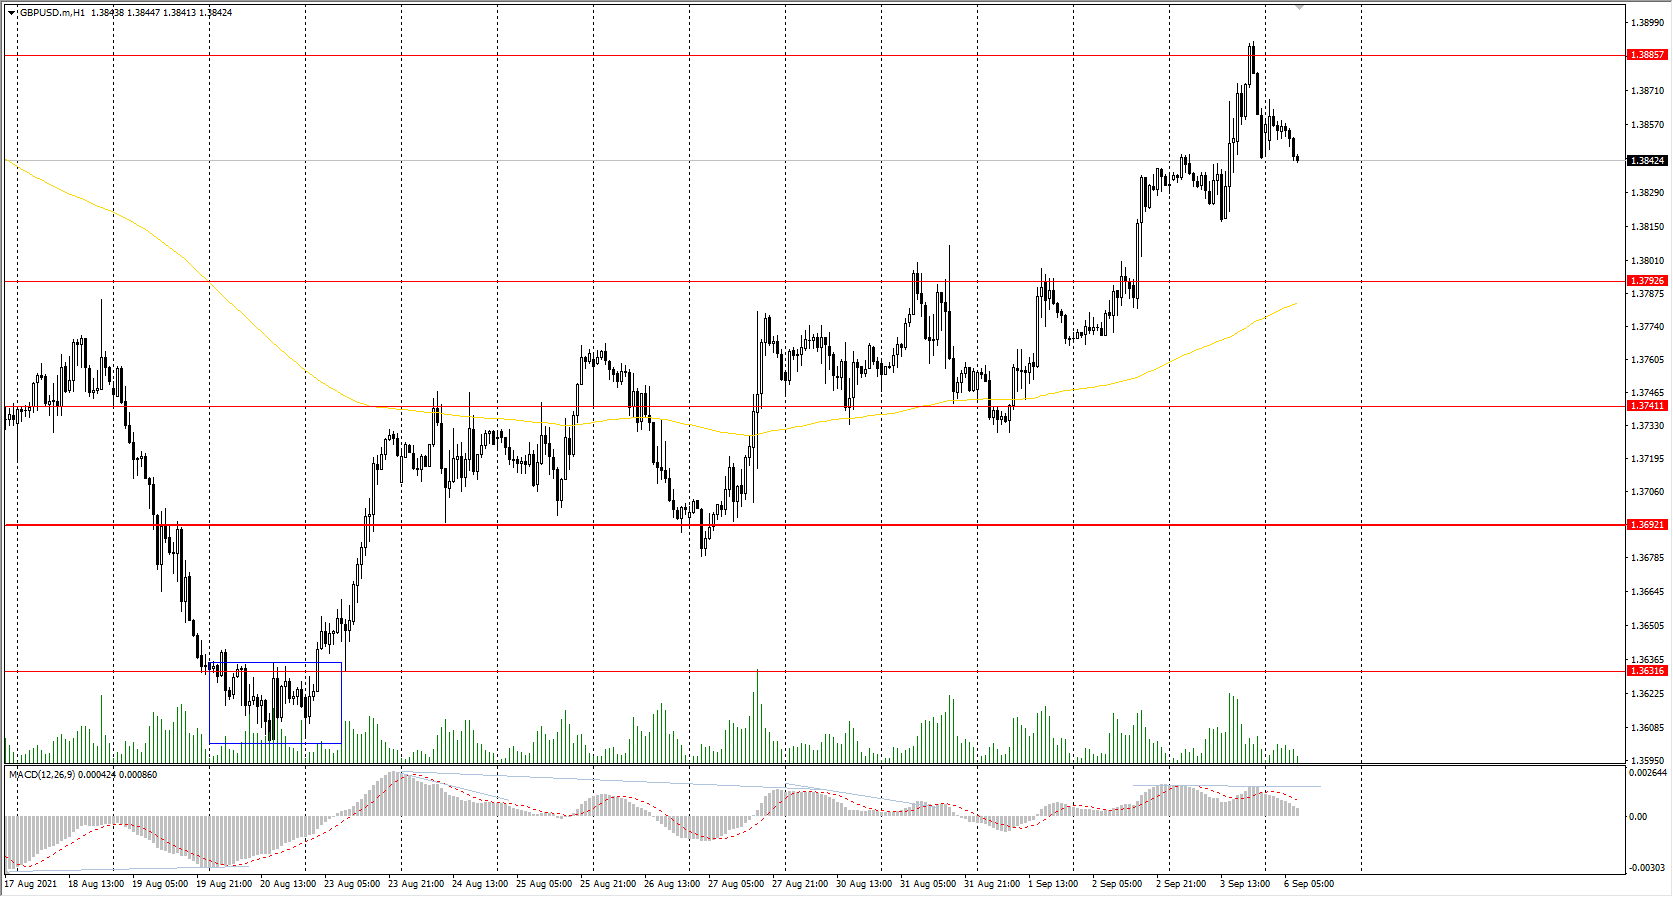
Support levels: 1.3793, 1.3741, 1.3692, 1.3632, 1.3614, 1.3525
Resistance levels: 1.3886, 1.3935, 1.4002
On the hourly time frame, the GBP/USD trend is bullish. The price broke through the priority change level on the impulsive movement and consolidated higher. The MACD indicator is in the positive zone, and there are the first signs of divergence on higher time frames. Under such market conditions, it is better to look for buy trades from the support levels after the price pullback as the price has now strongly deviated from the moving average. Sell positions can only be considered from the resistance levels with short targets throughout the day.
Alternative scenario: if the price breaks through the 1.3692 support level and consolidates below, the bearish scenario will likely resume.
The USD/JPY currency pair
Technical indicators of the currency pair:
Prev Open: 109.91
Prev Close: 109.68
% chg. over the last day: -0.21%
The USD/JPY currency pair is highly dependent on the dynamics of the dollar index now. The dollar index is declining, which leads to a decrease in the USD/JPY quotes. Japan will report GDP data for the last quarter this week and many economists are predicting stronger economic growth than it has been initially reported. On Friday, Japanese Prime Minister Yoshihide Suga announced that he will resign, setting the stage for a new prime minister afterward. This news not only strengthened the Japanese currency but also Japan's main index, the Nikkei 225.
Trading recommendations
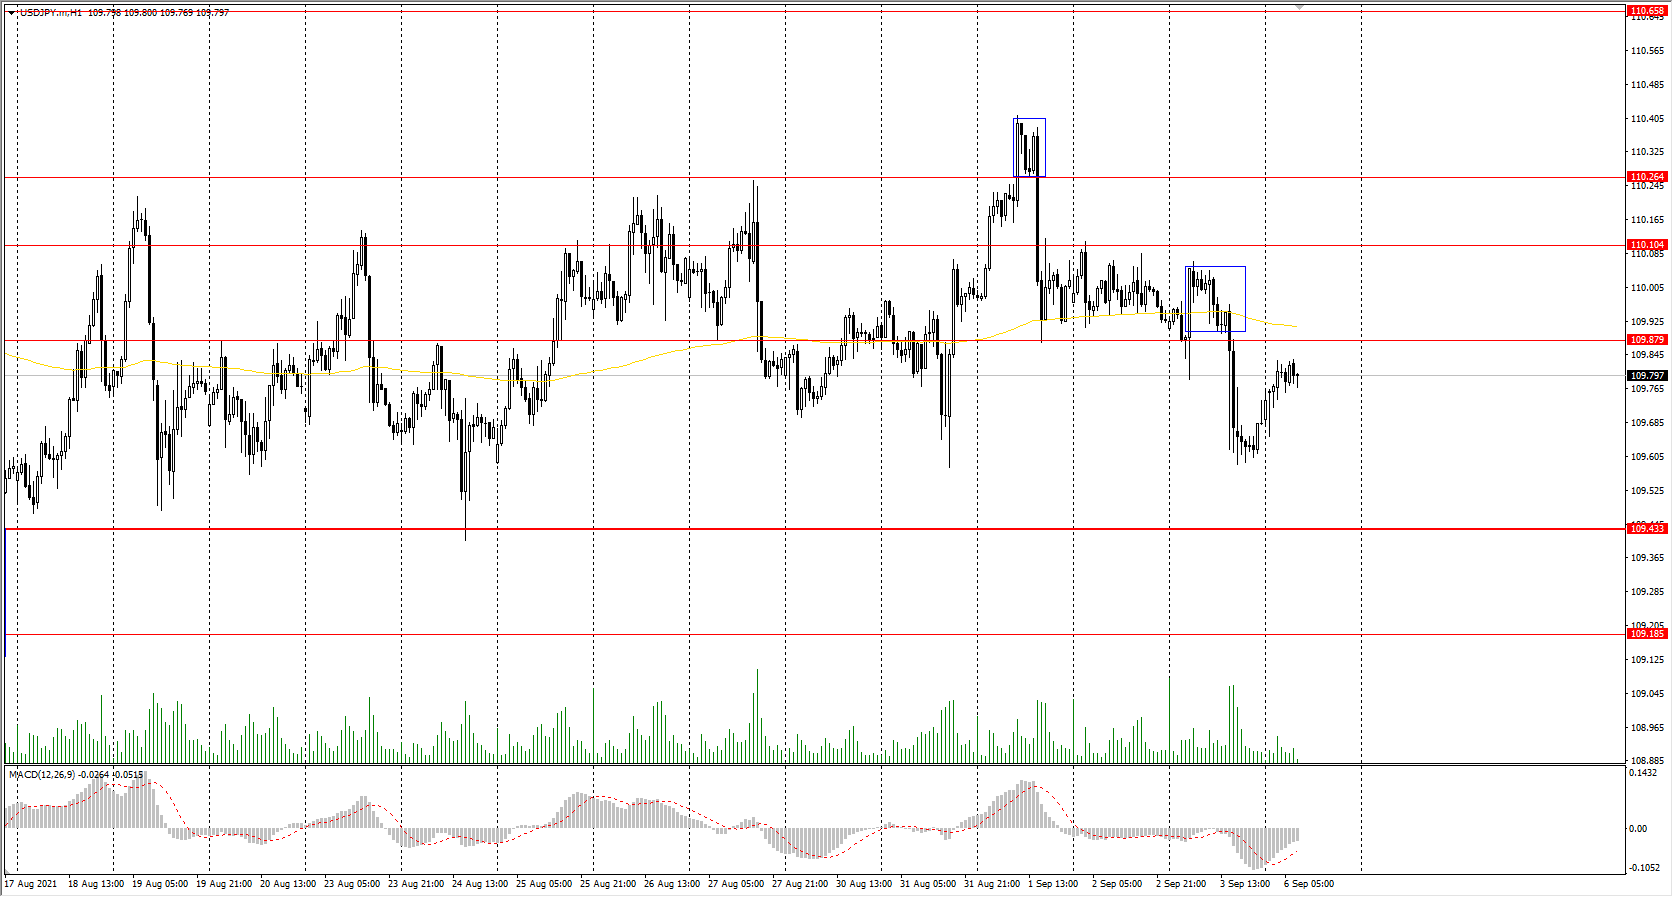
Support levels: 109.43, 109.19, 108.65
Resistance levels: 109.88, 110.11, 110.34, 110.66, 110.95, 111.48
The main trend of the USD/JPY currency pair is bullish. Now the price is trading in a wide corridor, but there are signs of sellers' pressure. The MACD indicator has become negative. Under such market conditions, traders should look for buy trades from the support level, where buyers show initiative. Sell positions should be considered only on the lower time frames from the positions where sellers show initiative.
Alternative scenario: if the price falls below 109.43, the uptrend is likely to be broken.
The USD/CAD currency pair
Technical indicators of the currency pair:
Prev Open: 1.2550
Prev Close: 1.2518
% chg. over the last day: -0.26%
The Canadian dollar is a commodity currency, so the USD/CAD currency pair is highly dependent on the dynamics of the dollar index and oil prices. The dollar index has been decreasing during the last week, while oil prices have been growing. As a result, the USD/CAD currency pair is now decreasing due to the strengthening of the Canadian dollar.
Trading recommendations
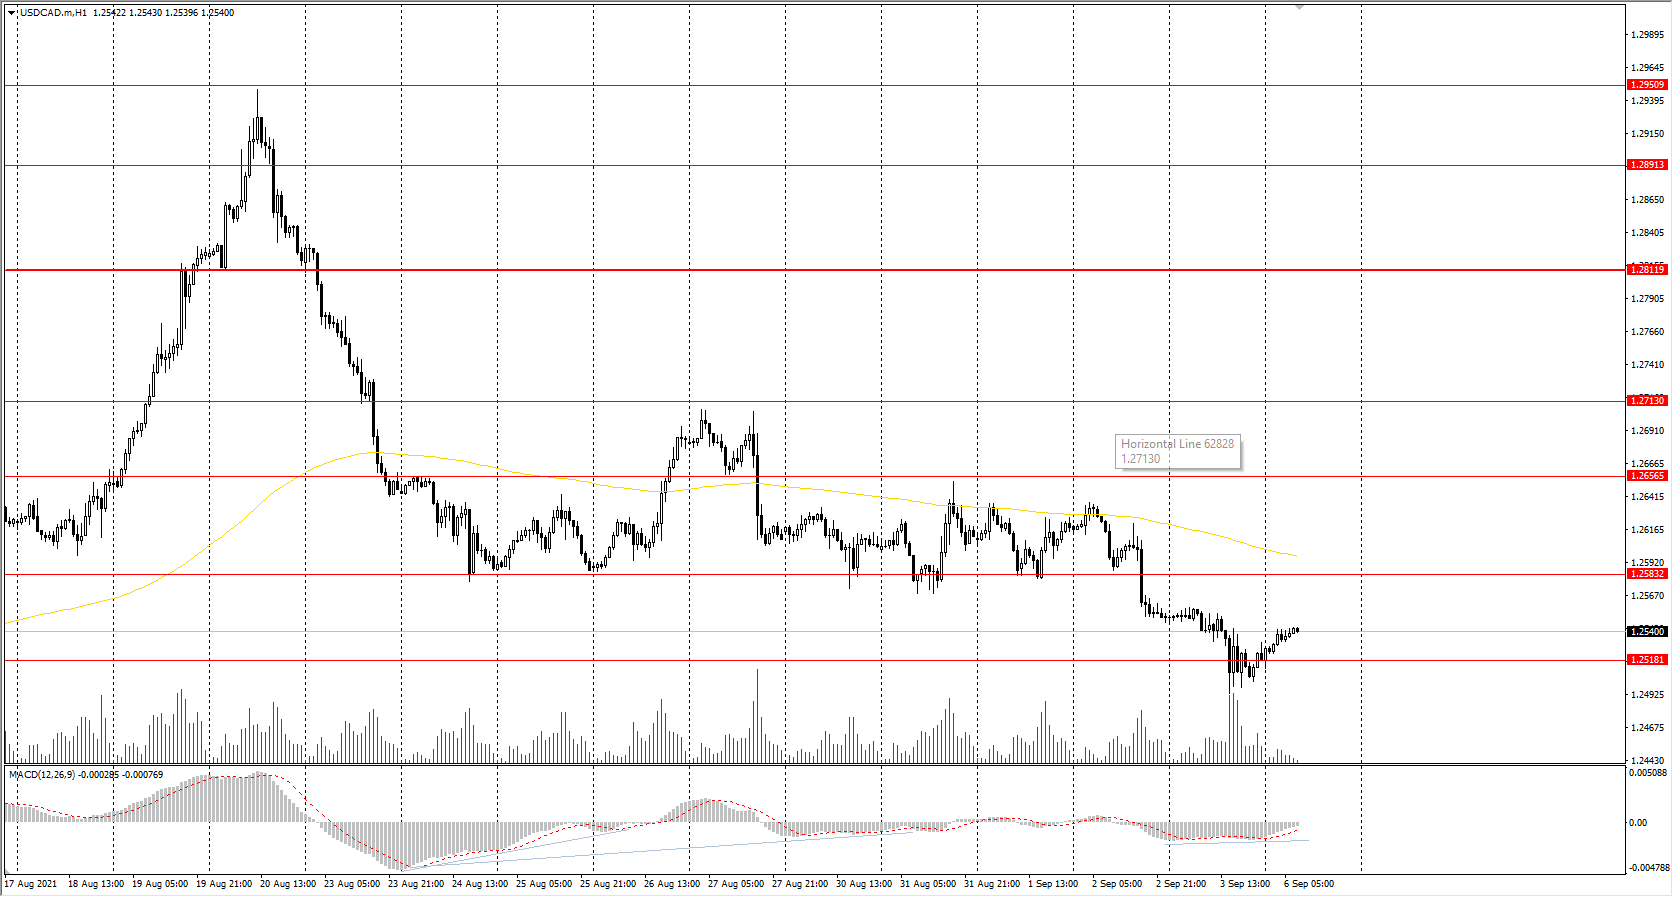
Support levels: 1.2518, 1.2425
Resistance levels: 1.2583, 1.2656, 1.2713, 1.2812, 1.2891, 1.2951
In terms of technical analysis, the trend on the USD/CAD currency pair has changed to bearish. The price broke through the priority change level on the impulsive movement and consolidated below. It is better to consider sell positions from the resistance levels, where sellers show initiative. Buy positions can be considered from the support levels after additional confirmation in the form of buyers' initiative.
Alternative scenario: if the price breaks through the 1.2812 resistance level and fixes above, the uptrend will likely resume.
The Dollar Index Declines Amid Weak Labor Market Statistics
Last week investors' attention was focused on Non-Farm Payrolls data. The labor market statistics were disappointing. The US economy added only 235,000 jobs in August (vs. 733,000 expected). This is a very sharp slowdown in the labor market. The main reason is the increase in the number of Delta cases. However, the data from the previous two months were revised upward, and the unemployment rate decreased to 5.2% (previously 5.4%). On the one hand, such statistics would be negative for the dollar index and positive for the stock market. On the other hand, the market sentiment is now sharply shifting towards further growth of the major US indices. Considering the strongest divergence with the technical indicators, which indicates the strong overbought market, such market conditions will put pressure on the growth of quotes. In other words, the growth of main indices is limited. On Friday, the main American indices failed to strengthen. By the end of the week, the Dow Jones index decreased by 0.2%, while the S&P 500 increased by 0.6%, and the Nasdaq jumped by 1.6%. It’s a Bank Holiday in the United States and Canada today, so with no important events in the European session, the trading day will be quiet.
The leading US infectious disease expert, Dr. Anthony Fauci, said that officials were likely to get regulatory approval soon to introduce the COVID-19 booster vaccines produced by Pfizer. Moderna is a bit behind in this regard. Last month, the Biden administration announced that it would begin offering boosters to Americans by September 20. A week ago, Israel began offering Pfizer's 3rd vaccine to people older than 12. Officials said the effectiveness of the second dose of Pfizer declines five months after the vaccination, requiring revaccination. A third dose restores the level of protection.
European stock indices also decreased, following the US ones. On Friday, the British FTSE 100 decreased by 0.36%, Germany's DAX 30 decreased by 0.37%, France's CAC 40 lost 1.1%, Italy's FTSE MIB decreased by 0.64%, and Spain's IBEX 35 lost 1.3%. The spread of Delta negatively affects business activity in the Eurozone, slowing the pace of recovery. After last week's poor inflation data, some ECB officials began calling for a reduction in the QE program. The ECB meeting on monetary policy will be held on Wednesday, so traders should not expect a strong increase in major indices until then.
At the close of the Tel Aviv Stock Exchange on Sunday, Israel's main index TA 35 added 0.33%, reaching a new all-time high. The Israeli index often reflects investor behavior after Friday and before the opening of trading in the United States. So it is very likely the major US stock indices will continue to rise on Tuesday.
In October, the Saudi state oil company, Saudi Aramco, said that it would cut prices on all oil varieties for buyers from Asia and the Mediterranean countries. Oil prices began to decline at the opening of trading on Monday amid this news. This suggests that Saudi Arabia is assessing the situation on the worsening prospects for global demand because of the new wave of COVID-19 in the world. On the other hand, the number of active oil rigs in the US decreased by 16 units (to 394) last week due to Hurricane Ida, which resulted in a slight decline in production.
Chinese Internet giant Alibaba will invest the equivalent of $15.5 billion over five years to the country's "general prosperity." The 100 billion Chinese yuan will be spread over 10 initiatives, including technological innovation, support of economic growth in China's less-developed regions, and support of workers and young entrepreneurs. The investment from Alibaba followed a similar $7.7 billion promise from Tencent. Both companies have previously been the focus of Chinese regulators. Many economists believe that this is a deal with the government to reduce the pressure.
Main market quotes:
- S&P 500 (F) 4,535.43 −1.52 (−0.03%)
- Dow Jones 35,369.09 −74.73 (−0.21%)
- DAX 15,781.20 −59.39 (−0.37%)
- FTSE 100 7,138.35 −25.55 (−0.36%)
- USD Index 92.12 −0.11 (−0.12%)
Dollar Pares NFP-Led Losses, Focus Turns To ECB
- Dollar off lows, yields edge up as investors digest mixed jobs report
- Global equities rally, led by China and Japan, spurred by stimulus hopes
- Aussie slips ahead of RBA decision, euro eyes ECB meeting
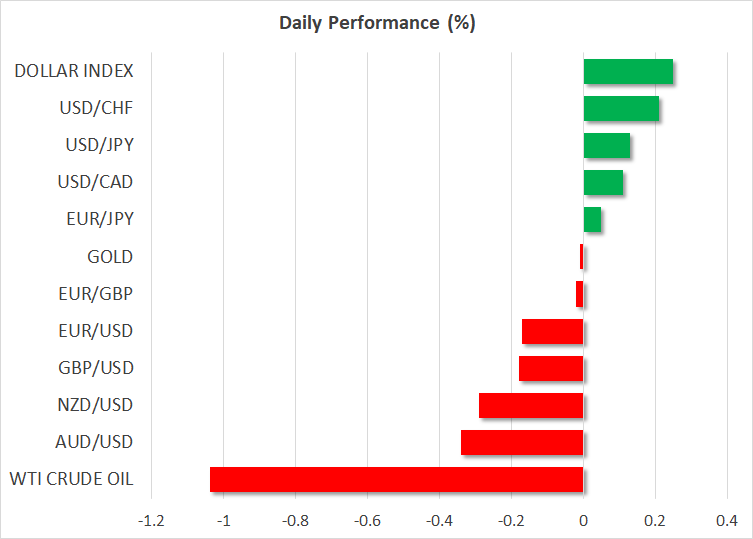
Dollar recoups some losses as Fed outlook little changed
The US dollar is recovering from one-month lows on Monday, having deepened its latest slide on Friday following the mixed readings on the labour market. The US economy added far fewer jobs than anticipated in August, but the unemployment rate nevertheless dropped to a new post-pandemic low of 5.2% while wage growth accelerated.
Traders had been speculating about whether another stellar report would give the Fed the green light to announce tapering in September. But the unexpected slowdown in hiring is more supportive of a late fall or end-of-year action. The overall take from the NFP numbers was that the Federal Reserve will likely intensify taper discussions in September but not reach a decision until its November meeting.
However, whilst the moves in FX markets indicated a big adjustment to Fed taper expectations, bond markets signalled otherwise. The yield on 10-year Treasury notes whipsawed on the back of Friday’s data, which also included the ISM non-manufacturing PMI. The closely watched gauge on the services sector fell in August compared to July but remained elevated. More importantly, the employment and new orders sub-indices were little changed, suggesting the NFP miss was likely a blip.
Even if the American economy is losing some momentum, there’s still a very strong case for the Fed to pull back some of its stimulus in the coming months so the tapering narrative hasn’t really changed much after the soft jobs data.
The dollar index was last up 0.2%, propped up by Friday’s one-week high in the 10-year yield. US markets are closed today due to the Labor Day holiday, but Wall Street futures are inching higher, taking their cues from Asia, following a mixed finish to last week.
Policy hopes boost Chinese and Japanese stocks
Stocks in China and Japan surged on Monday, lifting the mood globally. China’s CSI 300 index closed up 1.9% after authorities announced plans for a new stock exchange, which will serve small- and medium-sized enterprises and be based in Beijing. Moreover, the government also tried to allay fears of further regulatory crackdowns by reinforcing its support for private enterprises.
In Japan, meanwhile, local equities extended their gains following Prime Minister Suga’s surprise resignation on Friday. The Nikkei 225 index added another 1.8% and the Topix index jumped to a 31-year high on hopes that Suga’s successor will push for more fiscal spending and have better success in bringing the latest outbreak of the coronavirus under control.
Amid the light schedule for the rest of the day, European markets followed their Asian counterparts higher.
RBA coming up, ECB in spotlight too
Central banks will be dominating the agenda this week, with investors bracing for possible tapering by the European Central Bank on Thursday. ECB policymakers have stepped up their hawkish rhetoric lately as the Eurozone recovery has made substantial progress during the summer. Expectations that the ECB might slow its asset purchases as early as this week have been aiding the euro’s rebound versus the greenback over the past couple of weeks. However, even if policymakers do decide to ease up on their stimulus slightly, they’re unlikely to signal any further tapering before the end of the year, potentially disappointing some investors and capping the euro’s gains.
The Australian dollar is also facing downside risks heading into Tuesday’s policy meeting by the Reserve Bank of Australia. Prolonged lockdowns in many parts of Australia could force a policy U-turn by the RBA, which had announced a reduction in bond purchases as of September. The aussie is today’s worst performer, although profit taking could be as much a factor for the losses as caution ahead of the RBA meeting, following the impressive bounce back from August’s 9½-month trough.
Aside from central bank meetings, traders will also be keeping an eye on Fed speakers this week for more clues about the taper timeline.
EURUSD Gains Stumble At 1.19 Region
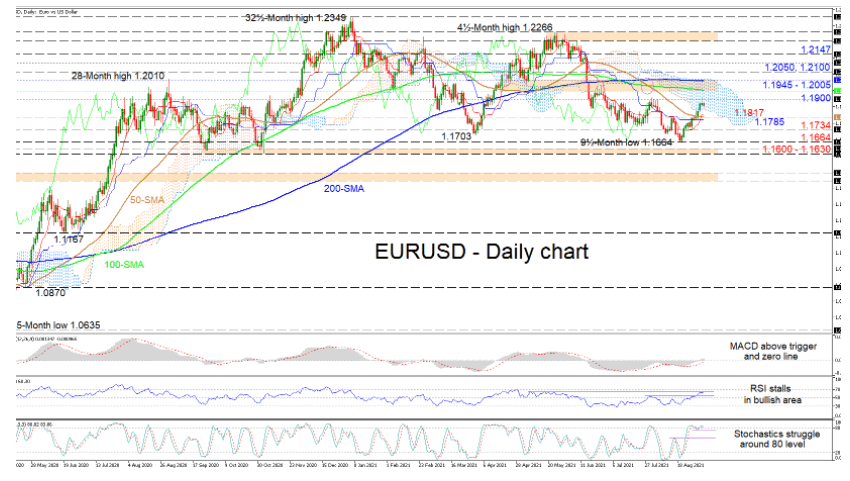
EURUSD has faltered in the vicinity of the 1.1900 handle with a minor pullback pausing positive price action, which commenced from the 9½-month low of 1.1664. The 100- and 200-day simple moving averages (SMAs) are endorsing a more neutral price tone, while the eased negative bearing of the 50-day SMA is proposing buyers are a step ahead.
The Ichimoku lines are indicating a pause in positive momentum, while the short-term oscillators are signalling buyers are fighting to maintain an advantage. The MACD is north of its red trigger line and is floating above the zero mark, while the RSI is losing its positive potency. The stochastic lines are flirting with the 80 level and have yet to confirm clear directional momentum.
If bullish forces resume and conquer the tough 1.1900 border, an early resistance zone could arise between the 100- and 200-day SMAs at 1.1945 and 1.2005 respectively. Surpassing the Ichimoku cloud may boost upside momentum inspiring buyers to possibly test the 1.2050 and 1.2100 barriers. From here, for additional gains to endure the pair would need to breach the 1.2147 high.
If selling interest intensifies, initial support could transpire in the region of the 50-day SMA, which currently resides at the 1.1800 handle. Dipping past this support section, the low of 1.1734 and the key trough of 1.1664 may come into focus. Lingering slightly beneath this trough is the support base moulded from the end of October until the beginning of November 2020 of 1.1600-1.1630, which may then try to halt negative pressures from gaining pace.
In conclusion, in order for EURUSD to reinstate a stronger positive tone in the short-term timeframe, the price would need to breach the 1.1900 mark and conquer the 1.2000 hurdle.
Gold Bumps On The 1,835 Wall, Bullish Phase Still On The Wires
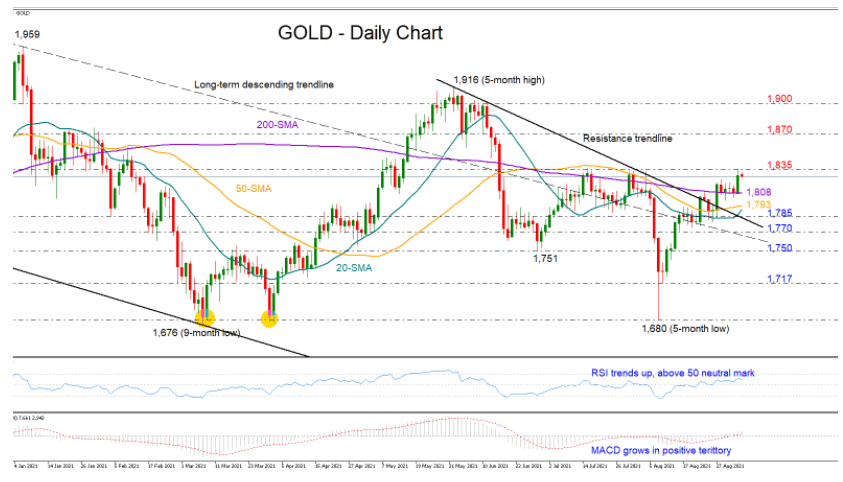
Gold bulls saw their efforts falling apart around the tough resistance of 1,835 on Friday despite setting a solid foothold around the 200-day simple moving average (SMA).
The battle, however, is not over yet and the precious metal could make more attempts for an upside breakout beyond that ceiling as long as the RSI continues to trend upwards above its 50 neutral mark. The positive momentum in the MACD, which is comfortably growing above its signal and zero lines for the first time since April is adding to this narrative.
A sustainable move above the 1,835 bar could push for a close above the 1,870 restrictive region, though for an outlook switch in the short-term picture, the bulls will need to escape the 1,900 – 1,916 wall. Then, the next milestone on the road will be the 1,959 peak, a break of which is required to disconnect the long-term downtrend from the top of 2,079.
On the downside, the 200-day SMA may keep balancing selling pressures around 1,808, while within breathing distance, the broken descending trendline could adopt a protective role within the 1,793 – 1,784 region along with the 20- and 50-day SMAs. If the bears persist, the focus will shift to the 1,750 level, unless the dashed long-term restrictive line comes to the rescue. Diving deeper, some consolidation could take place around 1,717 before all the attention turns to the 1,680 bottom. Failure to hold above the latter would bring long-term bears back into play.
Summarizing, Friday’s bullish phase is still looking in progress despite today’s muted start. A decisive step above 1,835 is expected to unleash the next buying wave.
EUR/NZD Trades In Narrow Channel
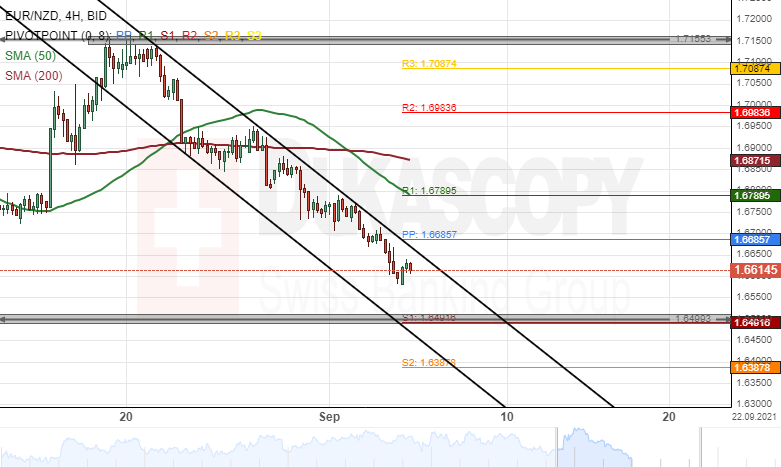
During last week's trading sessions, the Eurozone single currency fell by 1.65% against the New Zealand Dollar. The currency pair is currently trading in a narrow descending channel pattern.
Technical indicators suggest selling signals on the 4H and daily time-frame charts. Most likely, the exchange rate could continue to trend lower during the following trading sessions.
However, the EUR/NZD currency exchange rate could encounter support near the 1.6500 level this week.
AUD/NZD Bounces Off Support
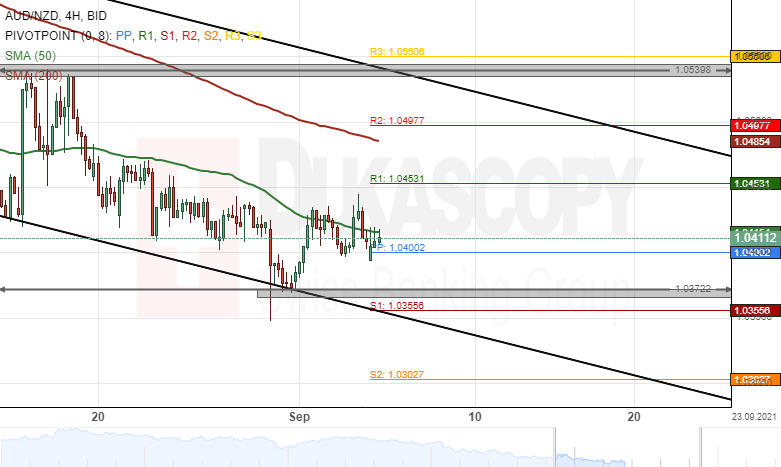
The AUD/NZD currency pair bounced off the lower boundary of a descending channel pattern at 1.0372 on August 30. As a result, the Australian Dollar surged by 0.67% against the New Zealand Dollar during last week's trading sessions.
All things being equal, the exchange rate could edge higher during this week's trading sessions. The potential target for bullish traders would be near the 1.052 area.
However, the 50– period simple moving average at 1.0415 might provide resistance for the currency exchange rate this week.
EUR/USD Outlook: Euro Eases From One-Month High, But More Evidence Is Needed To Signal Reversal
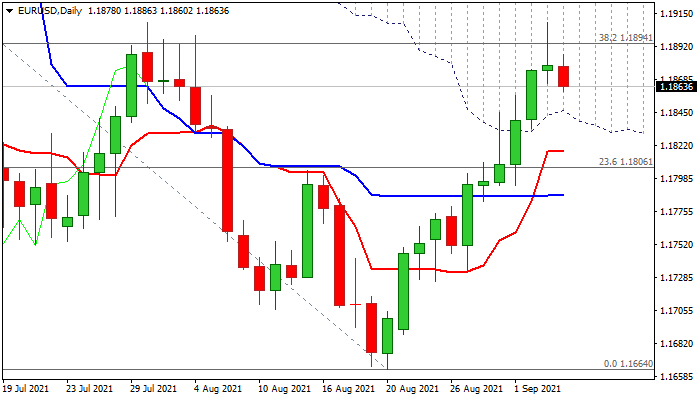
The Euro starts the week in negative mode and signaling correction after strong rally in past two weeks, as the dollar regained traction following a big US non-farm payrolls miss that fades Fed tapering expectations.
Last Friday’s Doji candle with long upper shadow generated an initial signal of rally’s stall, with rejection above Fibo 38.2% of 1.2266/1.1664 fall, warning of bull-trap pattern and adding to bearish signals.
Daily techs are mixed as positive momentum continues to rise and MA’s (5,10,20,30,55) are in bullish setup, but RSI turned south and stochastic is about to reverse from overbought territory. Traders look for cautious shorts with tight stops as fresh bears face strong supports at 1.1839 (daily cloud base) and 1.1815 (Fibo 38.2% of 1.1665/1.1909 upleg, reinforced by converging 10/55DMA’s).
Firm break of these supports is needed to weaken near-term structure and signal deeper correction, but dips might be limited as investors focus on ECB policy meeting later this week for more information about tapering expectations.
Res: 1.1894, 1.1909, 1.1950, 1.1975.
Sup: 1.1851, 1.1839, 1.1815, 1.1787.
EUR/USD Analysis: Broke Pattern
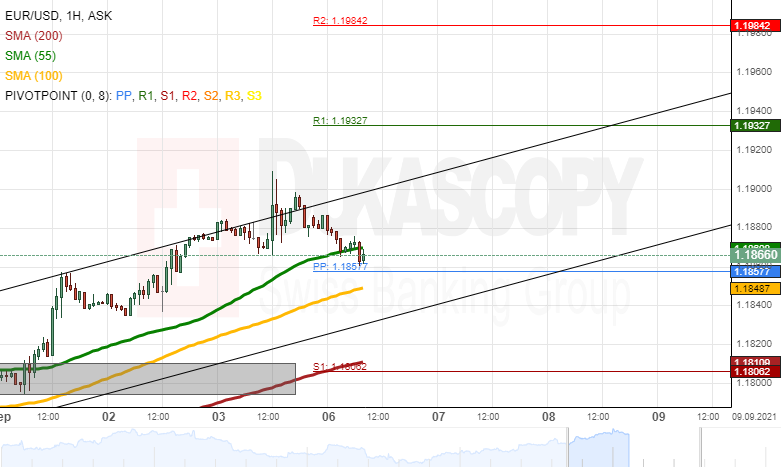
The release of US monthly employment data on Friday caused an increase of volatility, which broke the channel up pattern that guided the rate since August 19. Afterwards, the rate began a decline. On Monday morning, the currency exchange rate's decline passed the support of the 55-hour simple moving average. In the near term future, the rate was expected to look for support in the combination of the weekly simple pivot point and the 100-hour simple moving average at 1.1858 and 1.1848. Moreover, the 1.1850 level could provide support.
In the case that the rate recovers from the mentioned support levels, the rate would surge. A potential surge most likely would test the resistance of the 1.1900 and afterwards the weekly R1 simple pivot point at 1.1933.
However, a decline of the EUR/USD currency exchange rate below the 1.1850 level could look for support in the 200-hour simple moving average and the weekly S1 simple pivot point at 1.1810 and 1.1806.
GBP/USD Analysis: Respects Pattern
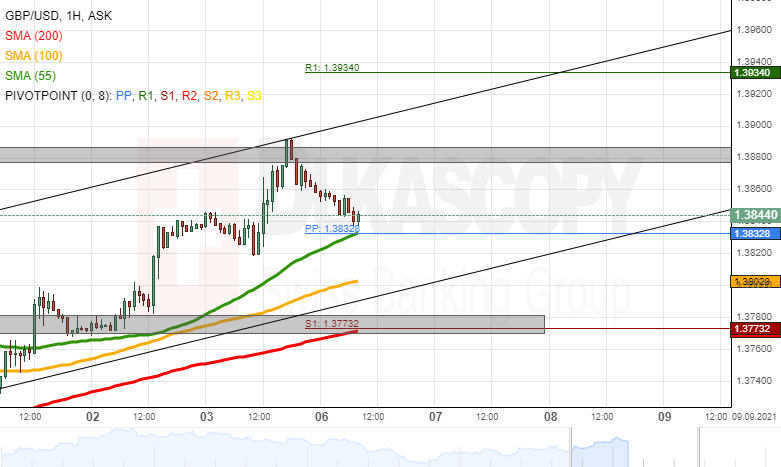
The release of worse than expected US employment data caused a surge of the GBP/USD on Friday. The surge was stopped by the upper trend line of the channel up pattern, which has guided the rate since the middle of August. The event was followed up by a decline.
On Monday morning, the decline was heading for the combined support of the weekly simple pivot point and the 55-hour simple moving average at 1.3833.
In the case that the rate recovers from the pivot point and the 55-hour SMA, the GBP/USD could surge. A potential surge would most likely test the August high levels near the 1.3880 level. Above the 1.3880 level, the 1.3900 might provide resistance before the pair aims at the weekly R1 simple pivot point at 1.3934.
On the other hand, a decline of the pair below the 1.3830 level could look for support in the 1.3800 level and the 100-hour simple moving average. Below the 1.3800 mark, the lower trend line of the channel up pattern might hold the rate up.