Sample Category Title
Oil’s Momentum Fades
Oil prices fell overnight as the International Energy Agency did an about-face from last month and lowered its global consumption forecasts. The main driver, of course, has been the lightning-fast spread of the delta-variant virus across the globe.
Brent crude fell by 0.60% to $71.15 a barrel, and WTI fell by 0.62% to $68.80. Asia has continued pushing oil lower, spurred by the small but persistent spread of Covid-19 cases across China, with fears of mass lockdowns. Also, the partial closure of its two busiest ports as part of virus containment measures. Brent crude has fallen 0.50% to $70.80, WTI by 0.52% to $68.55 a barrel.
With the respective relative strength indexes (RSIs) back into neutral territory from oversold, the technical picture now swings back to negative for both contracts. Notably, Brent crude and WTI have failed ahead of resistance at $72.00 and $70.00 a barrel, respectively. Brent crude is in danger of breaking nearby support at $70.70 a barrel, signalling further losses to its 100-DMA at $70.15 initially and possibly $69.00 a barrel. Similarly, WTI is in danger of giving up nearby support at $68.50 a barrel and testing its 100-DMA at $67.60, potentially extending to $66.60 a barrel.
Continued US Dollar strength won't help oil's cause either, but the sudden about-face by the IEA has shaken nerves and capped the oil rally, bringing home the reality of the impact of the delta-variant. China concerns will continue to cap oil prices until New York arrives, and if the situation there worsens over the weekend, or Monday's data is soft, oil could well be in for a torrid start next week.
The US Dollar Rebounds On Firm PPI
The US Dollar resumed its rally overnight after a slight correction lower the day before. Above expectation, PPI numbers had the taper-talk running hot again, enough to support US yields and see the dollar index climb 0.11% to 93.00 overnight. The 92.60 and 93.20 levels remain the key near-term support/resistance levels to watch.
Overnight, EUR/USD edged lower to 1.1735, rising to 1.1738 this morning but remaining within its recent 1.1700 to 1.1750 trading range. However, the night’s big loser was GBP/USD, which fell 0.42% to 1.3808 before settling at 1.3814 today. That fall came despite better than forecast UK GDP data overnight, with perhaps the slowing Industrial Production and Manufacturing and Construction Output to blame. That triggered some quite heavy EUR/GBP buying, by the looks of it, pushing GBP/USD lower. The technical picture has swung negative now after GBP/USD failed to recapture 1.3900 this week. GBP/USD is now in danger of breaking nearby support at 1.3800 and 1.3777, the 200-day moving average. (DMA) A weekly close below the 200-DMA would signal a deeper decline to the 1.3600 area.
The USD/CNY is holding steady once again in Asia at 6.4775, but other regional currencies, having held their own overnight, have resumed their decline today. As the Kospi falls, USD/KRW has risen by 0.70%, suggesting foreigner selling ahead of the weekend. The government’s virus warnings ahead of the long weekend seem to be playing their part. USD/THB has risen 0.60% to 33.282 and given its poor run of data and virus situation, cases hitting a second consecutive daily high. Traders appear to be reducing exposure ahead of the weekend.
USD/PHP and USD/TWD are both 0.15% higher, while USD/SGD, USD/MYR and USD/IDR are slightly higher but steady at 1.3585, 4.2350, and 14,386.00, respectively. Investors appear to be preferring the safety of the greenback into the weekend, with China and virus nerves spurring a hunt for safer waters.
I expect US Dollar strength to persist into the end of the week and continue into next week as the Fed tapering bells continue ever louder and the world continues to price in diverging monetary policy.
Asian Equities Are Trade Heavy
Asian equities are enduring a mostly negative day, despite a modestly positive overnight lead from Wall Street. Overnight, the rally continued Wall Street, with the S&P 500 rising by 0.29%. The Nasdaq climbed 0.35%, while the Dow Jones finished just 0.04% higher following a mixed set of earnings releases in the US, and overall volumes lower than average. US futures are unchanged in Asia as of midday.
The Nikkei 225 is just 0.06% higher, but the Kospi has fallen by 1.43%. The Kospi has been led lower by heavy selling of Samsung shares as the Vice-Chairman is released from prison today. Additionally, some nerves over the virus and China appear to be affecting sentiment, as has been government guidance asking people not to travel this long weekend to dampen Covid-19 exposure, with cases in South Korea still climbing.
Government virus containment measures across China, notably at Shanghai and Ningbo ports, and the now ever-present threat of government regulatory action, especially after this week’s five-year plan release, are weighing on China equity markets today. The Shanghai Composite and CSI 300 are 0.25% lower, and I suspect China’s “national team” may be doing a bit of weekend “smoothing.” That is because Hong Kong, home to many of China’s tech-heavyweight listings, has fallen 0.90% today, having been quite a bit lower earlier in the session.
Singapore has fallen 0.70% with its high beta to China, being led lower by the big local banks. Likewise, Taipei has also fallen by a hefty 0.85%. Kuala Lumpur is just 0.05% lower after Q2 GDP flattered to deceive, with Bangkok down 0.30% and Manila lower by 0.40%. Australian markets are bucking the trend as commodity prices remain firm and local markets continue to focus on the Wall Street rally. At the same time, ignoring the ever-expanding regional virus lockdowns, which also enveloped Canberra yesterday. The ASX 200 has risen by 0.50%, while the All Ordinaries is 0.40% higher, capping off a pretty good week for Australian equities.
European markets may have some background China nerves. Still, a quiet data calendar should see them follow Wall Street higher this afternoon, with the US and Europe assessing Asia’s travails as a local problem and not a global threat at this stage.
The Analytical Overview Of The Main Currency Pairs
The EUR/USD currency pair
Technical indicators of the currency pair:
Prev Open: 1.1738
Prev Close: 1.1730
% chg. over the last day: -0.07%
European industrial production fell by 0.3%, in line with analysts' forecasts. Given the slight strengthening of the dollar index, the European currency was unable to rebound from price lows.
Trading recommendations
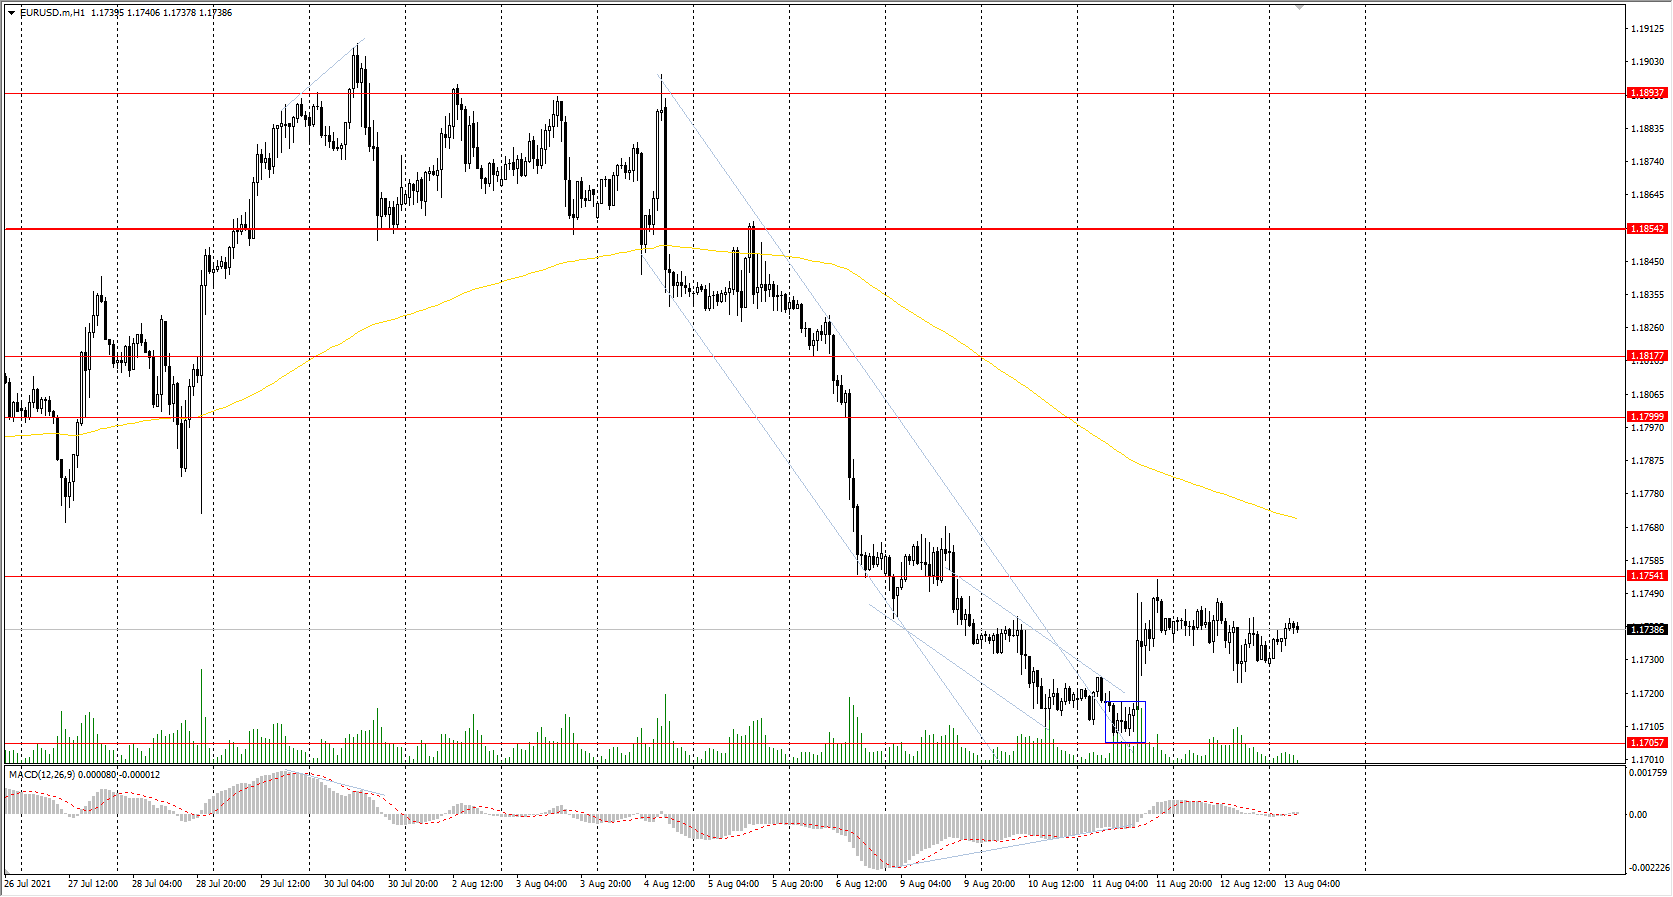
Support levels: 1.1706, 1.1609
Resistance levels: 1.1754, 1.1799, 1.1817, 1.1854, 1.1894, 1.1934, 1.1969
From a technical point of view, the general trend on the EUR/USD currency pair is bearish. The price is about to consolidate in a narrow price range. Under such market conditions, it is best to look for the sell trades from the resistance levels near the moving average. Buy trades can only be considered throughout the day from the zone where the buyers showed initiative.
Alternative scenario: if the price breaks through the 1.1854 resistance level and fixes above, the mid-term uptrend will likely resume.
News feed for 2021.08.13:
- US Prelim Michigan Consumer Sentiment at 17:00 (GMT+3).
The GBP/USD currency pair
Technical indicators of the currency pair:
Prev Open: 1.3863
Prev Close: 1.3806
% chg. over the last day: -0.41%
The UK GDP increased by 4.8% (on a year-on-year basis) in the second quarter, but it’s still below the pre-pandemic levels. Industrial Production is 8.3%, which is below economists' expectations. Manufacturing Production has also declined. The statistics came out to be negative, which caused the fall of the GBP/USD quotes.
Trading recommendations
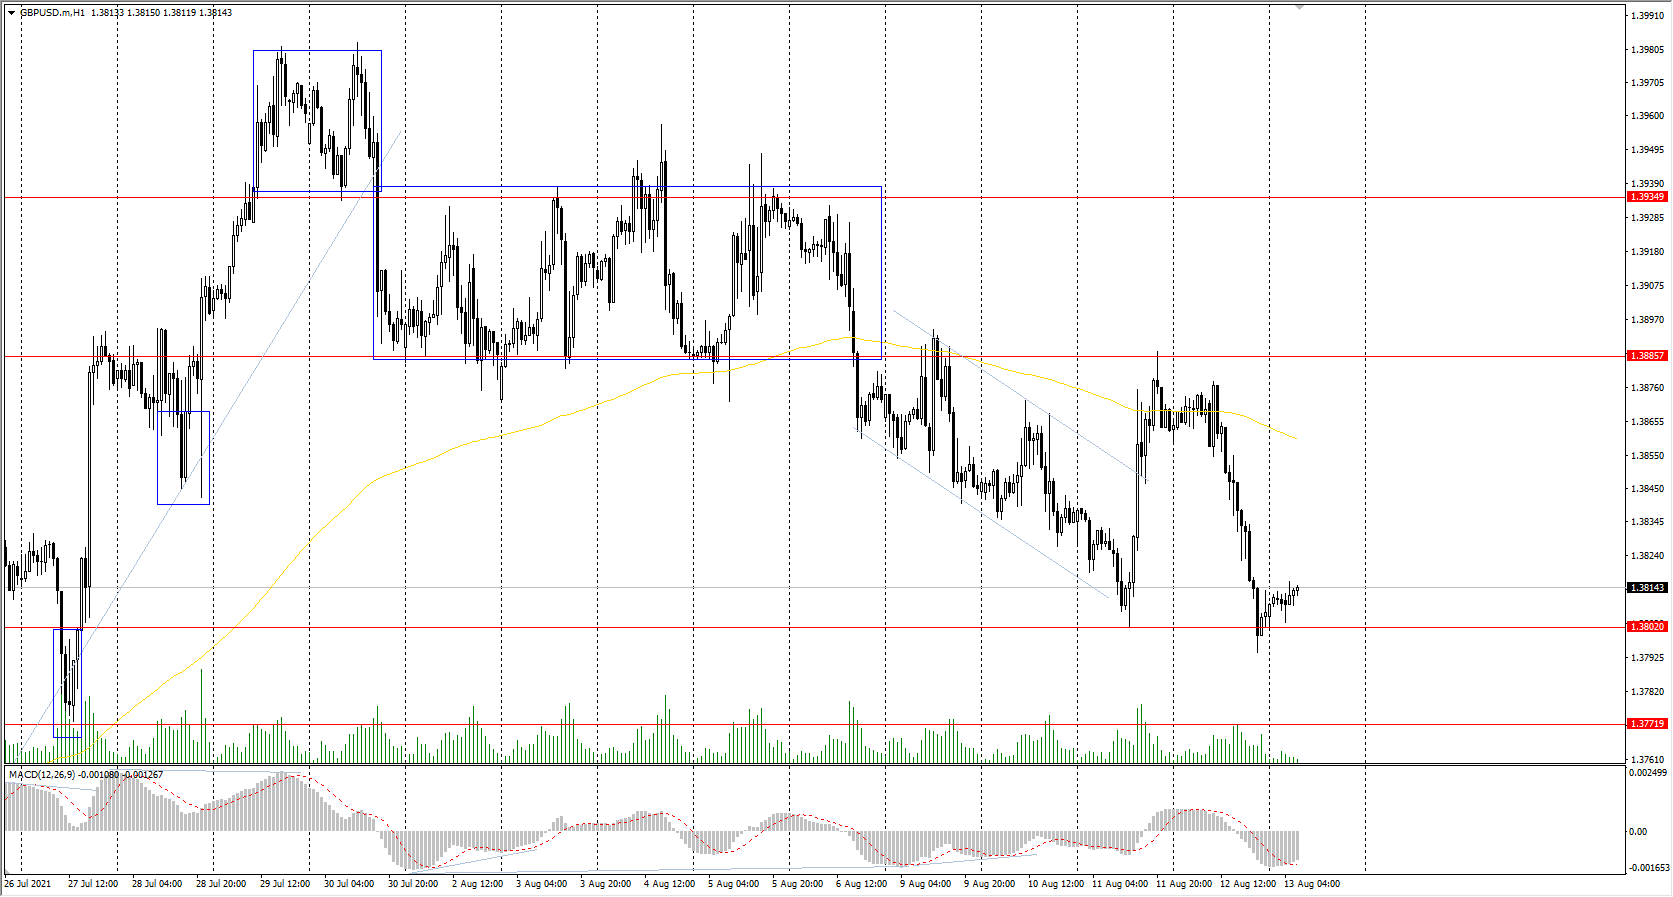
Support levels: 1.3802, 1.3772, 1.3714, 1.3676 ,1.3641, 1.3614, 1.3525
Resistance levels: 1.3886, 1.3935, 1.4002, 1.4075, 1.4101
The trend of the GBP/USD currency pair is bullish on the hourly time frame. Yesterday, the price rebounded from the resistance level and returned to the support level, where buyers showed initiative. The MACD indicator has become inactive. Under such market conditions, traders are better to look for the buy trades from the zone where the buyers took the initiative. Sell positions can be considered from the resistance levels and only on intraday time frames.
Alternative scenario: if the price breaks through the 1.3714 support level and consolidates below, the bearish scenario is likely to resume.
The USD/JPY currency pair
Technical indicators of the currency pair:
Prev Open: 110.38
Prev Close: 110.43
% chg. over the last day: +0.05%
The USD/JPY currency pair is trading in a narrow price range. The Japanese Yen is highly dependent on the dynamics of the dollar index now, so to predict the fundamentals aspect, traders need to focus more on the economic indicators of the USA rather than Japan.
Trading recommendations
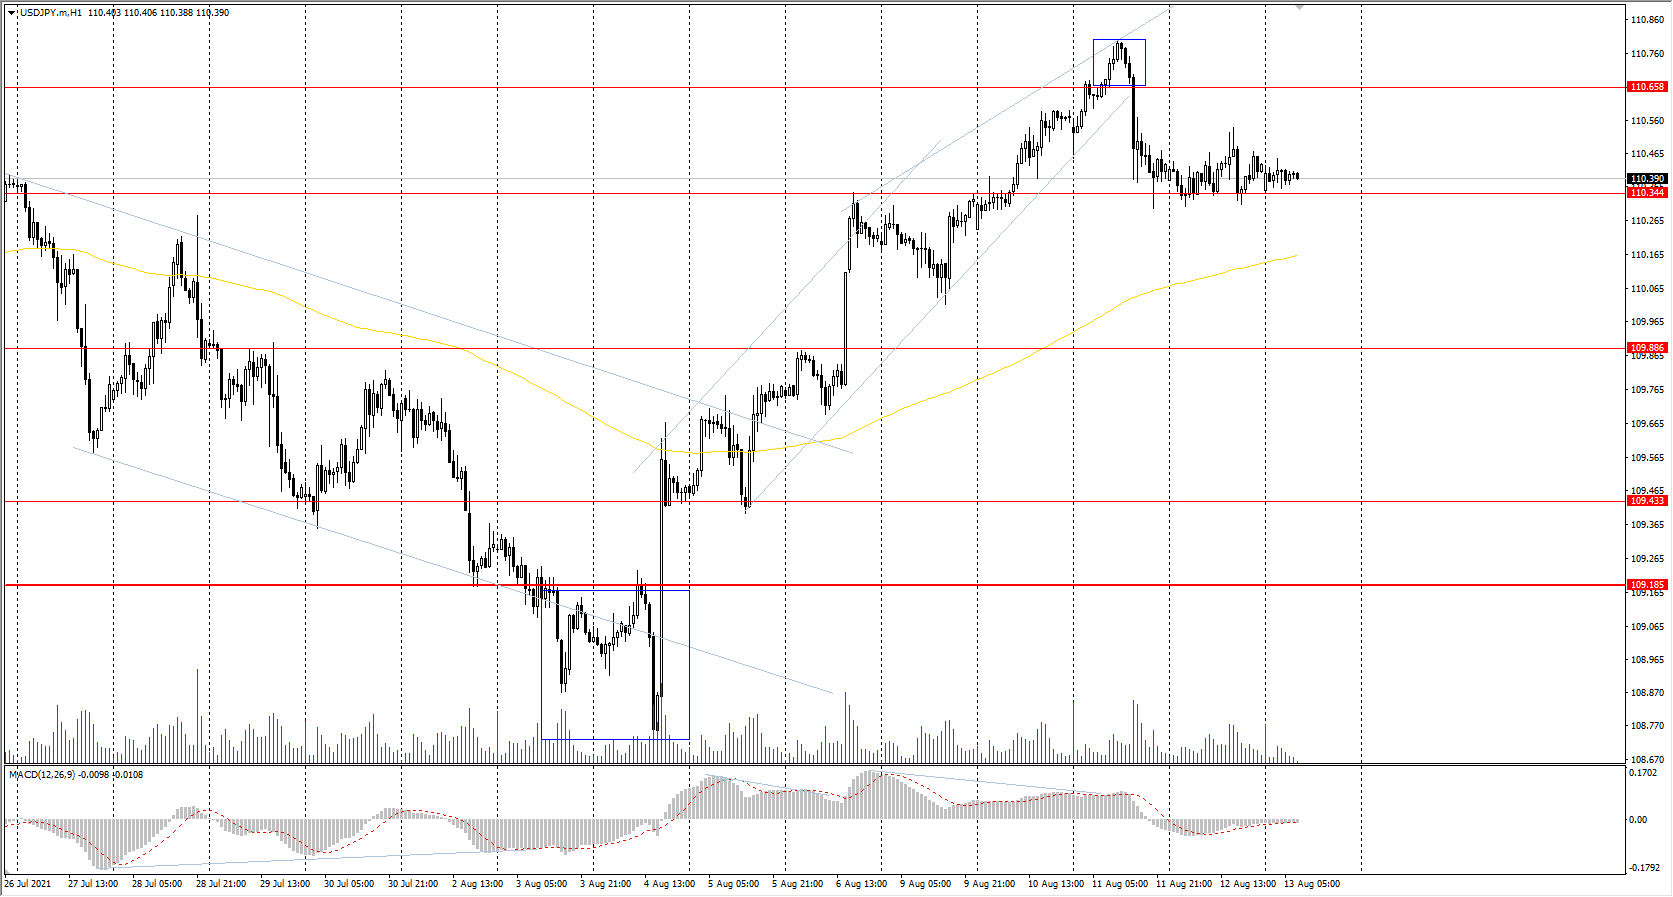
Support levels: 110.34, 109.88, 109.43, 109.19, 108.65
Resistance levels: 110.66, 110.95, 111.48
The main trend on the USD/JPY currency pair is bullish. The price is trading above the moving average, and the MACD indicator has become inactive. Under such market conditions, it is better to look for the buy positions from the support level near the moving average. Sell positions should be considered only on the lower time frames from the zone where the sellers showed initiative.
Alternative scenario: if the price falls below 109.19, the uptrend is likely to be broken.
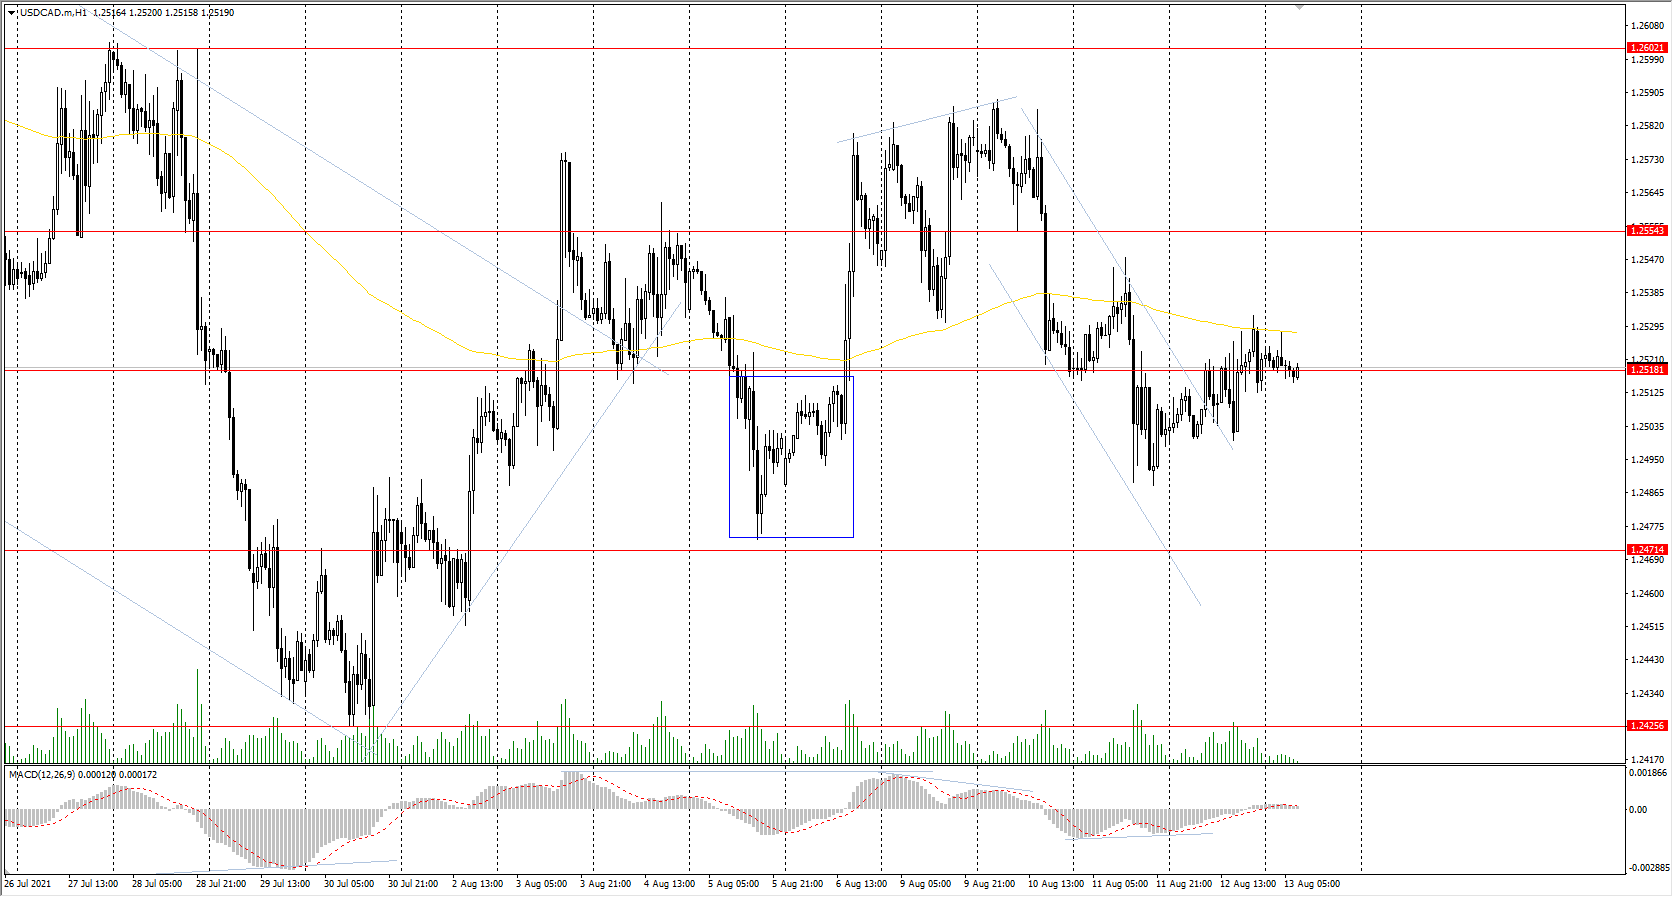
The USD/CAD currency pair
Technical indicators of the currency pair:
Prev Open: 1.2502
Prev Close: 1.2521
% chg. over the last day: +0.15%
The Canadian dollar is highly dependent on the performance of the dollar index and oil price performance. Yesterday, the oil price was almost unchanged, while the dollar index slightly strengthened. As a result, the currency pair USD/CAD increased by 0.15%.
Trading recommendations
Support levels: 1.2471, 1.2425, 1.2370, 1.2312
Resistance levels: 1.2518, 1.2554, 1.2602, 1.2671, 1.2787, 1.2951
Considering technical analysis, the USD/CAD trend is bearish. The price went below the moving average, and the MACD indicator became inactive. Under such market conditions, it is better to look for the sell positions from the resistance levels. Traders should consider the buy positions from the support levels and only on intraday time frames.
Alternative scenario: if the price breaks through the 1.2671 resistance level and fixes above, the uptrend is likely to be resumed.
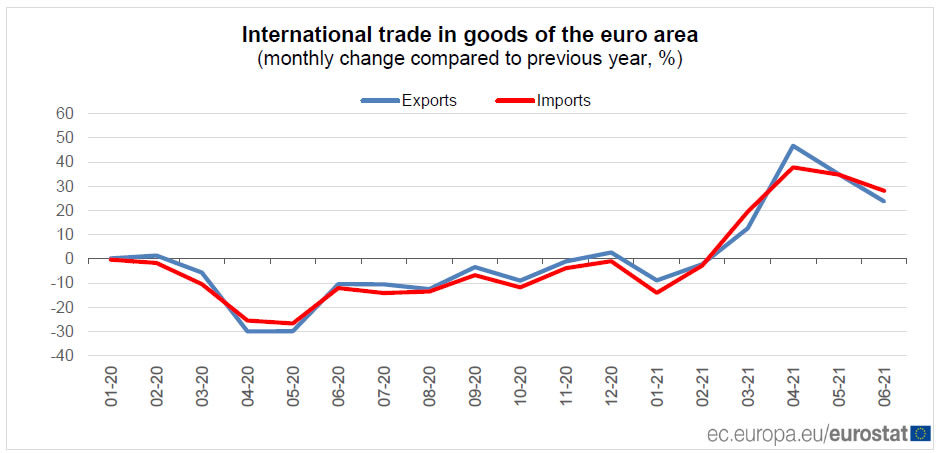
Eurozone exports rose 23.8% yoy in Jun, imports rose 28.2% yoy
Eurozone exports to the rest of the world rose 23.8% yoy to EUR 209.9B in June. Imports from the reset of the world rose 28.2% yoy to EUR 191.8B. As a result, Eurozone record a EUR 18.1B surplus, comparing to EUR 20.0B a year ago. Intra-Eurozone trade rose 24.6% yoy to EUR 188.0B.
In seasonally adjusted terms, Eurozone exports dropped -0.1% mom to EUR 197.7B. Imports was nearly unchanged at EUR 185.3B. Trade surplus narrowed to EUR 12.4B, down from EUR 13.8B, above expectation of EUR 9.3B.
Inflation In The United States Slows Down. The Fed Will Not Reduce The Quantitative Easing Program
Last week the number of new jobless claims was 375,000 (previously 387,000) in the US. The labor market is slowly recovering. In July, the US producer price index increased more than expected as high inflation and strong demand, driven by the economic recovery, continue to damage supply chains. The producer price index increased by 7.8% within the last 12 months; this is the highest value since 2010. The US stock market ended Thursday's trading in growth due to strengthening health care, technology, and consumer goods sectors. The Dow Jones and S&am;P 500 reached new all-time highs for the third session in a row. Inflation data remains the main leverage of the US Federal Reserve now. Although inflation in the United States has slowed down, the Fed will not reduce the quantitative easing (QE) program. Therefore, the major US indices are likely to continue rising until the next inflation statistics.
European stock indices were trading without a single trend yesterday. German DAX jumped by 0.7%, French CAC 40 increased by 0.36%, Italian FTSE MIB added 0.38%, and Spanish IBEX 35 remained at the same level. At the same time, the British FTSE 100 decreased by 0.37%. The main reason for the decline of the British index was the negative statistics on industrial production. Strong corporate reporting from European companies still compensates investors' concerns about the spread of the Delta strain.
Gold prices increased in the US trading session yesterday. It is important to keep an eye on US government bond yields to predict gold prices. As long as the US Federal Reserve keeps printing money, this fundamental picture plays in favor of rising precious metals prices. But do not expect a strong rise, as gold does not have the same protective asset value now as it did before.
The International Energy Agency (IEA) lowered its forecast on global demand for the commodity this year. Demand for oil in China (the largest consumer of fuel) is declining due to restrictions. After the news, oil prices slightly decreased yesterday.
Most Asian stock indices continue to ignore record highs in the US stock market. The broadest index of Asia-Pacific stocks outside of Japan, the MSCI, decreased by 0.59%, Japan's Nikkei 225 fell by 0.6%, and China's CSI300 decreased by 0.21%. However, Australia's ASX 200 index increased by 0.53% to a new record due to the growth of medical and technological companies. In Korea, shares of Samsung Electronics fell to a seven-month low due to concerns about lower revenue for the next quarter.
Main market quotes:
- S&P 500 (F) 4,460.83 +13.13 (+0.30%)
- Dow Jones 35,499.85 +14.88 (+0.04%)
- DAX 15,937.51 +111.42 (+0.70%)
- FTSE 100 7,193.23 -26.91 (-0.37%)
- USD Index 93.01 +0.09 (+0.10%)
Important events for today:
- US Prelim Michigan Consumer Sentiment at 17:00 (GMT+3).
GBPJPY Fails To Overcome 153.40, Neutral-To-Bearish Bias
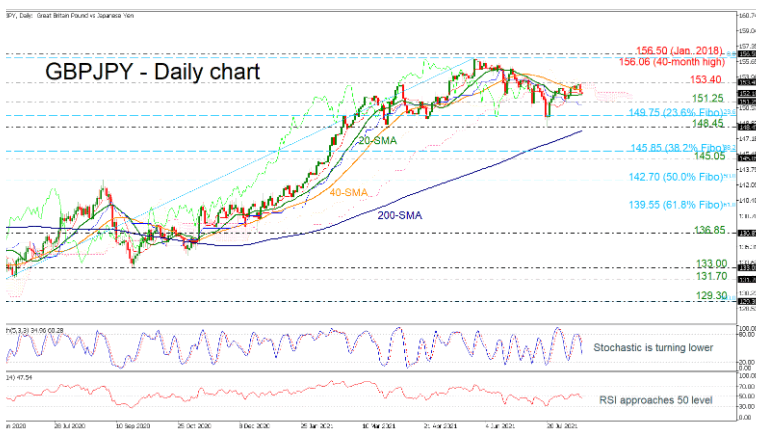
GBPJPY attempted to break the upper border of the neutral zone it has been ranging within this week, but its efforts proved unsuccessful as the 153.40 barrier defended the bears once again.
The short-term oscillators are also in favor of the bears; the RSI is moving sideways near its 50 neutral mark and the stochastic oscillator is approaching the oversold territory after the bearish cross within the %K and %D lines.
Hence, the short-run risk is looking neutral-to-negative at the moment and another retest of 151.25 is possible. A fall below the latter could open the way for the 23.6% Fibonacci retracement level of the up leg from 129.30 to 156.06 at 149.75 ahead of the 148.45 support, which stands near the 200-day SMA.
To the upside, the 153.40 nearby resistance area may add some footing to the market, but a violation at this point may not attract much attention unless the price rallies above the 40-month high of 156.06 and the 156.50 barrier, registered in January 2018.
In brief, GBPJPY could trade neutral-to-negative in the short-term. A close below the 200-day SMA could bring fresh selling pressure in the market, while a jump above the 156.06 level could raise buying interest.
China’s Market Has Further Room To Fall
Asian markets remain under pressure on Friday, despite the highs of the US markets and a brisk strengthening of European indices. Hong Kong’s Hang Seng lost 0.5%, and the China A50 blue-chip index was down 0.2%. At the same time, Japan’s Nikkei is down 0.6%, and Korea’s Kospi is down 1.4%.
However, this slight decline in China today should not be misleading. Chinese indices sharply retraced their decline earlier in the week, failing to develop a rebound after drop since May’s peak. The fear of continuing regulatory pressure in China gives investors little reason to buy cheaper shares.
Earlier, the buying impulse in Chinese equities was on assurances from the authorities that there is no systemic crisis. However, the officials did not go further: there was no meaningful policy reversal, and we saw new signs of pressure on private companies - now from the semiconductor sector. Fines, antitrust investigations, and restrictions remain a relevant threat hanging over China and are dragging down related markets overseas.
We have previously seen China put severe negative pressure on its markets. Then, in 2015, a booming influx of retail investors into local markets created a strong growth momentum. It was largely margin buying, increasing risk in the financial system, which prompted the government to tighten regulations, including foreign investors who suffered from a managed depreciation of the renminbi.
At some time, the sell-off in local markets threatened financial stability, prompting regulators to soften positions. In the nine months from May 2015 to February 2016, the China A50 lost more than 43%, and the Hang Seng was down 37%.
The current pressure on the indices has taken about half as much away, returning indices to late 2020 levels, although we have seen falls of over 90% in individual stocks.
The technical picture also suggests considerable room for further declines in the coming months. The long-term charts clearly show how political interventions (regulatory pressure in 2015 and trade wars in 2018) turn the indices towards the lower end of a broad trading range. And at its lower end, politicians are already making a truly bold effort to stabilize the market.
Unfortunately, we are not there yet. The lower boundary of this channel for the Hang Seng passes through 22000 by the end of the year versus the current 26200. In China A50, the global support line passes through 13300 against the current 15700. In both cases, the potential for a further drop of about 15% remains.
Statistics from China also continue to point to a slowdown. Loan volume has maintained a downward trend since the start of the year, and the latest figures have fallen short of expectations. The M2 money supply growth rate has fallen to its lowest in 2018-2019, barely exceeding 8% y/y.
And this potential is something investors should keep in mind when trying to assess whether Chinese equities have fallen sufficiently in price to become attractive for a discounted purchase.
There has been speculation in the press that the People’s Bank of China is set to ease credit conditions to maintain growth momentum. However, investors in the markets should remember that it will take months for the easing from the central bank to influence the economy. In addition, as we have seen so far, it is not sufficient to get the sustained interest of buyers back on track.
Buying Chinese indices right now seems premature until we see an apparent reversal in the policy of Politburo.
USDCAD Stuck In Narrow Range Below SMAs
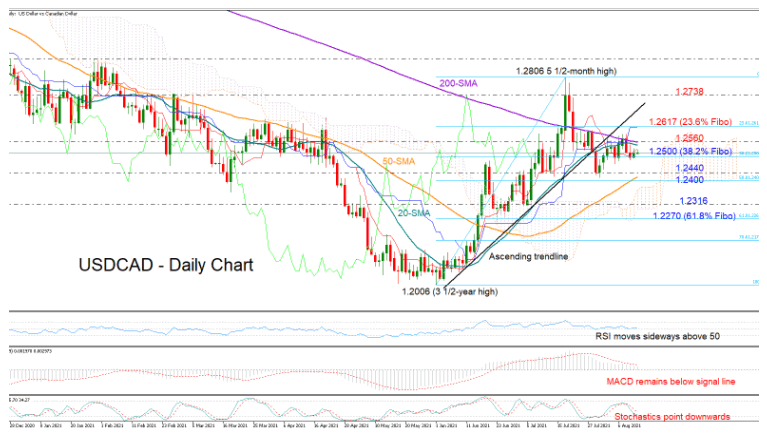
USDCAD could barely rotate since the rejection near the 20- and 200-day simple moving averages (SMAs) on Monday, with the price edging up to close slightly above the 1.2500 level on Thursday.
The momentum indicators point to a neutral-to-bearish bias as the RSI, although above its 50 neutral mark, is lacking direction, while the MACD and the Stochastics continue to slope downwards. The latest bearish deviation between the red Tenkan-sen and Kijun-sen lines is further reducing the case for a meaningful rebound.
In trend indicators, signals are mixed. The 20-day SMA is set to reverse south after failing to cross above the 200-day SMA. On the other hand, the gap between the 50- and 200-day SMAs continues to narrow, raising some optimism that the rebound from the 3 ½-year high of 1.2006 could resume above 1.2806 despite the break below the trendline.
If the price proves unable to breach the wall near 1.2560, and instead slips below the 38.2% Fibonacci retracement of the latest upleg, which has been supporting the market around 1.2500 for more than a week now, the focus will shift back to the 1.2440 support area and the 50-day SMA. Should sellers dominate below the 50% Fibonacci of 1.2400, the pair could plunge towards the 1.2316 – 1.2260 zone.
Alternatively, if the bullish scenario prevails, with the price crawling above the 1.2560 resistance region, some consolidation could take place around the 23.6% Fibonacci of 1.2617 and the blue Kijun-sen line. Above this border, the bulls may attempt to overcome the broken ascending trendline and climb up to the 1.2738 barrier.
All in all, the short-term bias is looking neutral-to-bearish for USDCAD. A bounce above 1.2650 could recover some buying interest, while a drop below 1.2440, and particularly a close under 1.2400, could give the lead to the bears.
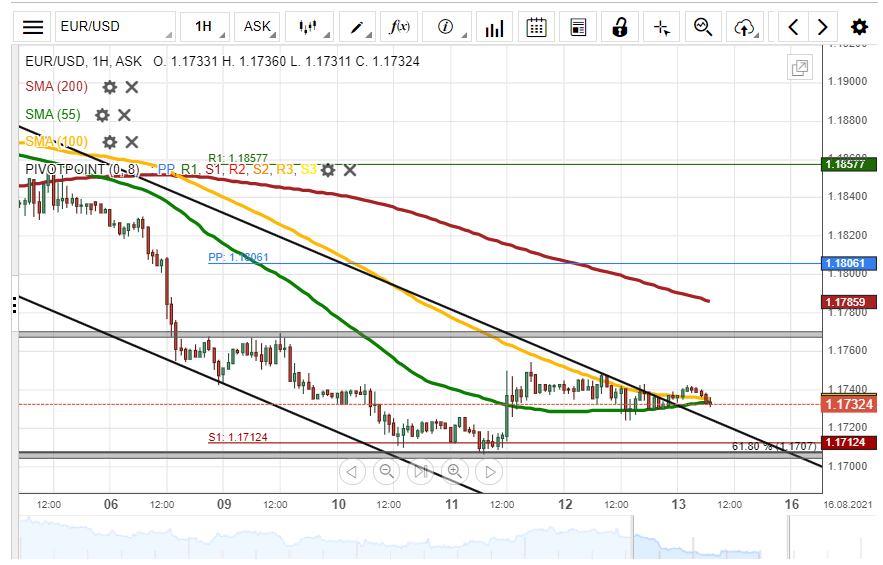
EUR/USD Breached Channel Pattern
The common European currency has edged higher by 41 pips or 0.35% against the US Dollar since this week's trading sessions. The currency pair breached the 55- and 100- hour SMAs this week.
By and large, the exchange rate could end this week on a decline. Though, given that the EUR/USD pair has breached the upper line of a descending channel pattern, buyers might pressure the price higher during the following trading session.
However, the resistance level at 1.1770 could still provide resistance for the currency exchange rate within this session.