

Sample Category Title
XAUUSD Is Possibly Bullish
Technical analysis
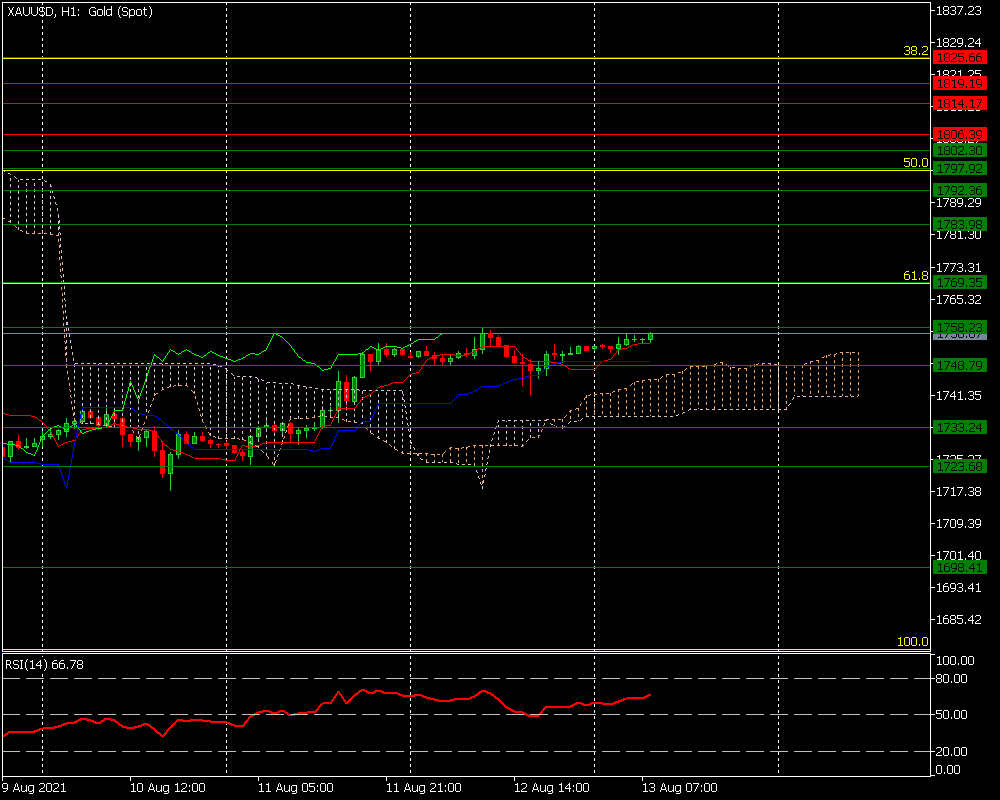
The Ichimoku indicator gives a possible bullish signal
The RSI is above line 50, indicating that an uptrend may prevail.
What the possible outcomes are
The U.S. dollar gained after reports on producer prices, jobless claims.
Gold is under pressure for its second straight weekly loss. Meanwhile, the dollar advances and concerns simmer that the Federal Reserve could soon reduce support for the U.S. economy.
In our most likely scenario, XAUUSD may attempt to break the first resistance level of 1,758.
If the pair surpasses the first resistance level, we should expect a continued surge towards the second resistance level of 1,769.
Contrarily, the pair may initially decline towards the first support level of 1,748.
If the pair falls below the first support level, we can expect a continued downtrend towards the second support level of 1,733.
Key levels
Support 1,723 1,733 1,748
Resistance 1,758 1,769
USD/CHF Daily Outlook
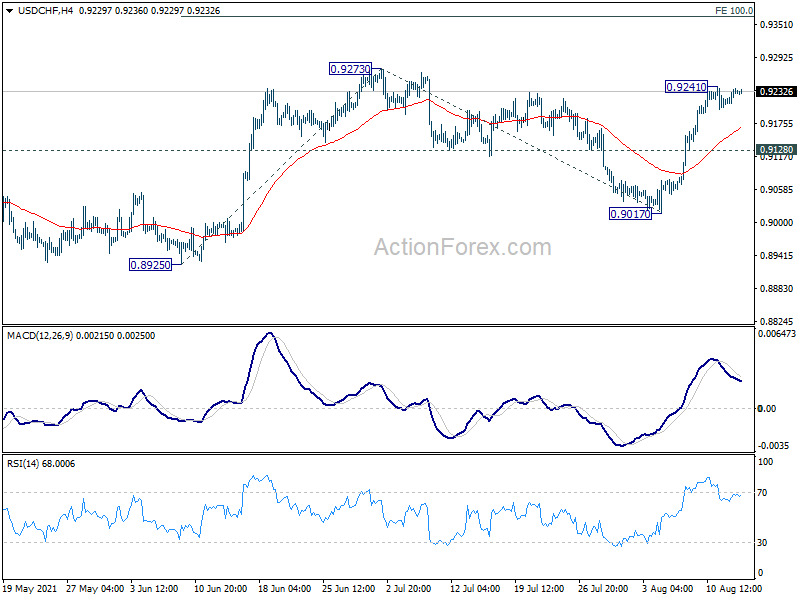
Daily Pivots: (S1) 0.9217; (P) 0.9228; (R1) 0.9245; More....
Intraday bias in USD/CHF remains neutral for consolidation below 0.9241 temporary top. Outlook is unchanged that corrective fall from 0.9273 should have completed at 0.9017. Above 0.9241 will target 0.9273 resistance. Firm break there will resume rise from 0.8925 to 100% projection of 0.8925 to 0.9273 from 0.9017 at 0.9365. However, break of 0.9128 will dampen this bullish view and turn bias back to the downside for 0.9017 support.
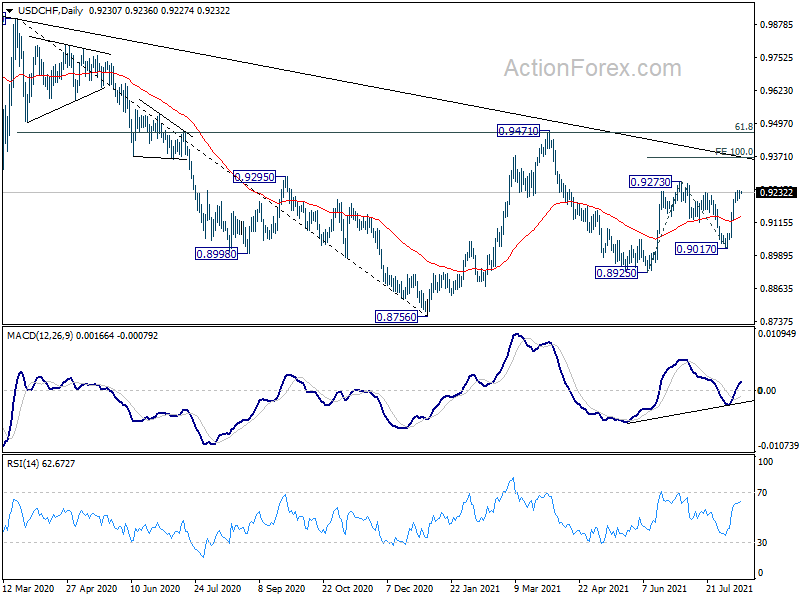
In the bigger picture, the failure to sustain above 55 week EMA (now at 0.9184) retains medium term bearish in USD/CHF. Break of 0.8925 support should resume the whole decline form 1.0342 (2016 high) through 0.8756 low. However, break of 0.9273 resistance and sustained trading above 55 week EMA will be an early sign of bullish trend reversal. Focus will then turn to 0.9471 resistance for confirmation.
USD/JPY Daily Outlook
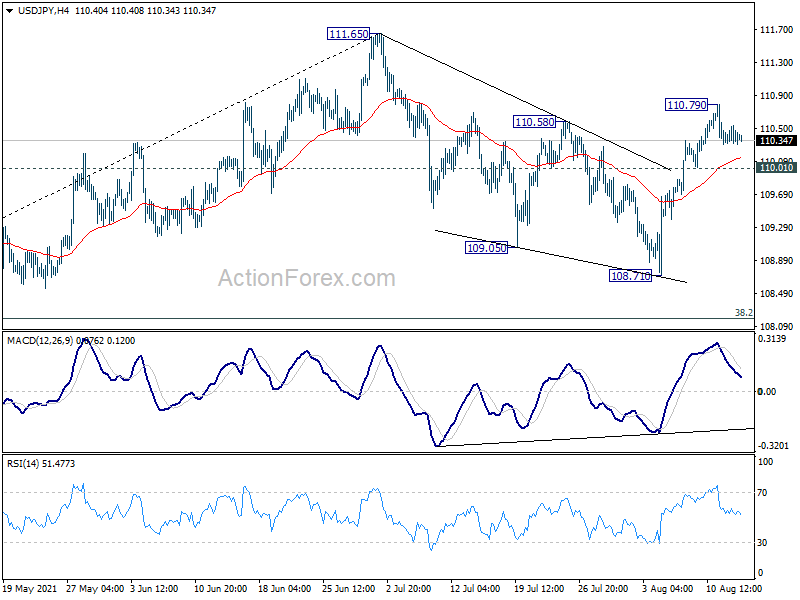
Daily Pivots: (S1) 110.32; (P) 110.43; (R1) 110.54; More...
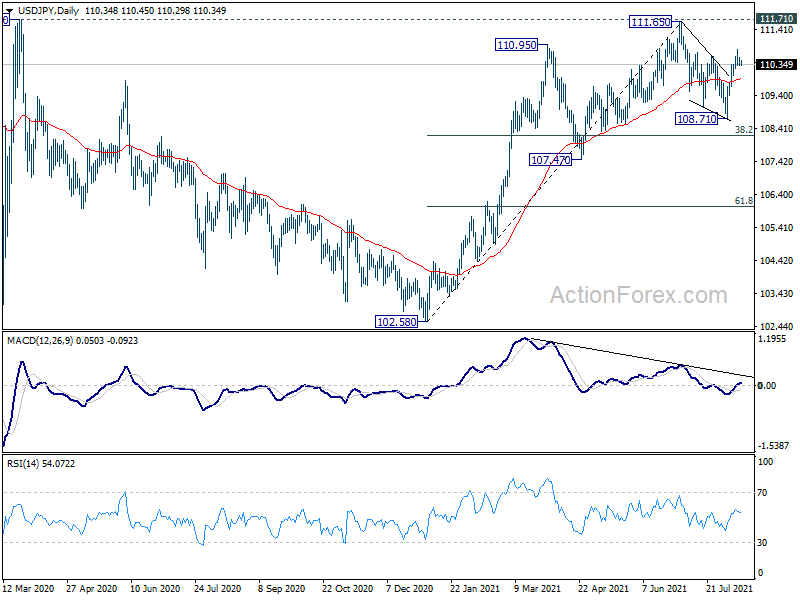
Intraday bias in USD/JPY remains neutral for consolidation below 110.79 temporary top. Outlook is unchanged that corrective fall from 111.65 should have completed with three waves down to 108.71. Another rise is in favor with 110.01 support intact. Break of 110.79 will turn bias to the upside for retesting 111.65 high. However, break of 110.01 will dampen this bullish view, and turn bias to the downside for 108.71 support.
In the bigger picture, medium term outlook is staying neutral with 111.71 resistance intact. The pattern from 101.18 could still extend with another falling leg. Sustained trading below 55 day EMA will bring deeper fall to 107.47 support and below. Nevertheless, strong break of 111.71 resistance will confirm completion of the corrective decline from 118.65 (2016 high). Further rise should then be seen to 114.54 and then 118.65 resistance.
S&P 500 Index Soars As US Growth Accelerates
US stocks continued their bullish momentum overnight after the strong US producer price index (PPI) data. The numbers showed that the American producer price index rose from 7.3% in June to 7.8% in July as companies continued facing higher costs. Core PPI rose from 5.6% to 6.2% in July. Meanwhile, the number of Americans filing for initial jobless claims declined from 387k to 375k while the continuing claims declined to more than 2.66 million. These numbers provide more evidence that the economy is doing well.
The US dollar also rose slightly after the PPI and jobless claims numbers. Meanwhile, data by the National Association of Realtors showed that home prices in the US rose in the second quarter as demand resumed. In most metro areas, median prices rose by more than 10% while single-family existing homes jumped by 22.9% to $357k. This trend has been helped by low interest rates and savings generated as more people stayed at home. Inventory for homes declined as potential sellers delayed their plans to move.
The economic calendar will have no major events today. In Switzerland, the statistics agency will publish the latest producer price index (PPI) data while in Germany, the agency will release the wholesale price index. The Swedish statistics agency will release the latest inflation data. While these numbers are important, they will likely lead to minimal volatility. Meanwhile, stock traders will react to earnings from companies like Rocket Companies, 23andMe, and Ubiquiti.
SP500
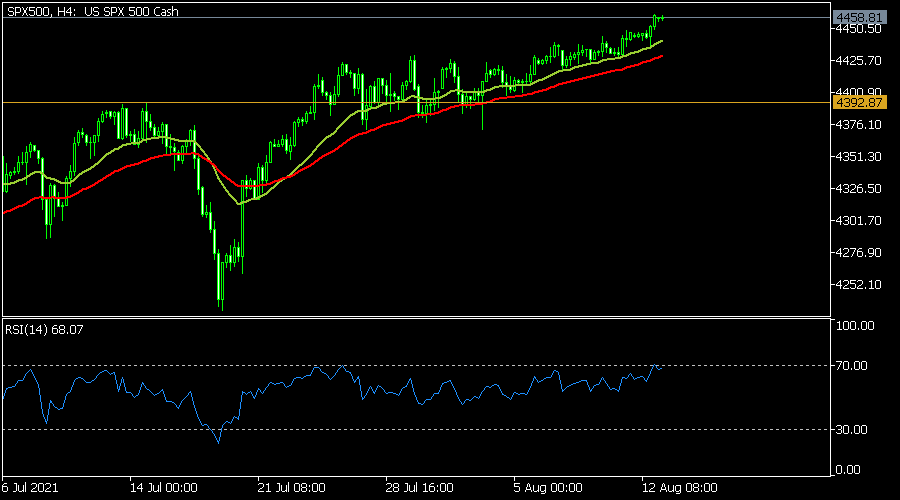
The S&P 500 index maintained the bullish momentum in the overnight session as interest in American stocks rose. The index rose to a high of $4,458, which was a new all-time high. As a result, the index has moved above the important resistance at $4,392. It has also risen above the 25-day and 50-day moving averages. The Relative Strength Index (RSI) has moved close to the overbought level. Therefore, the index will likely keep rising, with the next key target being at $4,500.
EURUSD
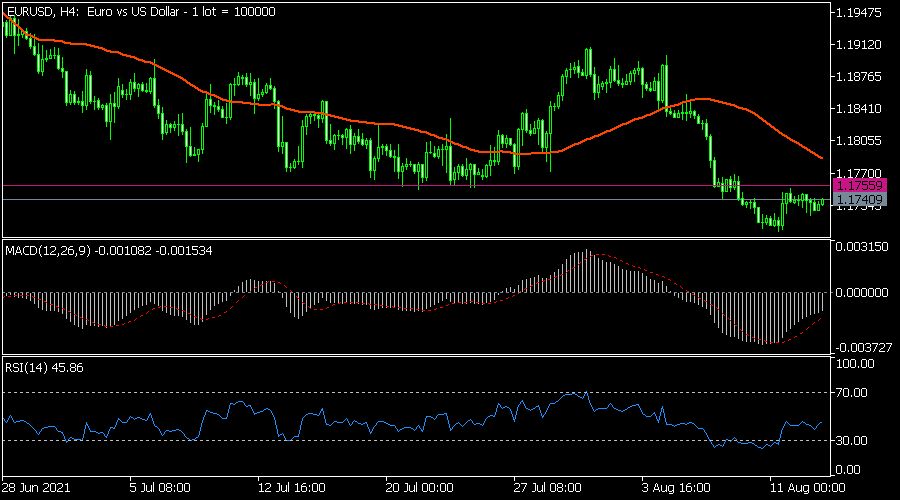
The EURUSD pair was little changed in the overnight session. On the four-hour chart, the pair is slightly below the key support level at 1.1750. It has also moved below the 25-day and 15-day moving averages while the MACD and Relative Strength Index (RSI) have tilted lower. With no major economic data expected, the pair will likely remain in the current range.
BTCUSD
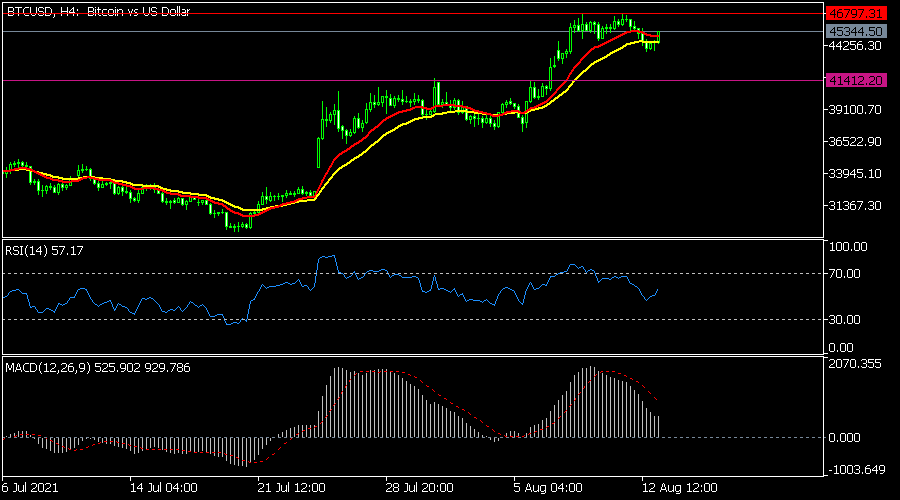
The BTCUSD price retreated to a low of 43,821 in the overnight session and then rebounded to the current level of 45,266. On the four-hour chart, the pair is slightly below this week’s high of 46,787. It has also moved above the 25-day and 50-day moving average and the support at 41,412. The pair will likely keep rising during the weekend as investors target the next key resistance at 50,000.
AUD/USD Daily Report
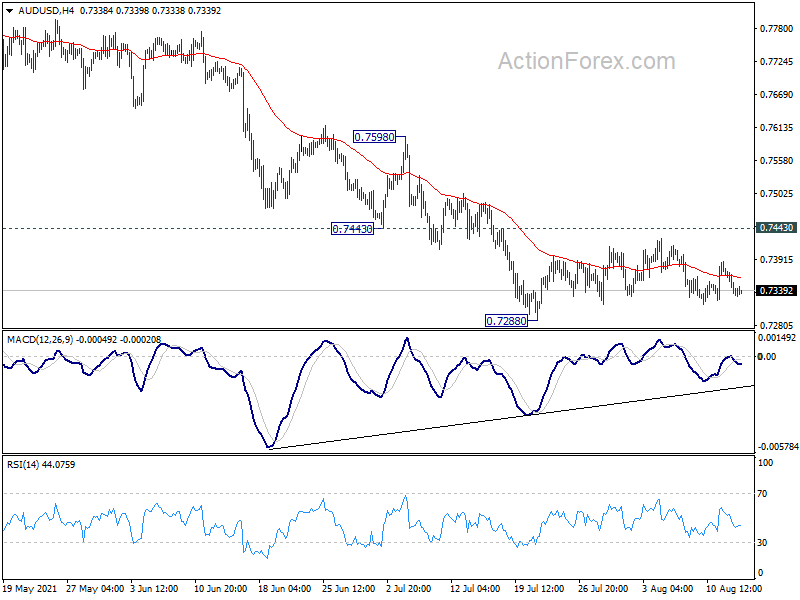
Daily Pivots: (S1) 0.7320; (P) 0.7349; (R1) 0.7365; More...
Intraday bias in AUD/USD remains neutral for consolidation above 0.7288. Outlook stays bearish as long as 0.7443 resistance holds. On the downside, break of 0.7288 will resume the fall from 0.8006 to 161.8% projection of 0.8006 to 0.7530 from 0.7890 at 0.7120 next. On the upside, break of 0.7443 will bring stronger rebound to 0.7530 support turned resistance instead.
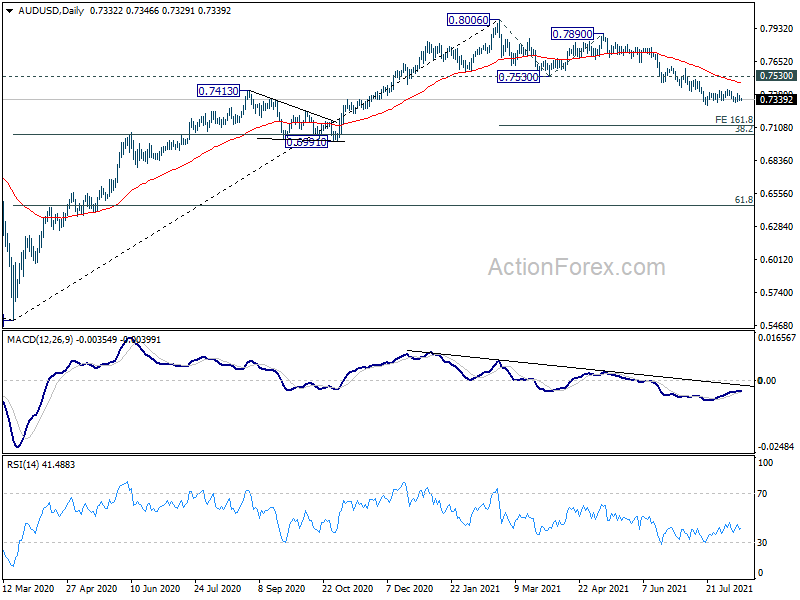
In the bigger picture, rise from 0.5506 medium term bottom could have completed at 0.8006, after failing 0.8135 key resistance. Correction from there could target 0.6991 cluster support (38.2% retracement of 0.5506 to 0.8006 at 0.7051). We'd look for strong support from there to bring rebound. However, sustained break of this level would argue that the whole medium term trend has indeed reversed.
USD/CAD Daily Outlook
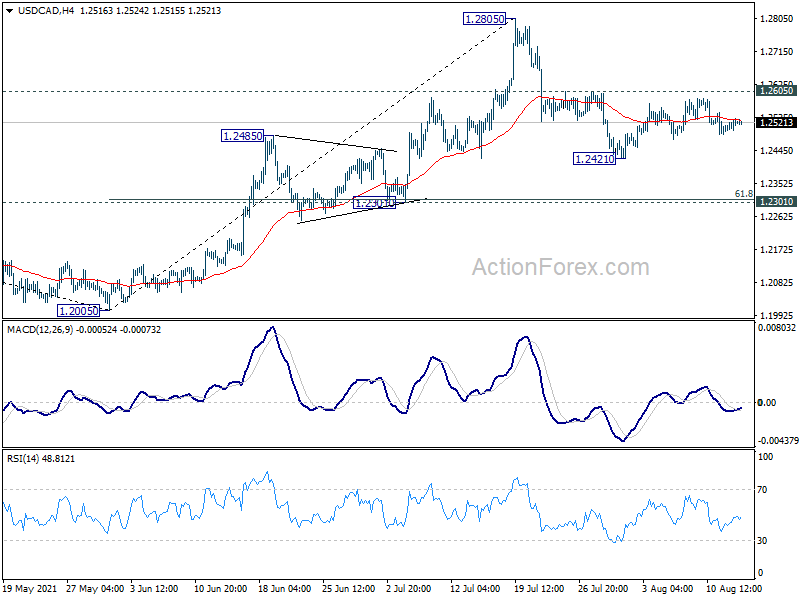
Daily Pivots: (S1) 1.2482; (P) 1.2515; (R1) 1.2540; More...
Intraday bias in USD/CAD stays neutral as consolidation from 1.2421 is still in progress. As long as 1.2605 resistance holds, further decline is expected. On the downside, break of 1.2421 will resume the fall from 1.2805 to 1.2301 cluster support (61.8% retracement of 1.2005 to 1.2805 at 1.2311). On the upside, break of 1.2605 will turn bias back to the upside for retesting 1.2805 high instead.
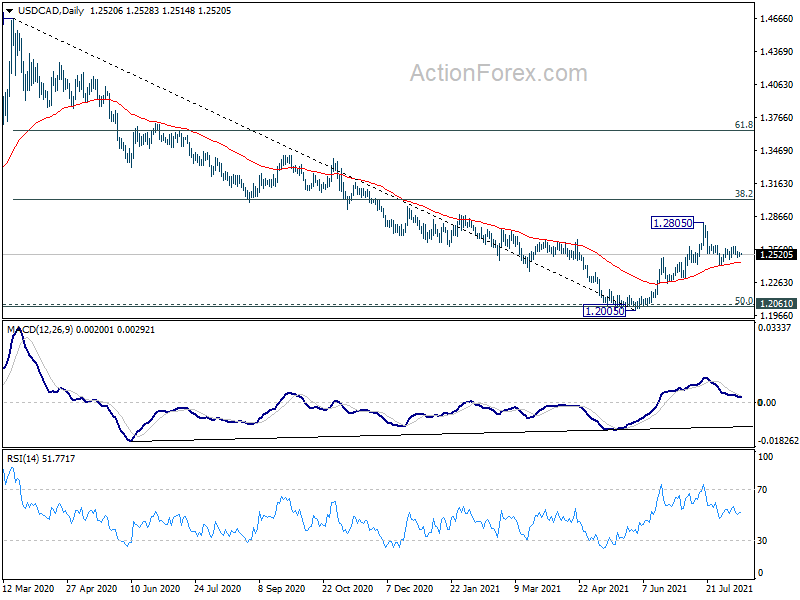
In the bigger picture, fall from 1.4667 is seen as the third leg of the corrective pattern from 1.4689 (2016 high). It should have completed after hitting 1.2061 (2017 low) and 50% retracement of 0.9406 to 1.4689 at 1.2048. Sustained break of 38.2% retracement of 1.4667 to 1.2005 at 1.3022 will pave the way to 61.8% retracement at 1.3650 and above. Overall, medium term outlook remains neutral at worst with 1.2048/61 support zone intact.
DAX Elliott Wave View: More Upside Should Happen
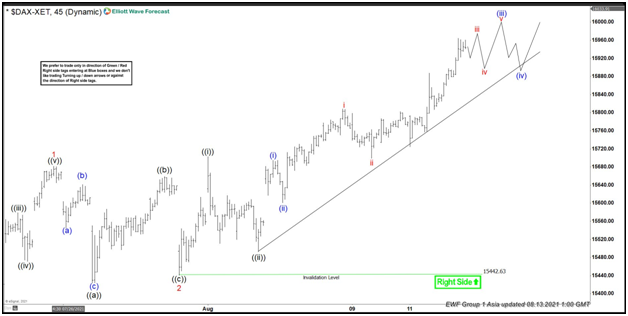
Short-term Elliott wave view in DAX suggests that the cycle from 19 July 2021 low is unfolding in an impulse sequence favoring more upside extension to happen. Up from that low, the index has ended the first leg in wave 1 at 15681.41 high. Then wave 2 pullbacks unfolded as a flat structure where wave ((a)) ended at 15423.56 low. Wave ((b)) bounce ended at 15659.22 high and wave ((c)) ended at 15442.63 low, thus completed the wave 2 pullback.
Above from there, wave 3 remains in progress in lesser degree 5 waves structure where wave ((i)) ended at 15702.89. Wave ((ii)) pullback ended at 15492.58 low and wave ((iii)) remains in progress with another lesser degree 5 wave advance. Whereas wave (i) ended at 15694.67 high & wave (ii) ended at 15600.80 low. Near-term, as far as dips remain above 15699.27 low and more importantly above 15442.63 low then DAX is expected to extend higher in lesser degree wave (iii) approximately towards 16014.14- 16088.64 area higher before entering into a wave (iv) pullback. We don’t recommend selling and expect dips to find support in 3, 7, or 11 swings for further upside.
DAX 1 hour Elliott Wave chart
EUR/AUD Daily Outlook
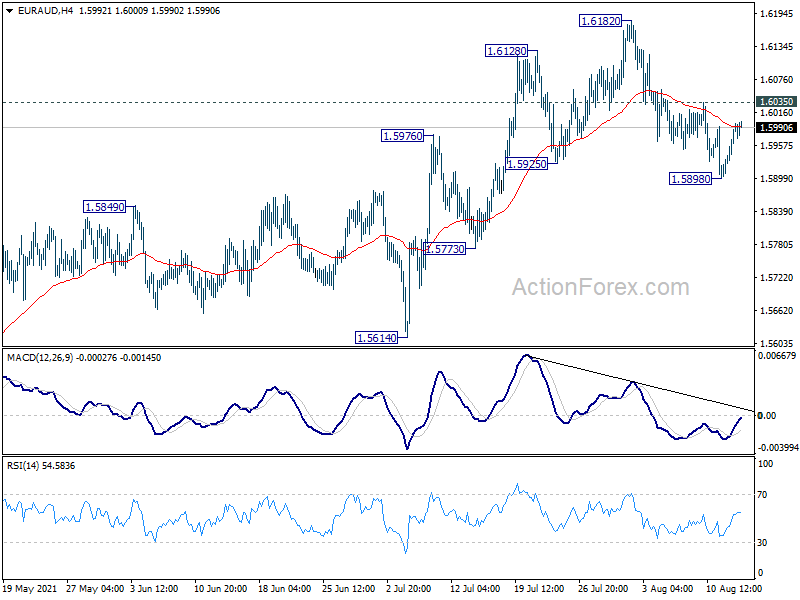
Daily Pivots: (S1) 1.5940; (P) 1.5970; (R1) 1.6024; More...
Intraday bias in EUR/AUD is turned neutral with current recovery. Another fall is mildly in favor as long as 1.6035 minor resistance holds. On the downside, sustained break of 55 day EMA (now at 1.5880) would argue that choppy corrective rebound from 1.5250 has completed. Deeper fall would be seen to 1.5614 structural support for confirmation. On the upside, above 1.6035 minor resistance will turn bias back to the upside for retesting 1.6182 high instead.
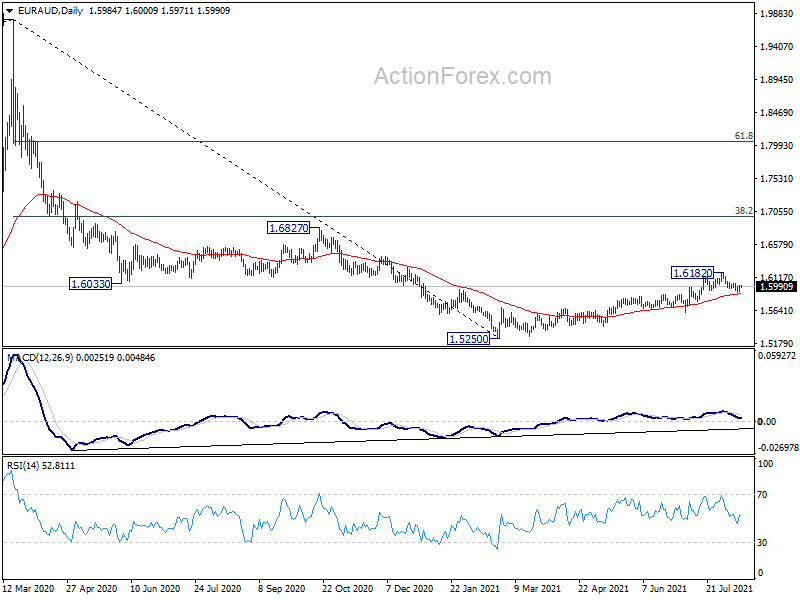
In the bigger picture, a medium term bottom was formed at 1.5250, on bullish convergence condition in daily MACD. Rise from 1.5250 is currently seen as a correction to the down trend from 1.9799 first. Stronger rise would be seen to 38.2% retracement of 1.9799 to 1.5250 at 1.6988 next. We'd tentatively expect strong resistance from there to limit upside, at least on first attempt. Meanwhile, break of 1.5614 support will indicate that the rebound has completed and bring retest of 1.5250 low.
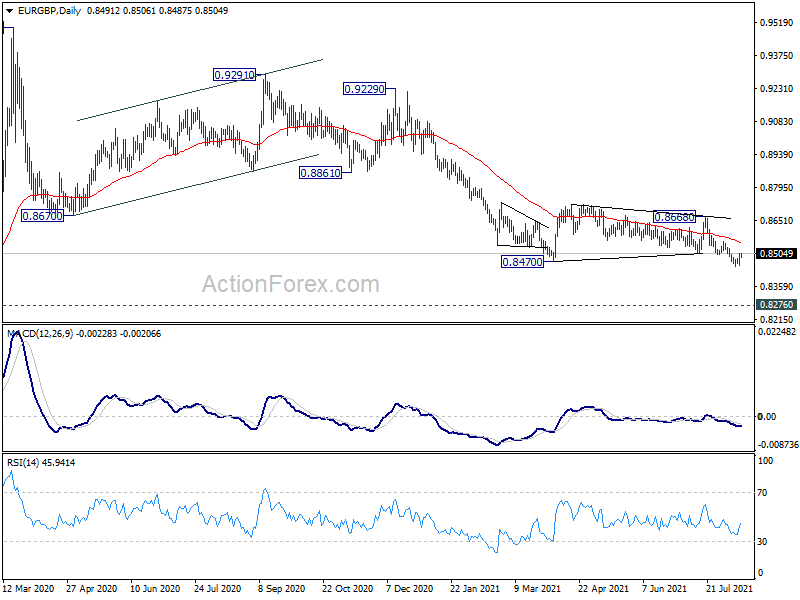
EUR/GBP Daily Outlook
Daily Pivots: (S1) 0.8473; (P) 0.8488; (R1) 0.8516; More...
Intraday bias in EUR/GBP is turned neutral with current recovery. But outlook will stay mildly bearish as long as 0.8556 resistance holds. On the downside, break of 0.8448 will resume the whole decline from 0.9799, to retest 0.8276 key long term support level.
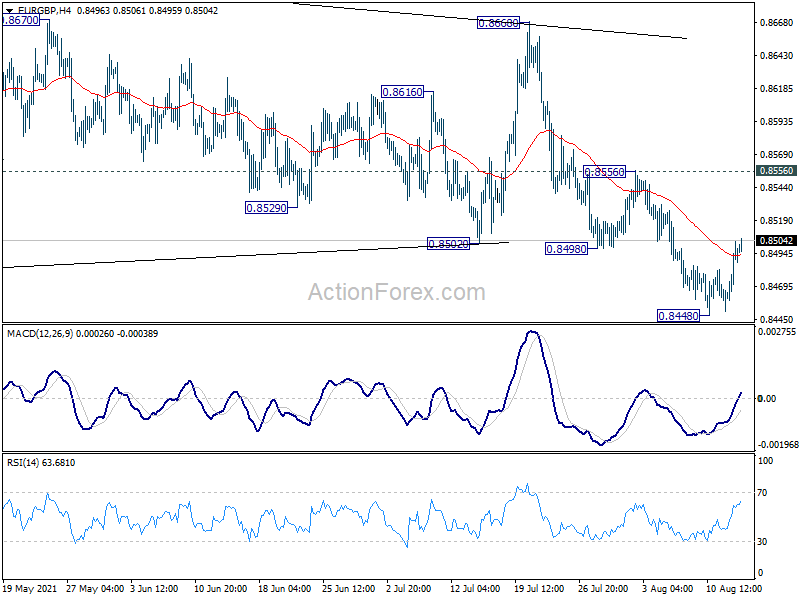
In the bigger picture, price actions from 0.9499 are still seen as developing into a corrective pattern. Further decline is expected as long as 0.8668 resistance holds, to retest long term support at 0.8276. We'd look for strong support from there to bring rebound. On the upside, firm break of 0.8668 resistance would now be the first sign of medium term bullish reversal.
Equities Trade Mixed
General trend
- Nikkei has remained near the opening level.
- Hang Seng has remained modestly lower; TECH index drops over 2%.
- Shanghai Composite ended morning trading slightly lower (-0.3%), IT and Property indices lagged.
- Samsung weighs on Kospi.
- S&P ASX 200 has outperformed [Consumer and Utilities indices rise; Financials drop amid ex-dividends; Lower iron ore prices weigh on Resources index].
- China July data (including Industrial Production, Retail Sales and Fixed Asset Investment) is due to be released on Monday, Aug 16th [Sunday night in the US].
- China PBOC generally conducts MLF operations around the 15th of the month.
Headlines/Economic Data
Australia/New Zealand.
- ASX 200 opened flat.
- (AU) Australia sells A$1.2B v A$1.2B indicated in 4.75% Apr 2027 bonds, avg yield 0.7038%, bid to cover 3.93x.
- (AU) Australia AOFM (debt agency): To sell new Nov 2032 Indexed bond via syndication during week of Aug 23rd.
- (NZ) New Zealand July Manufacturing PMI: 62.6 v 60.7 prior (7th month of expansion).
China/Hong Kong
- Hang Seng opened -0.8%, Shanghai Composite -0.3%.
- (CN) Shanghai Sec News: China July data [due on Monday Aug 16th] will show slowdown due to curbs on debt and coronavirus cases, cites market analysts.
- (CN) China targets to cut steel production by 63Mt during H2 2021, also seeking to stabilize iron ore prices - Shanghai Securities News.
- (CN) China said to have halted private equity funding for residential property developments – press.
- (CN) US Sec of State Deputy Sherman met with the new China Ambassador Qin Gang on Aug 12th (as expected); Sherman said remains committed to continuing talks – financial press.
- (CN) China National People's Congress (NPC) Standing Committee is reviewing a draft law that regulates data collection by apps [3rd review] – Press.
- (CN) China PBOC has suspended mandatory credit ratings for interbank market bond issuers as part of pilot program [relates to all non-financial cos.] - Chinese pres.
- (CN) China People's Daily: Urging to refrain from vulgar comments online.
- (CN) China Ministry of Finance (MOF) sells 30-year bonds: avg yield 3.315% v 3.5736% prior.
- (CN) China PBOC Open Market Operation (OMO): Injects CNY10B in 7-day reverse repos v CNY10B in 7-day reverse repos prior; Net CNY0B v Net CNY0B prior.
- (CN) China PBOC sets Yuan reference rate: 6.4799 v 6.4754 prior.
Japan
- Nikkei 225 opened +0.1%.
- (JP) Japan Econ Min Nishimura: Will respond on expanding the State of Emergency as needed.
- (JP) Japan PM Suga: On highest alert on rains impacting western Japan.
Korea
- Kospi opened -0.1%.
- (KR) South Korea July Export Price Index Y/Y: 16.9% v 12.7% prior; Import Price Index Y/Y: 19.2% v 14.0% prior.
- (KR) South Korea sells 50-year bonds: avg yield 1.960% v 2.060% prior.
Other Asia
- (MY) Malaysia Q2 GDP Q/Q: -2.0% v -1.9%e; Y/Y: 16.1% v 14.1%e; cuts 2021 GDP growth outlook.
North America
- (US) JULY PPI FINAL DEMAND M/M: 1.0% V 0.6%E; Y/Y: 7.8% V 7.2%E.
- (US) US FDA has authorized a 3rd coronavirus shot for immunocompromised individuals (as expected).
- (US) US Supreme Court has blocked key part of New York State's Eviction moratorium, grants emergency request by landlord group - press.
Levels as of 01:20 ET
- Nikkei 225, flat, ASX 200 +0.5% , Hang Seng -1%; Shanghai Composite -0.4% ; Kospi -1.4%.
- Equity S&P500 Futures: flat; Nasdaq100 -0.1%, Dax -0.1%; FTSE100 +0.1%.
- EUR 1.1742-1.1729 ; JPY 110.46-110.36 ; AUD 0.7352-0.7332 ;NZD 0.7015-0.6994.
- Gold +0.3% at $1,757/oz; Crude Oil -0.8% at $68.55/brl; Copper +0.3% at $4.3745/lb.