Sample Category Title
The Analytical Overview Of The Main Currency Pairs
The EUR/USD currency pair
Technical indicators of the currency pair:
Prev Open: 1.1736
Prev Close: 1.1720
% chg. over the last day: -0.14%
In Germany, ZEW economic sentiment index has sharply decreased to 40.4 in August (previous value - 63.3). The eurozone economic sentiment index also decreased from 61.2 to 42.7. With the dollar index strengthening, such a fundamental picture doesn’t have benefits for the euro currency.
Trading recommendations
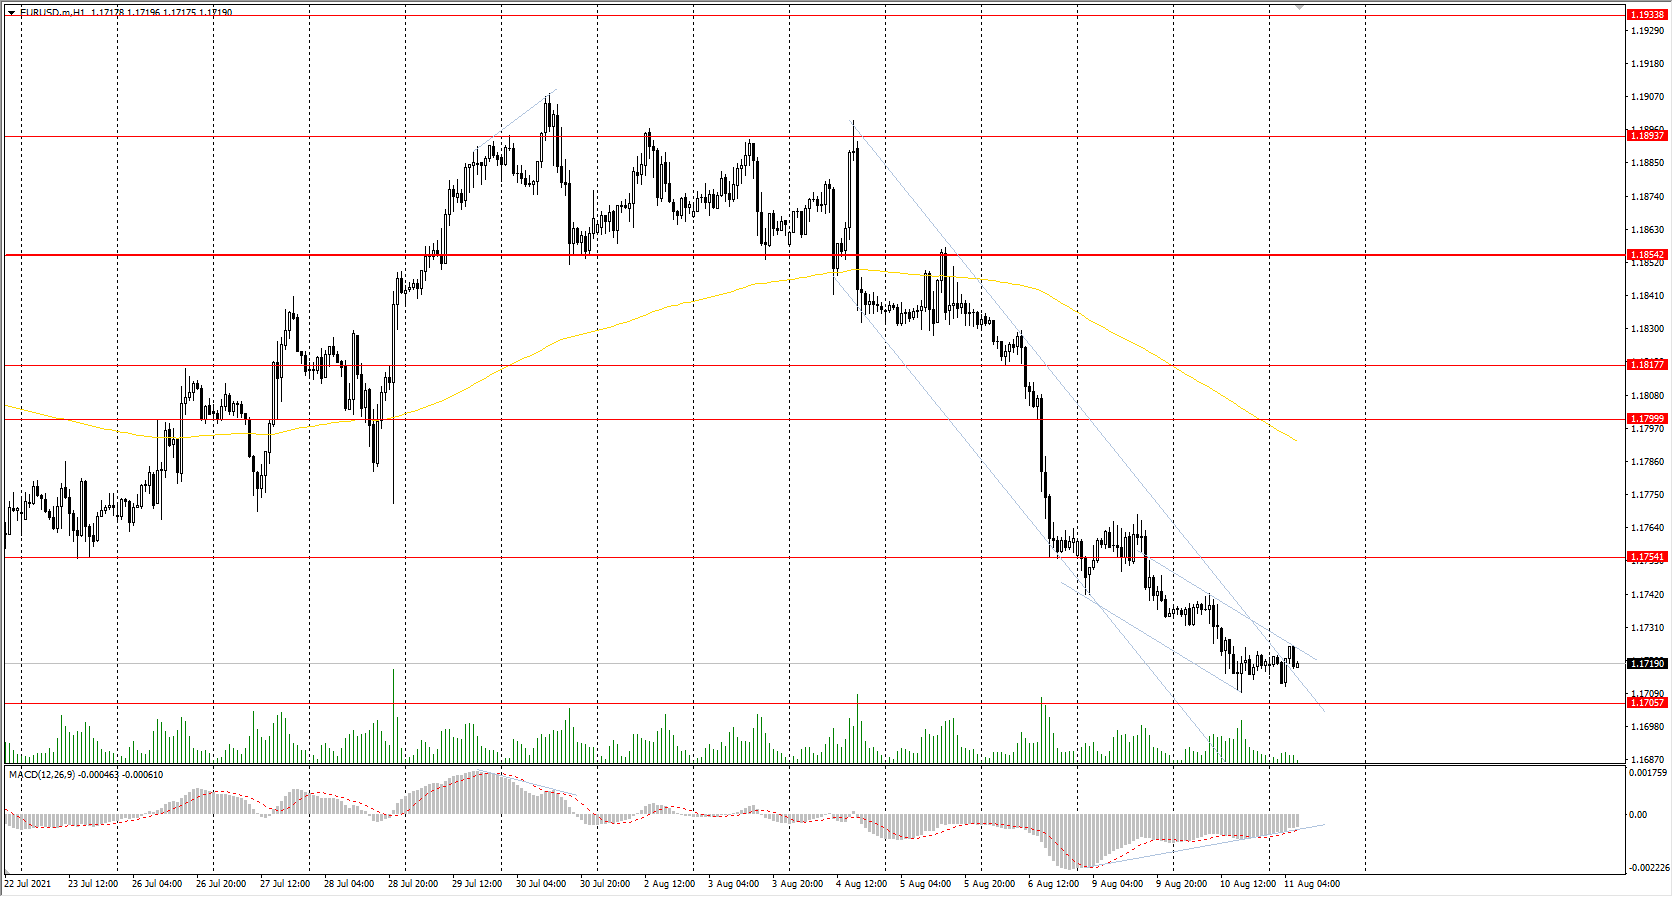
Support levels: 1.1706, 1.1609
Resistance levels: 1.1754, 1.1799, 1.1817, 1.1854, 1.1894, 1.1934, 1.1969
From a technical point of view, the general trend on the EUR/USD currency pair is bearish. The price went below the moving average; the MACD indicator is in the oversold zone, but there are signs of a reversal in the form of divergence. There is also a slowdown in the rate of decline, which indicates a likely rebound in the near future, especially in the presence of a daily support level. Under such market conditions, it is better to look for the sell trades from the resistance levels, but after a slight upward correction since the price has deviated strongly from the middle line. Buy trades can only be considered throughout the day and only with confirmation in the form of a bullish initiative.
Alternative scenario: if the price breaks through the 1.1854 resistance level and fixes above, the mid-term uptrend will likely resume.
News feed for 2021.08.11:
- US Consumer Price Index (m/m) at 15:30 (GMT+3);
- US Core Consumer Price Index (m/m) at 15:30 (GMT+3);
- US FOMC Member Bostic Speaks at 17:30 (GMT+3).
The GBP/USD currency pair
Technical indicators of the currency pair:
Prev Open: 1.3844
Prev Close: 1.3838
% chg. over the last day: -0.04%
The situation on the GBP/USD currency pair has not changed. The decline in the currency pair is associated with the strengthening of the dollar index. However, the British pound has gained a more stable position than the euro. The fundamental picture of the UK is now positive, so if there is any weakness in the dollar index, the British currency will continue to strengthen.
Trading recommendations
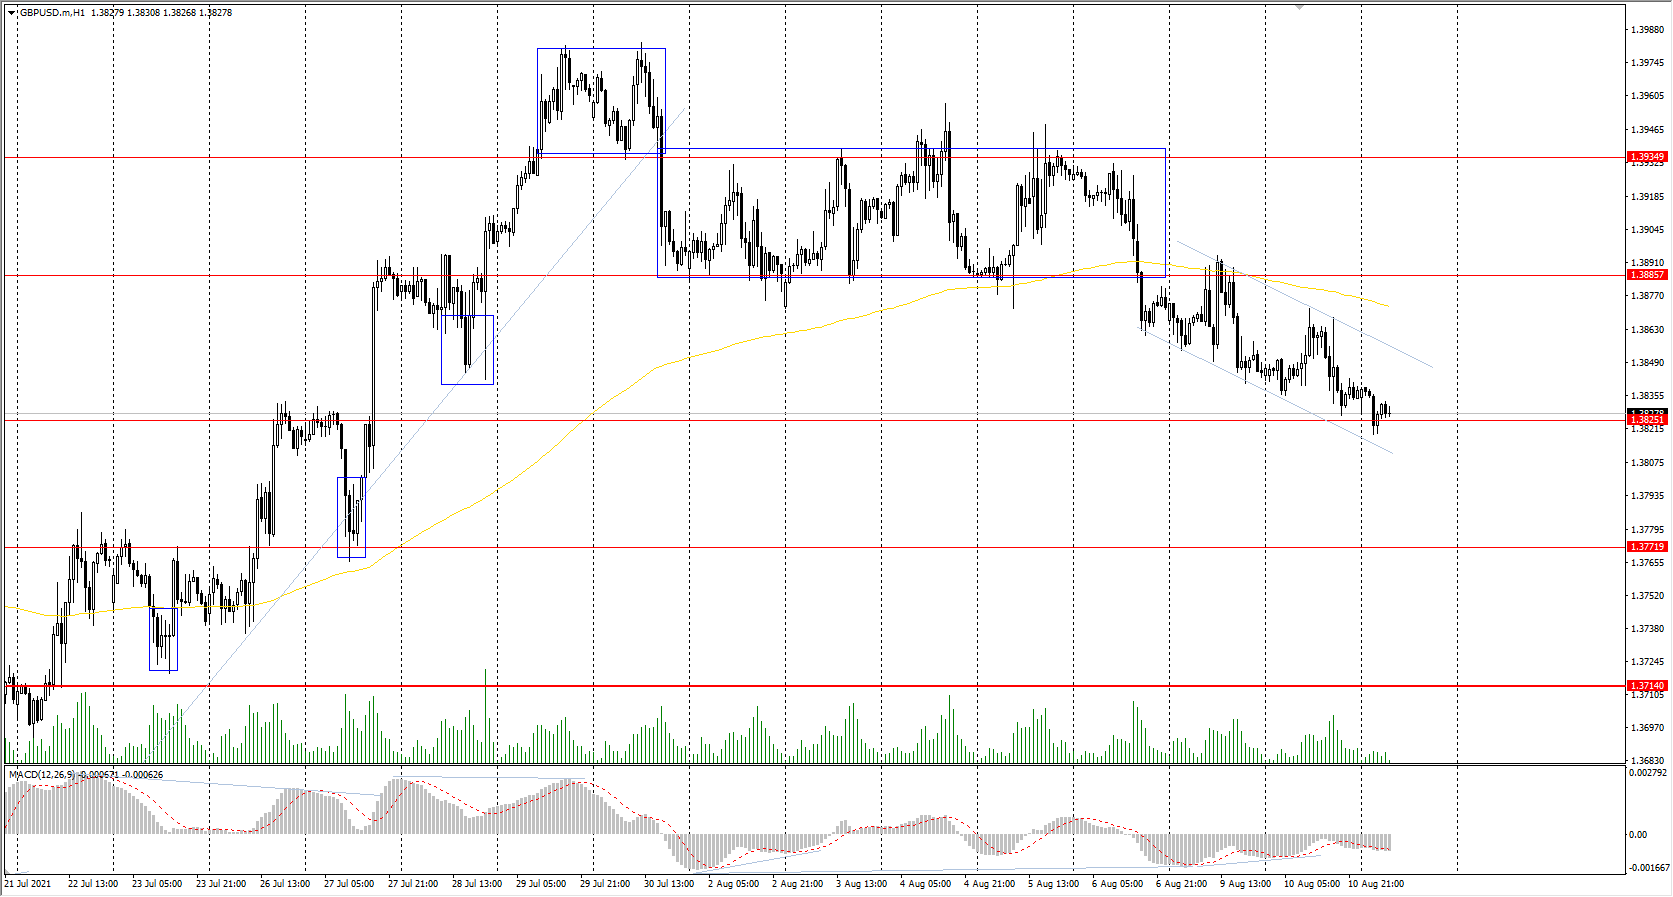
Support levels: 1.3825, 1.3772, 1.3714, 1.3676 ,1.3641, 1.3614, 1.3525
Resistance levels: 1.3886, 1.3935, 1.4002, 1.4075, 1.4101
The trend of the GBP/USD currency pair is bullish on the hourly time frame. The price has already reached a strong support level. The MACD indicator went into the negative zone, but there are signs of divergence. Under such market conditions, traders are better to look for the buy trades after buyers show initiative. Sell positions can be considered from the resistance levels within the local downward movement.
Alternative scenario: if the price breaks through the 1.3714 support level and consolidates below, the bearish scenario is likely to resume.
News feed for 2021.08.11:
- US Consumer Price Index (m/m) at 15:30 (GMT+3);
- US Core Consumer Price Index (m/m) at 15:30 (GMT+3).
The USD/JPY currency pair
Technical indicators of the currency pair:
Prev Open: 110.24
Prev Close: 110.57
% chg. over the last day: +0.30%
The USD/JPY currency pair is slowly and steadily growing due to the growth of the dollar index. The dollar index has grown to the highest level since mid-July, and taking into account the weak forecasts for the third quarter in Japan, such a fundamental picture plays in favour of the USD/JPY quotes growth.
Trading recommendations
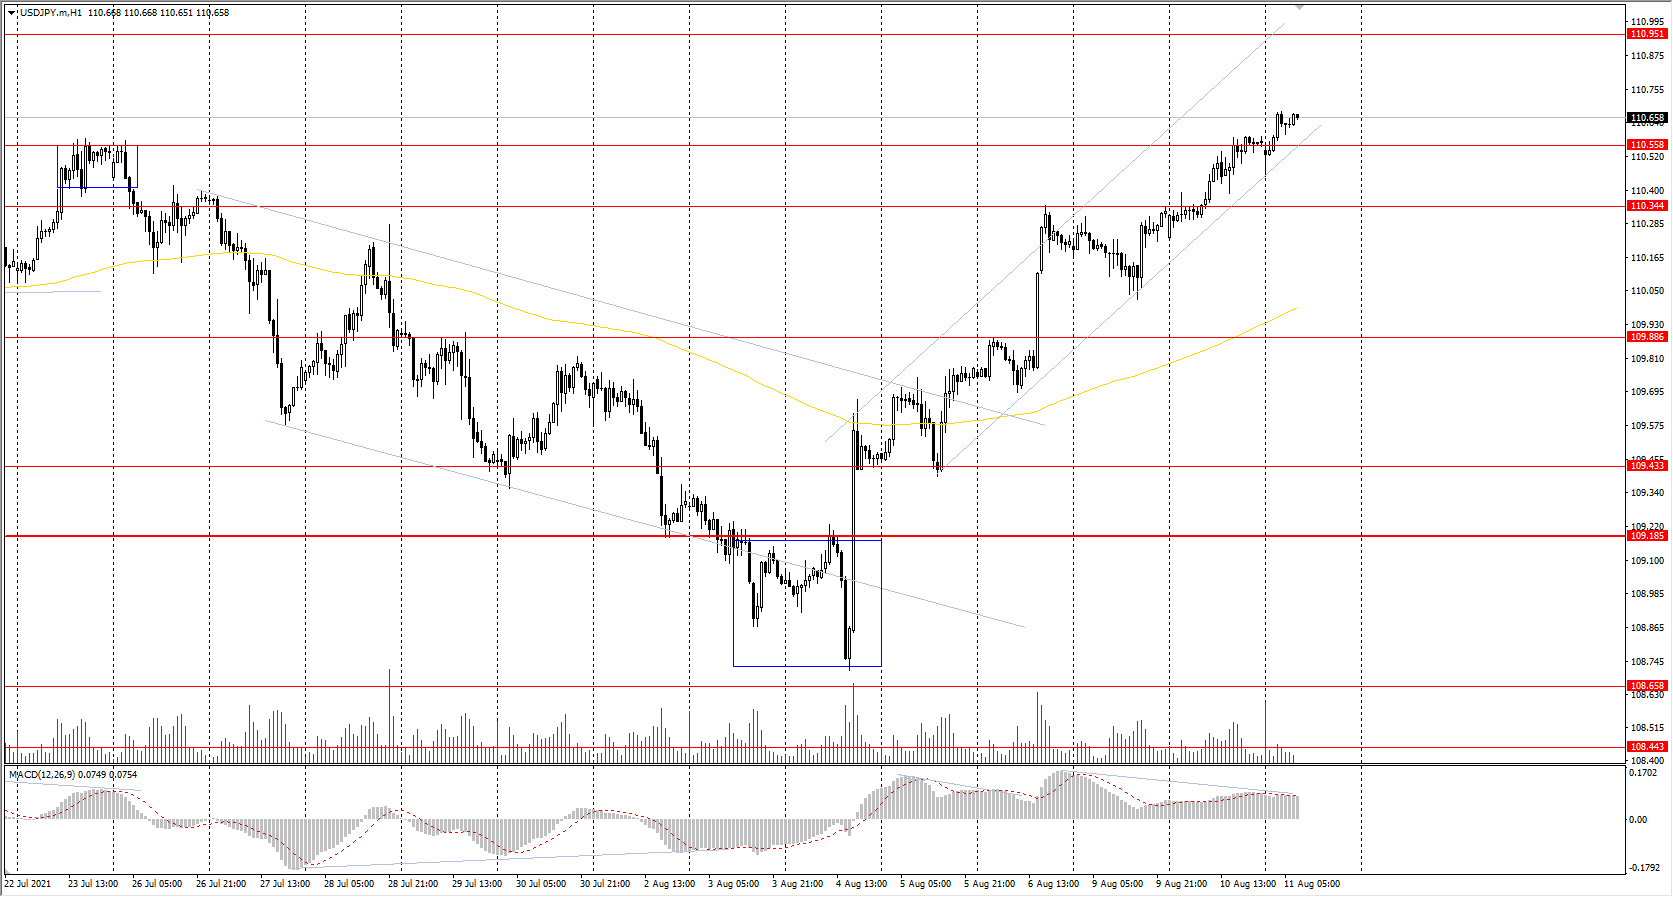
Support levels: 110.56, 110.34, 109.88, 109.43, 109.19, 108.65
Resistance levels: 110.95, 111.48
The main trend on the USD/JPY currency pair is bullish. The MACD indicator is in the oversold zone, but there are signs of reversal in the form of divergence. Under such market conditions, it is better to look for the buy positions after a small pullback downwards because the price has strongly deviated from the moving average. Sell positions should be considered only on the lower time frames from the resistance level after sellers show initiative.
Alternative scenario: if the price falls below 109.19, the uptrend is likely to be broken.
News feed for 2021.08.11:
- US Consumer Price Index (m/m) at 15:30 (GMT+3);
- US Core Consumer Price Index (m/m) at 15:30 (GMT+3).
The USD/CAD currency pair
Technical indicators of the currency pair:
Prev Open: 1.2575
Prev Close: 1.2518
% chg. over the last day: -0.46%
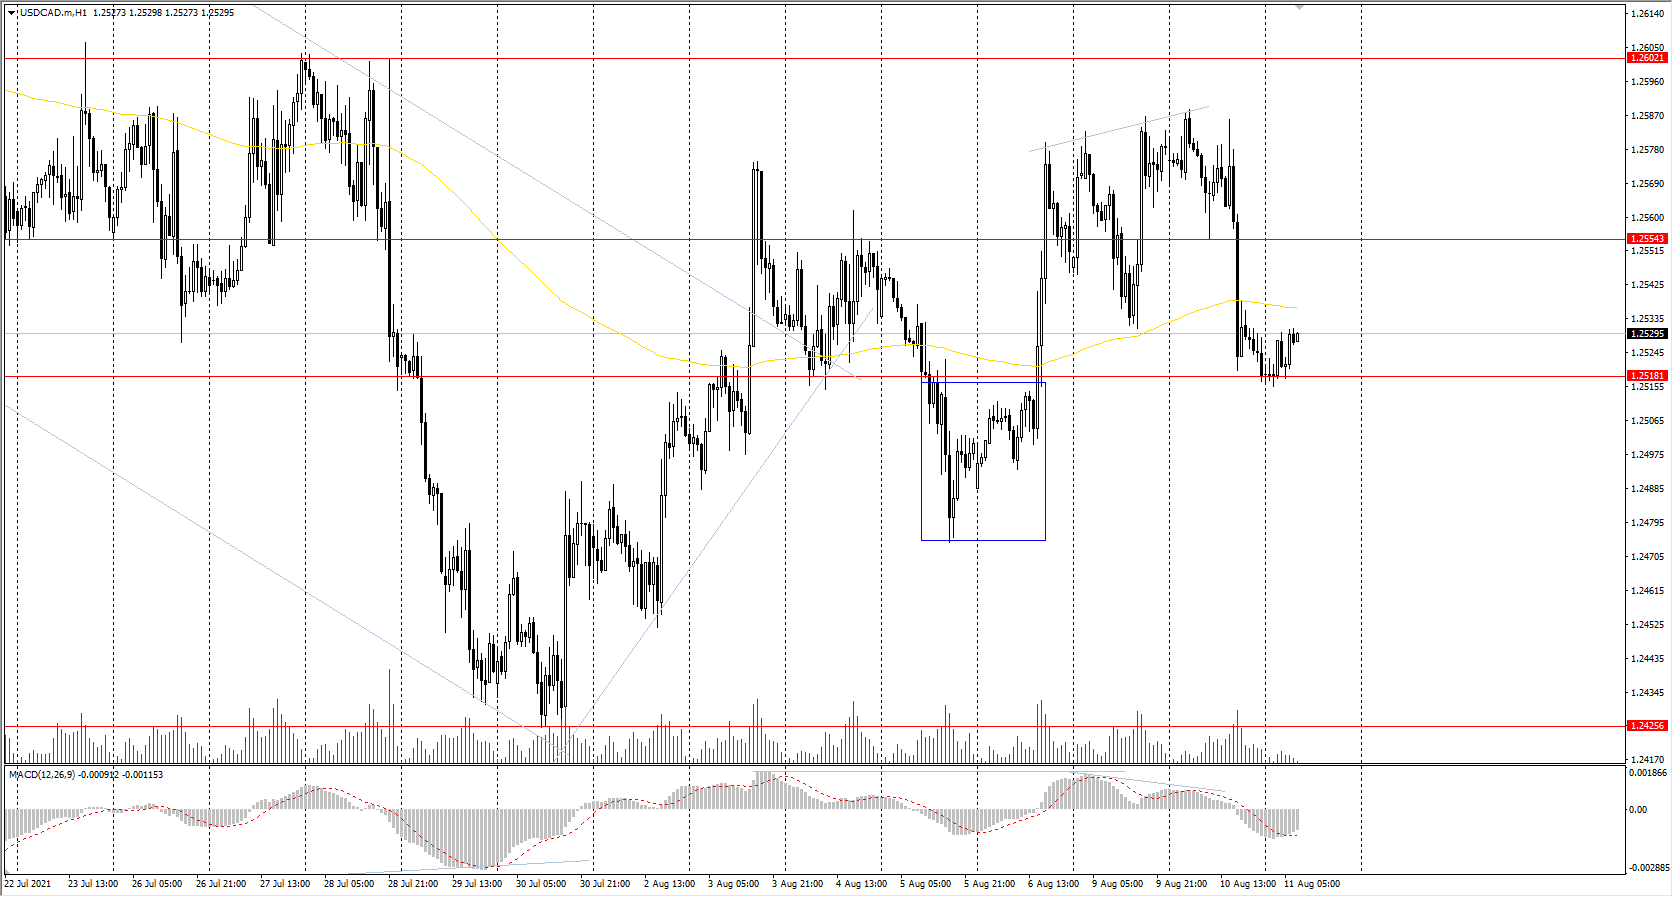
The Canadian dollar is highly dependent on the dollar index and the oil price dynamics. The increase in oil prices caused the strengthening of the Canadian dollar and a decrease in the USD/CAD quotes. Today, the volatility on the USD/CAD currency pair will be high, because the quotes will be influenced by a lot of important news.
Trading recommendations
Support levels: 1.2518, 1.2471, 1.2425, 1.2370, 1.2312
Resistance levels: 1.2554, 1.2602, 1.2671, 1.2787, 1.2951
Considering technical analysis, the USD/CAD trend is bearish. The price is trading near the moving average, and the MACD indicator has become negative. Under such market conditions, it is better to look for the sell positions from the resistance levels. Traders should consider the buy positions from the support levels and only on intraday time frames.
Alternative scenario: if the price breaks through the 1.2671 resistance level and fixes above, the uptrend is likely to be resumed.
News feed for 2021.08.11:
- US Consumer Price Index (m/m) at 15:30 (GMT+3);
- US Core Consumer Price Index (m/m) at 15:30 (GMT+3);
- US Crude Oil Reserves (w/w) at 17:30 (GMT+3).
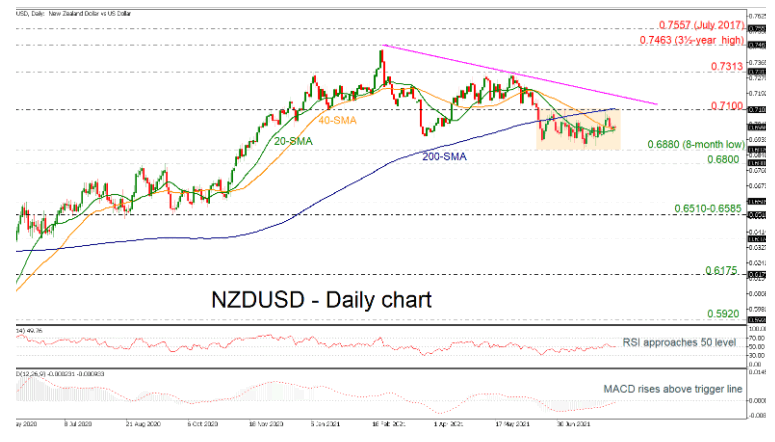
NZDUSD Moves Sideways Near 0.7000, Neutral Bias
NZDUSD has been moving in a horizontal trajectory over the last two months, going back and forth around its short-term simple moving averages (SMAs). In the medium-term picture, the price is developing in a descending move, trading beneath the falling trend line and the 200-day SMA.
As regards the technical indicators, the RSI is flattening near its neutral threshold of 50, while the MACD has risen above its trigger line but is still near its zero level.
A rally higher could meet immediate resistance at the 0.7100 psychological level, which overlaps with the 200-day SMA. The down-trending line could next take action around 0.7167. More gains could lead the pair towards the 0.7313 barrier, shifting the medium-term outlook to neutral, while higher, all attention will turn to the three-and-a-half-year high of 0.7463.
On the flip side, a decline beneath the short-term SMAs would open the way towards the eight-month low of 0.6880. Any break lower from here would strengthen the negative structure, likely bringing the 0.6800 round number next into view. Steeper decreases could take the price until the 0.6510-0.6585 support zone.
Overall, NZDUSD is neutral in the short-term and bearish in the medium-term. A positive breakout above the diagonal line, and more importantly a close above the 0.7463 peak, could shift the long-term outlook back to bullish.
USDJPY To Hold Its Bullish Tone
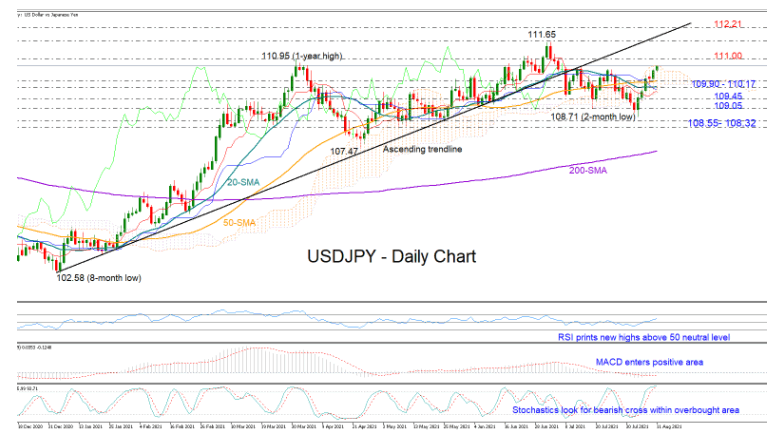
USDJPY settled at solid base around the former support area of 109.05 last week, drifting northwards to claim the previous resistance area of 109.54 and peak at a one-month high of 110.73 on Wednesday.
Although the neutral trajectory is still intact in the short-term picture, the momentum indicators set up the potential for another bullish swing to take place in the coming sessions, but with some caution.
Specifically, the RSI is rising with a strong positive momentum above its 50 neutral level, marking new highs within the bullish area, while the MACD is looking to strengthen in the positive zone. The Stochastics though, are fluctuating within overbought waters, suggesting the upside move could soon lose steam, while the red Tenkan-sen and blue Kijun-sen lines have yet to complete a bullish cross.
The surface of the Ichimoku cloud is currently keeping the bulls under control around 110.74. Should it give way, with the price breaching the 111.00 number too, the way would clear towards July’s peak of 111.65 and the broken ascending trendline. The 112.21 barrier from February 2020 could next come on the radar, while higher, the pair may attempt to touch the 113.00 psychological level for the first time since the end of 2018.
If selling pressures return, the pair may initially seek support somewhere between its 50- and 20-day simple moving averages (SMAs) currently at 110.17 and 109.90 respectively. A break lower could see some consolidation around 109.45 before the door opens again for the key 109.00 handle and the two-month low of 108.71.
All in all, USDJPY is expected to trade bullish in the short term, where any break above 111.00 could push for an outlook upgrade above 111.65.
XAG/USD Sinks To Major Support
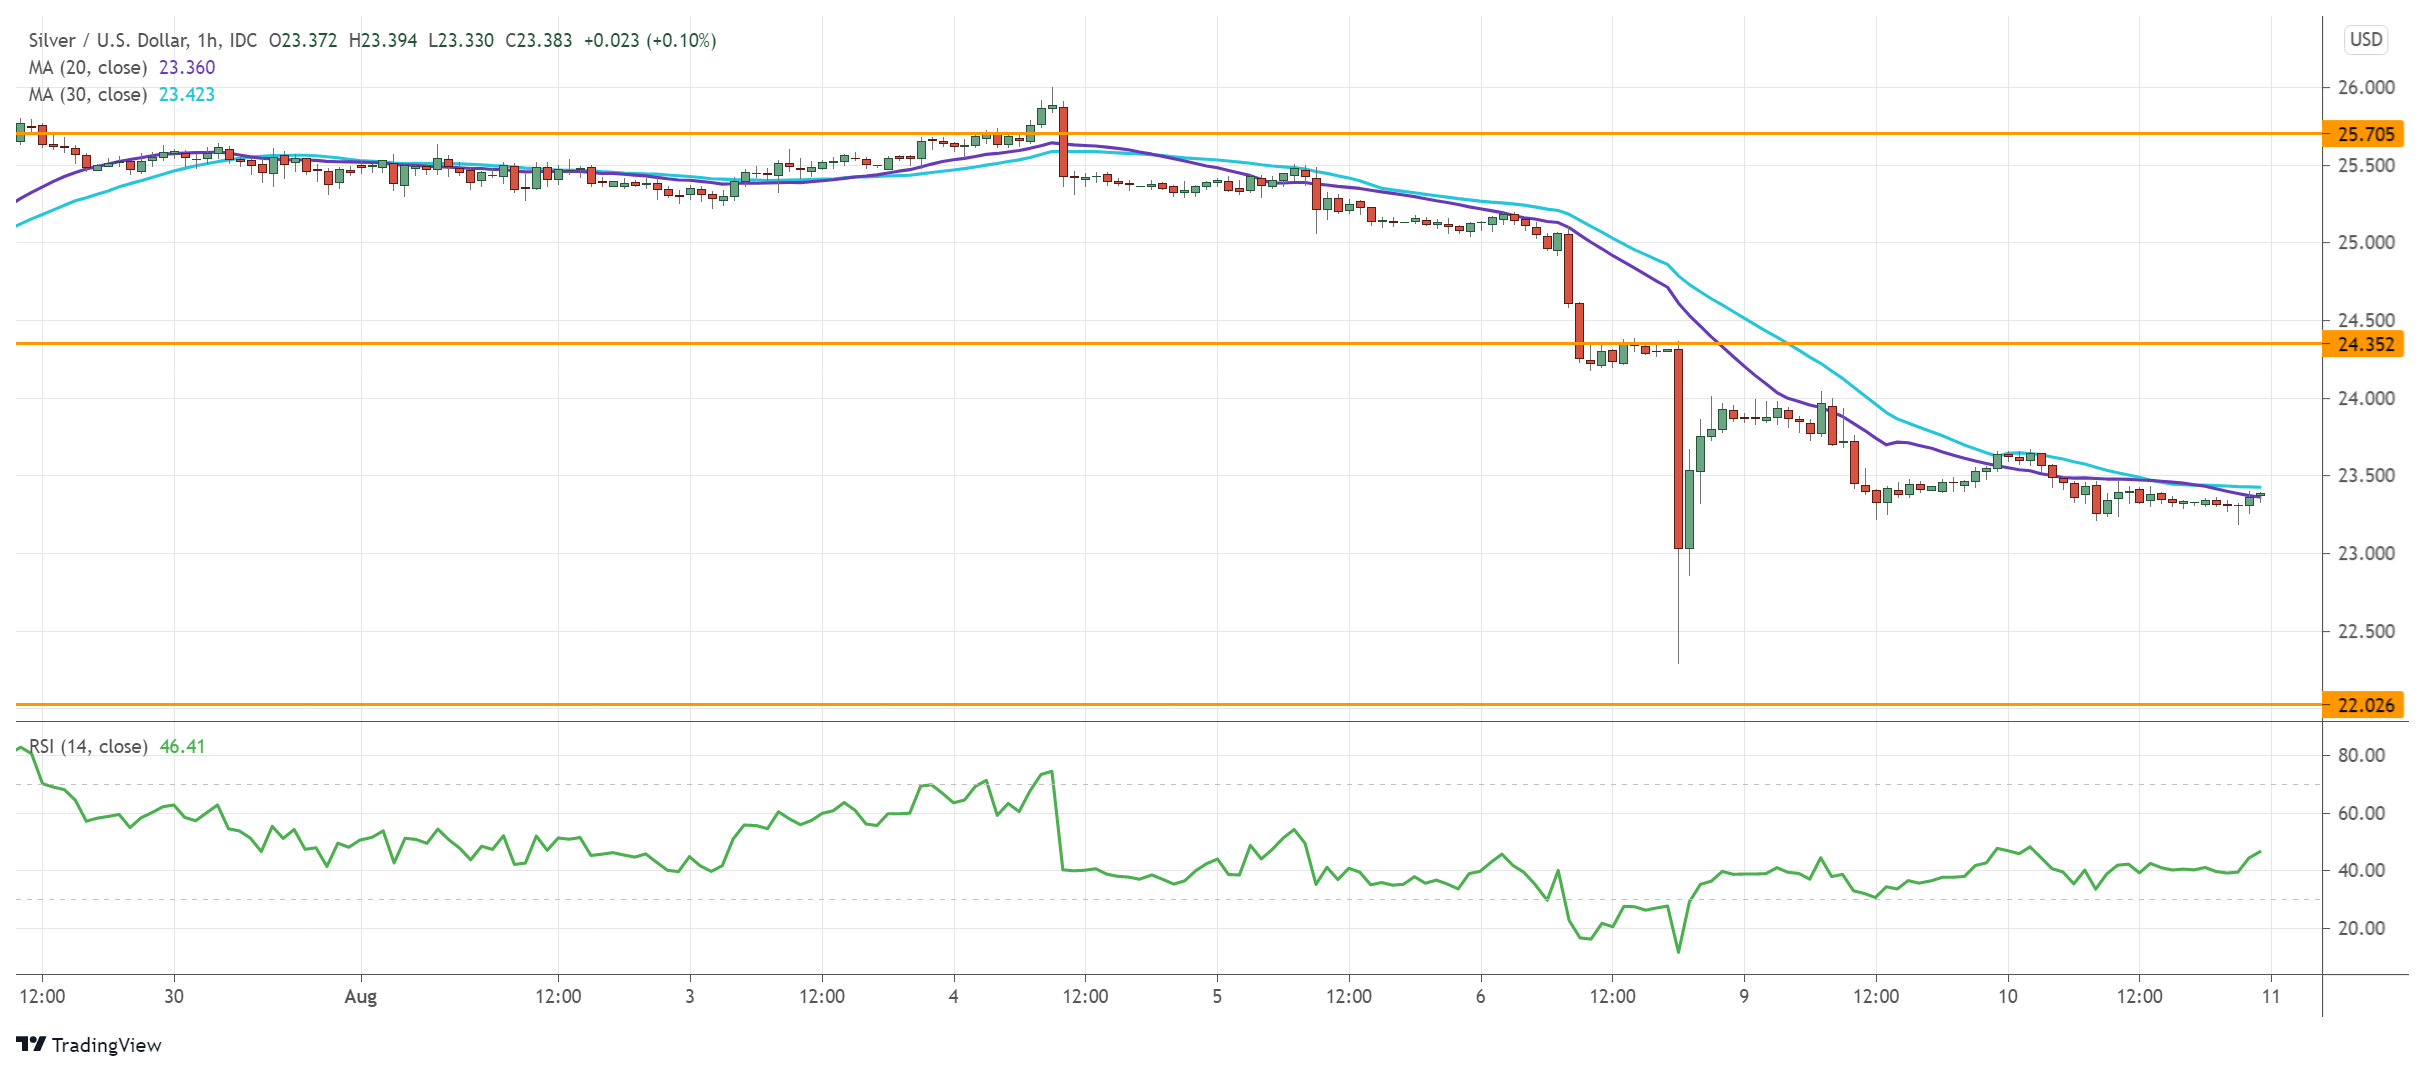
Bullion's struggle as US bond yields rises amid hawkish Fed comments about a taper in the fourth quarter.
Silver's latest rally may turn out to be a dead cat bounce as sentiment remains extremely cautious. Price action is grinding down along the moving averages.
24.35 is now the new resistance. Sellers would be eager to dump at a better price before the RSI goes oversold again.
The psychological level of 22.00 from last November would be a critical test of the rally from March 2020.
EUR/USD Lacks Support
Downbeat economic sentiment in the eurozone further depresses the euro against a roaring US dollar.
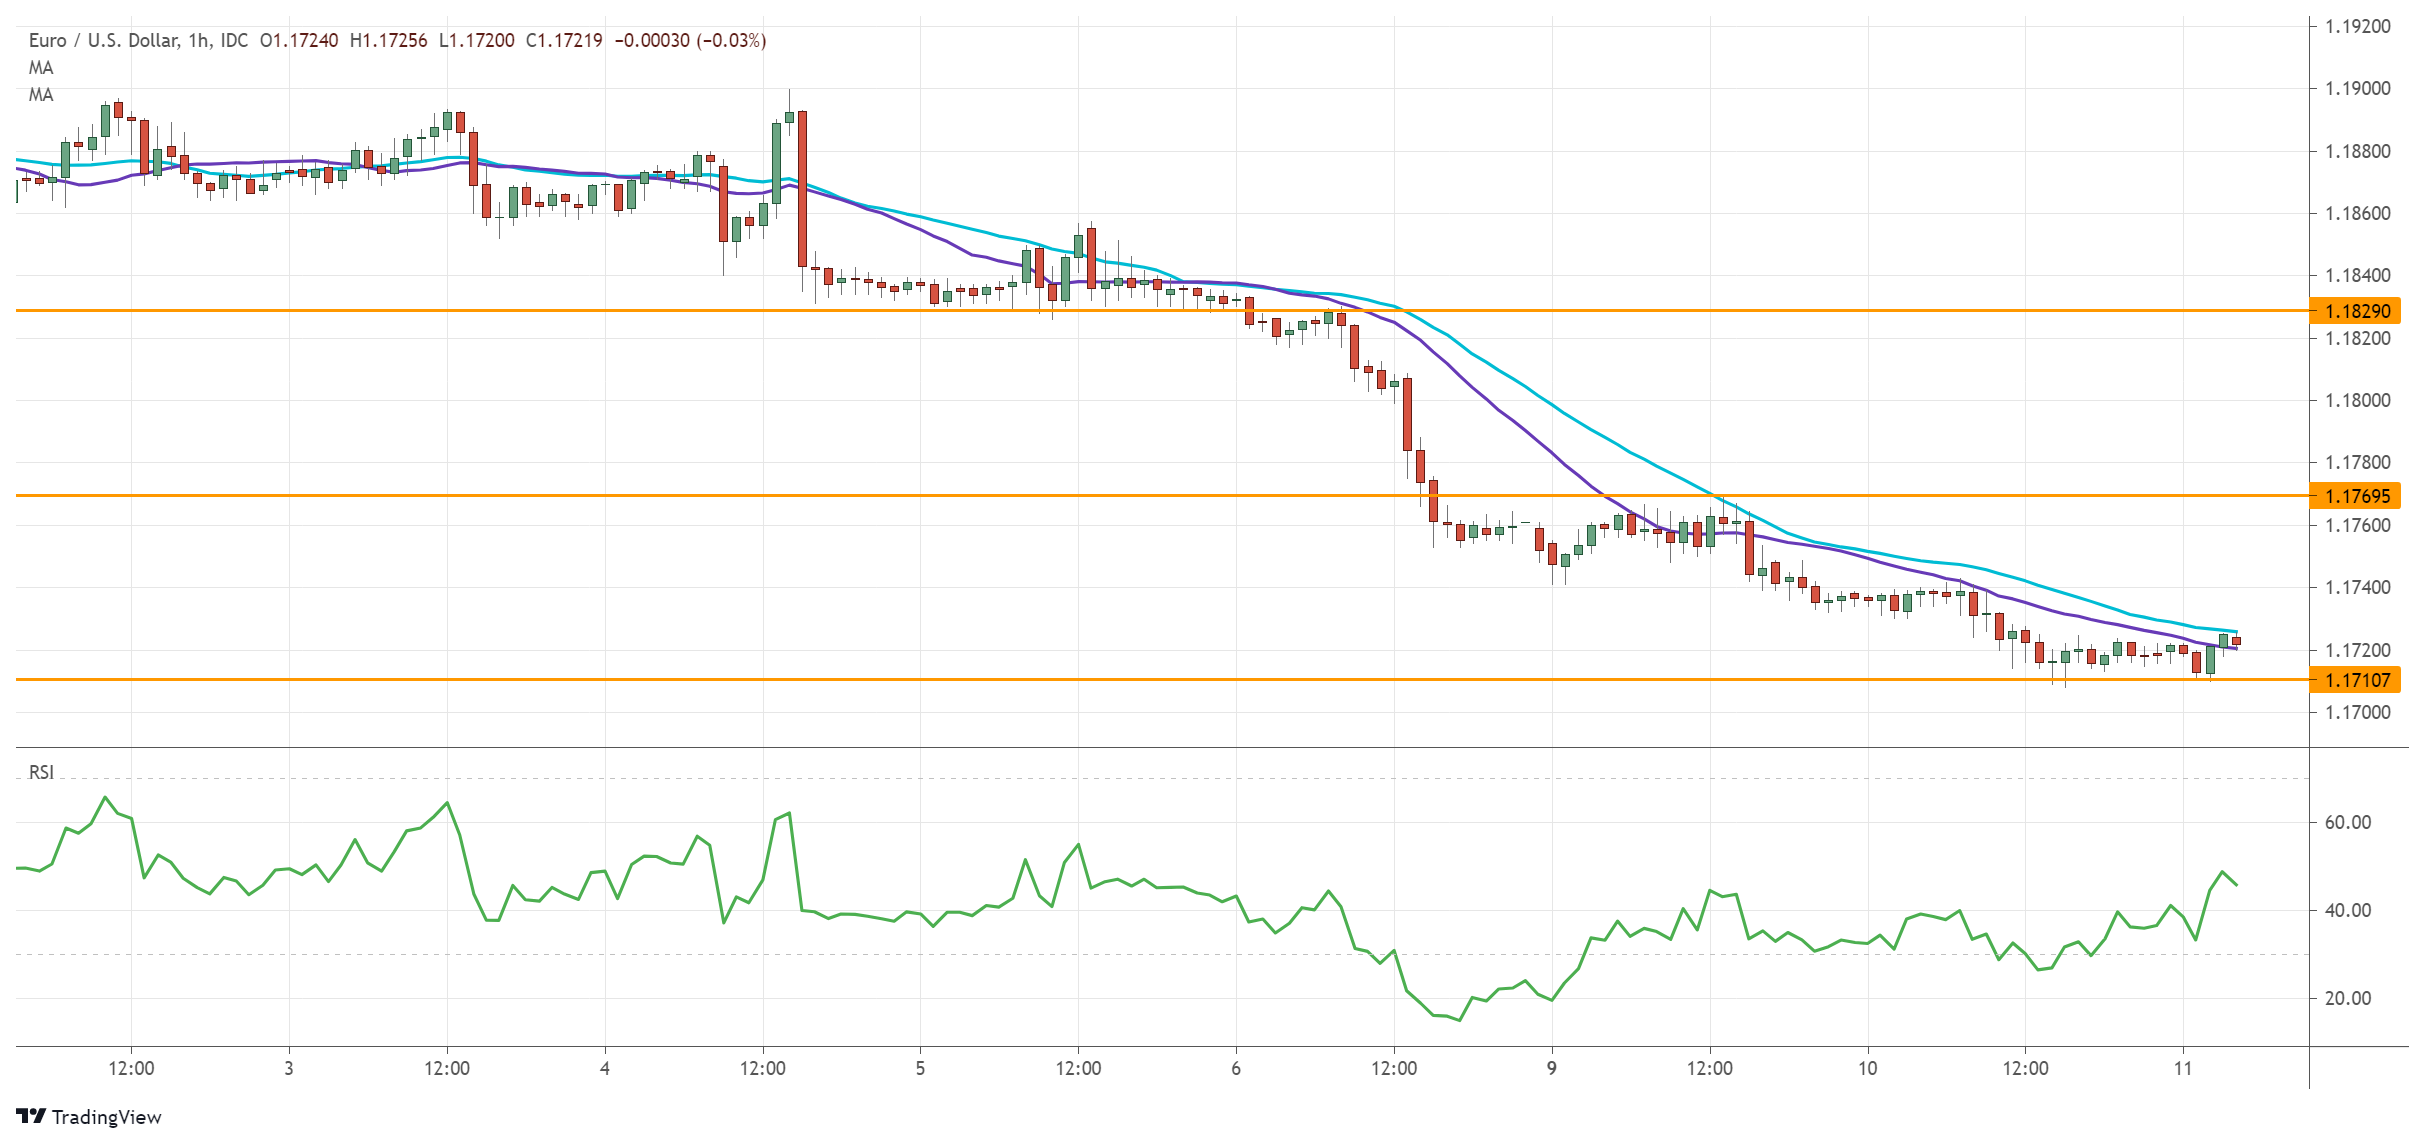
The break below 1.1760 from the daily chart has put buyers on the defensive. Strong inertia in favor of the greenback fuels the bearish ride as momentum traders pile in.
The former support has turned into resistance (1.1770). The euro is testing the next support at 1.1710, where a bearish breakout may extend the sell-off to last November’s low at 1.1600.
Then a reversal could be in the making in the medium term.
US 30 Shoots To New High
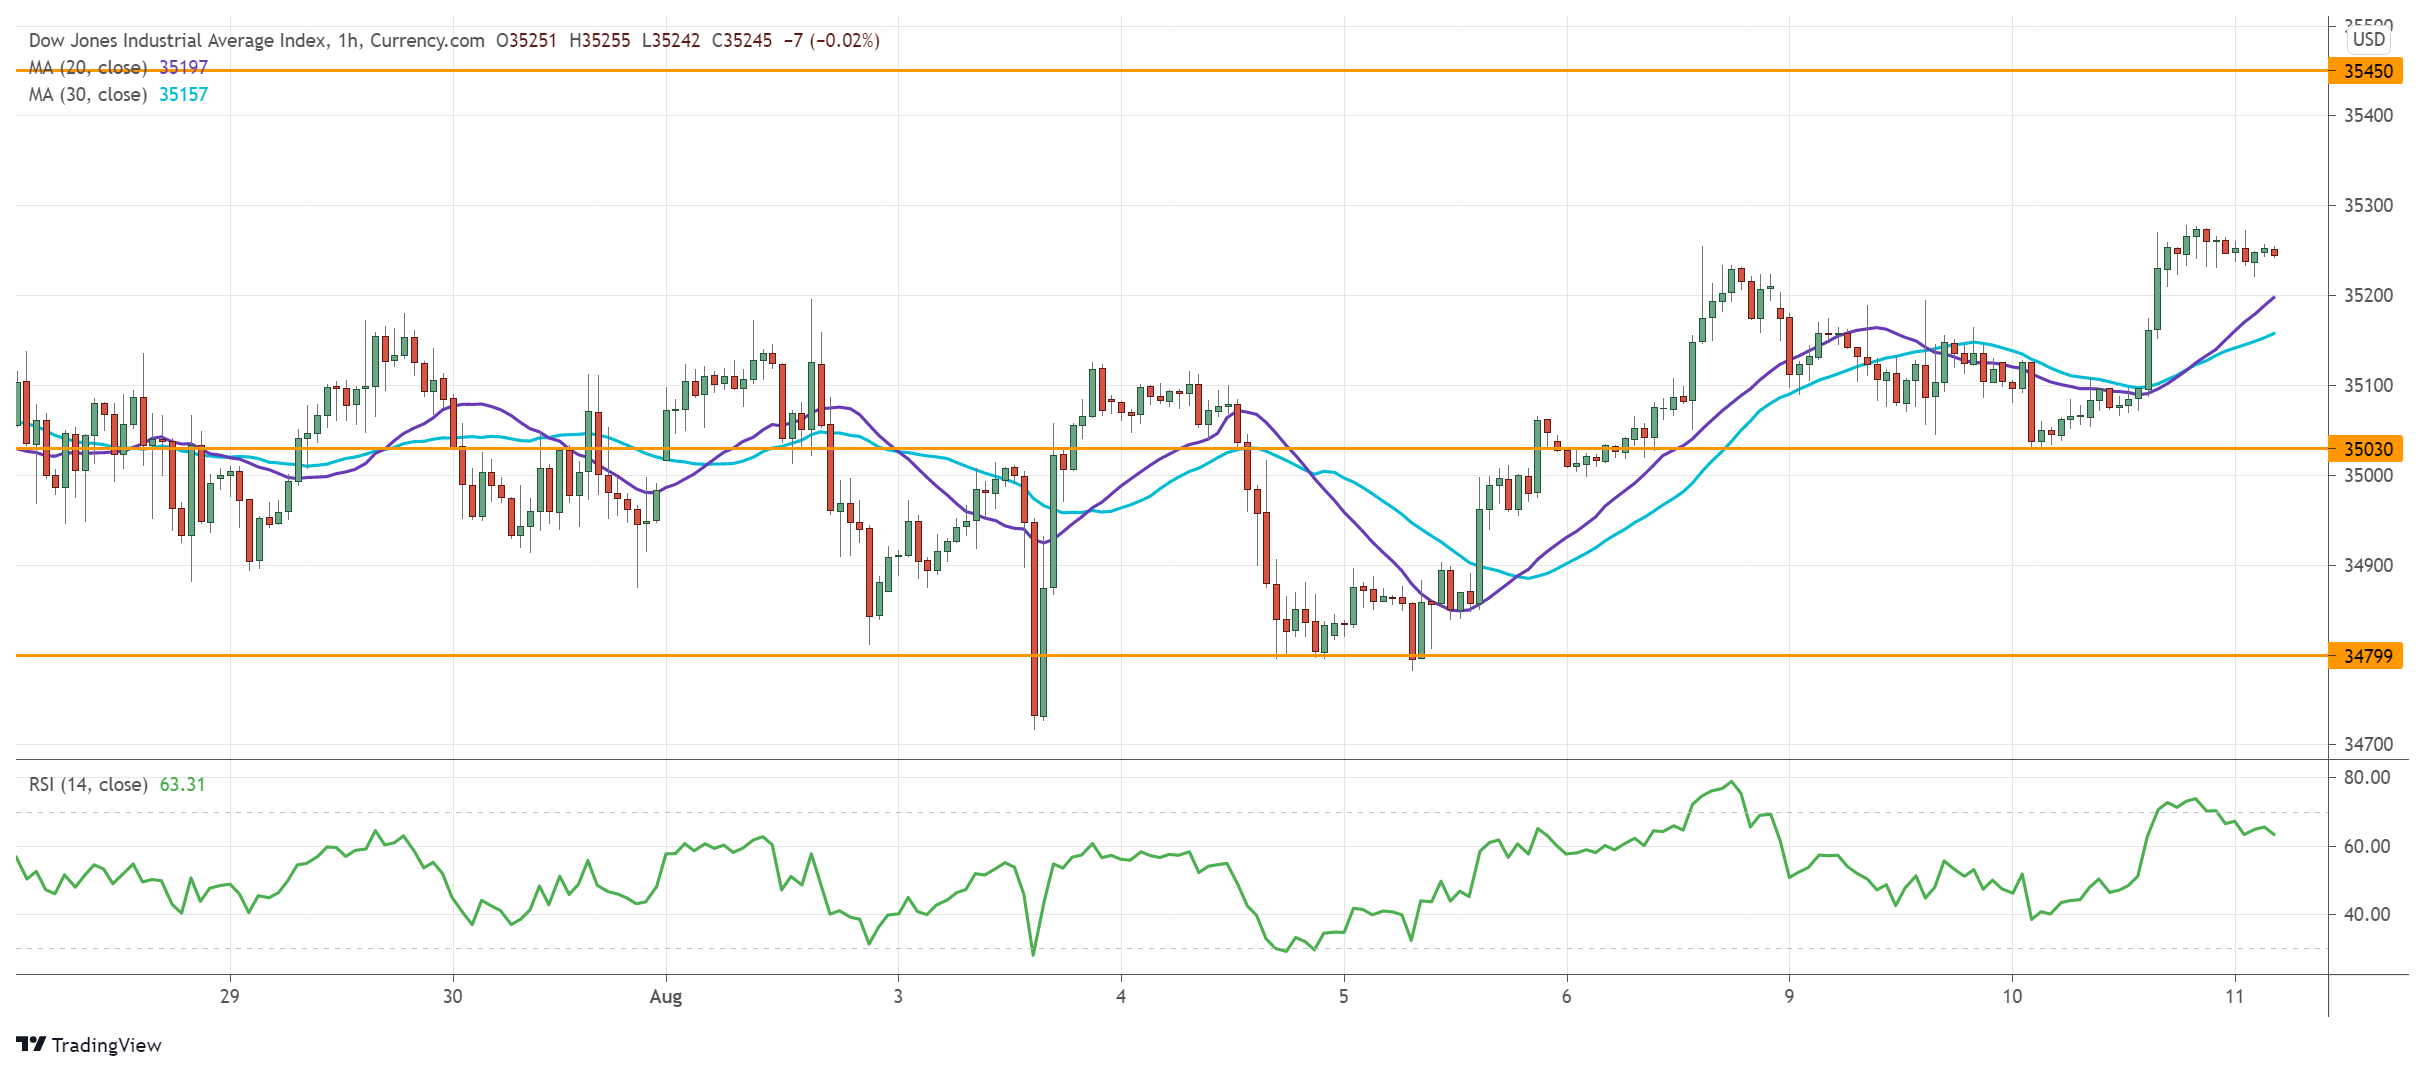
The Dow Jones 30 rose to a record high after the US Senate passed the $1 trillion infrastructure bill. The initial surge above 35100 was a sign of strong buying interest.
The index has then found support at 35030 near the top of the previous consolidation range.
A series of higher highs indicates that the bullish bias is still intact.
The RSI has popped up into the overbought area once again, and a temporary pullback may allow the bulls to raise their stakes. 35500 would be the next stop as the rally picks up steam.
Another Positive US Inflation Surprise May Trigger A Dollar Uptrend
The US dollar has added 1.5% so far this month against a basket of the most popular currencies due to reassessment of the Fed’s monetary policy outlook after healthy macro data. Having gained almost daily since the beginning of last week, the DXY returned to 93, an area of local highs from which it has already reversed downwards twice this year.
From all indications, strong job statistics and increasingly explicit comments from Fed officials about an imminent unwinding form the basis for an extended upward trend in the dollar. However, cautious traders would prefer to see a few confirmations along the way.
Firstly, we shall wait for the index to rise above the 93.5 level, the highs of March. That would confirm an upside exit from the long sideways range and proof of the real strength of the dollar bulls, who had earlier lost power on the way to that area.
Secondly, an important test for the dollar will be today’s release of US consumer inflation for July. Prices are expected to rise by a further 0.5% after a jump of 0.9% in June. The year-over-year rate is forecasted to slow from 5.4% to 5.3%. For the past five months, the data has constantly beaten expectations, surprising economists who, on average, are very good at predicting the rate of price growth. Another “positive” surprise has the potential to be the rock that could set off an avalanche and trigger a mighty dollar uptrend.
If the Fed chooses not to see another acceleration in inflation, it could undermine confidence in the central bank. However, the chances are much higher than the Fed informally looks at inflation as an increasingly long-term potential risk. A strong dollar and tight monetary policy are the available tools to fight long-term inflation.
At the same time, another outcome must not be dismissed: Inflation could come out markedly weaker than expected and start to decelerate sharply. In that case, the debate that the Fed should not rush to curtail stimulus may come back to life. And this could trigger a new downward reversal of the dollar.
BTCUSD And ETHUSD Holds Steady After Strong Coinbase Earnings
US stocks rose to a record high after the Senate passed the $1 trillion infrastructure bill. The Dow Jones jumped by more than 162 points and reached an all-time high of $35,264. The S&P 500 index added 10 points, helped by the energy sector as the price of crude oil stabilized. The materials segment reacted favourably to the infrastructure bill that will see the US invest in roads, bridges, broadband, rail, and other initiatives. Also, stocks rose after favourable corporate earnings. Most companies that have published their results this earnings season have beaten consensus estimates.
Bitcoin and other cryptocurrencies remained steady after strong Coinbase quarterly earnings. The company reported a revenue of more than $2.23 billion, which was higher than the median estimate of $1.78 billion. Its earnings per share rose to $3.45. As a result, its net profit rose to $1.6 billion, which was 4,900% from a year earlier. Of its revenue, $1.9 billion came from transaction revenue while $100 million came from its subscription services. Still, the shares are down by almost 30% from when it went public through direct listing. Bitcoin held steady above $45,000 while Ethereum remained unchanged at $3,100.
The EURUSD remained in under pressure as traders waited for the German and US inflation data. Analysts expect that the headline US inflation rose by 5.3% in July while core CPI rose to 4.3%. If they are right, the two will be slightly lower than the previous 5.4% and 4.5%. In Germany, they expect that the headline CPI rose by 3.8% in July while the harmonised CPI rose by 3.1%. Other important numbers scheduled today will be the EIA inventories report and the Italian inflation data.
EURUSD
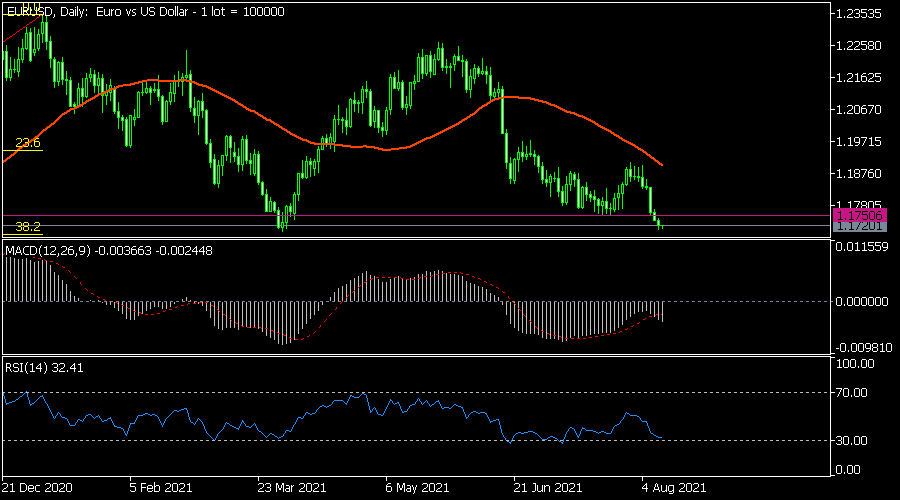
The EURUSD declined to 1.1718, which was the lowest level since March 31. On the daily chart, the pair moved below the 25-day moving average. It also struggled to move below this level in March. The price is also along the 38.2% Fibonacci retracement level while the Relative Strength Index (RSI) has moved to the oversold level. Therefore, the next level to watch will be the 50% Fibonacci retracement level at 1.1485. Still, there is a possibility that a relief rally will happen today.
GBPUSD
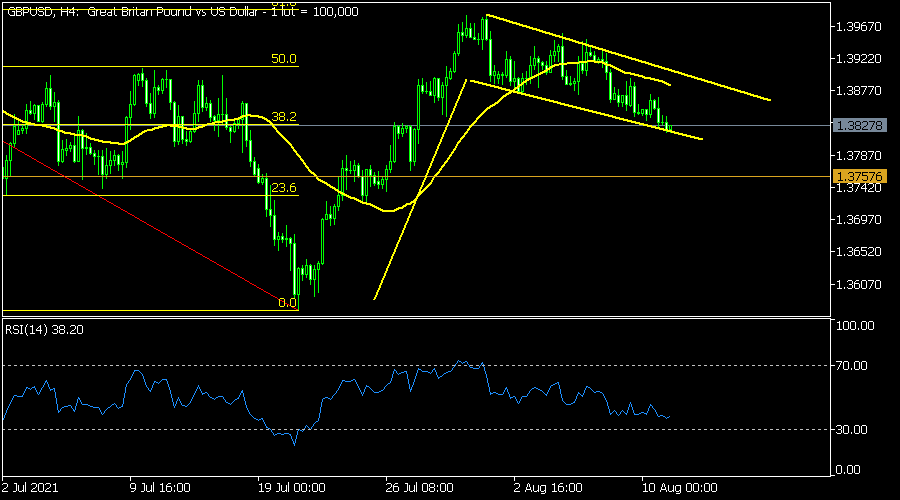
The GBPUSD pair has been in a steep sell-off recently. The pair declined to a low of 1.3827, which was the lowest level since July 29. On the four-hour chart, the pair moved to the 38.2% Fibonacci retracement level. It has also formed a descending channel that seems like a bullish flag pattern. Oscillators like the RSI and MACD have also been in a downward trend. Therefore, while the overall trend is bearish, there is a possibility that the pair will rebound as bulls attempt to reach the 61.8% retracement level at 1.3980.
BTCUSD
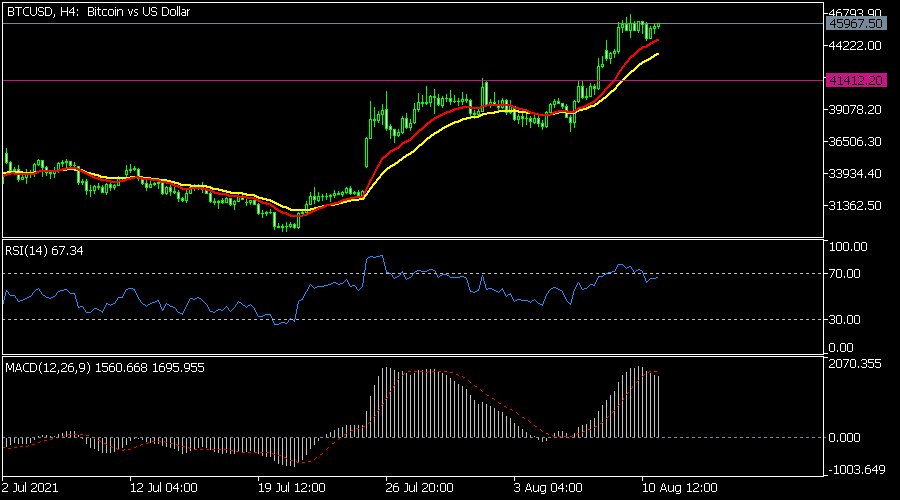
The BTCUSD pair held steady after strong Coinbase earnings. The pair is trading at 45,816, which was slightly below this week’s high of 46,615. On the 4 hour chart, the pair has moved above the key resistance at 41,412. It is also slightly above the 25-day moving average. The pair also seems to be forming a bullish flag pattern. Therefore, the pair will likely break out higher.
GBP/JPY Daily Outlook
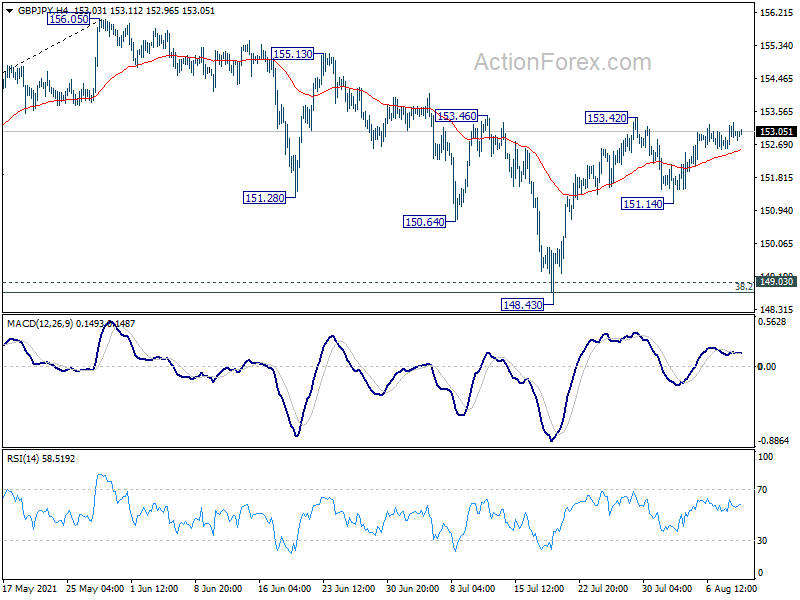
Daily Pivots: (S1) 152.65; (P) 152.99; (R1) 153.34; More...
Intraday bias in GBP/JPY remains neutral as range trading continues between 151.14/153.42. On the upside, break of 153.42/46 resistance will reaffirm the case that correction from 156.05 has completed at 148.43. Intraday bias will be back on the upside for retesting 156.05. On the downside, though, below 151.14 will bring deeper fall back to retest 148.43.
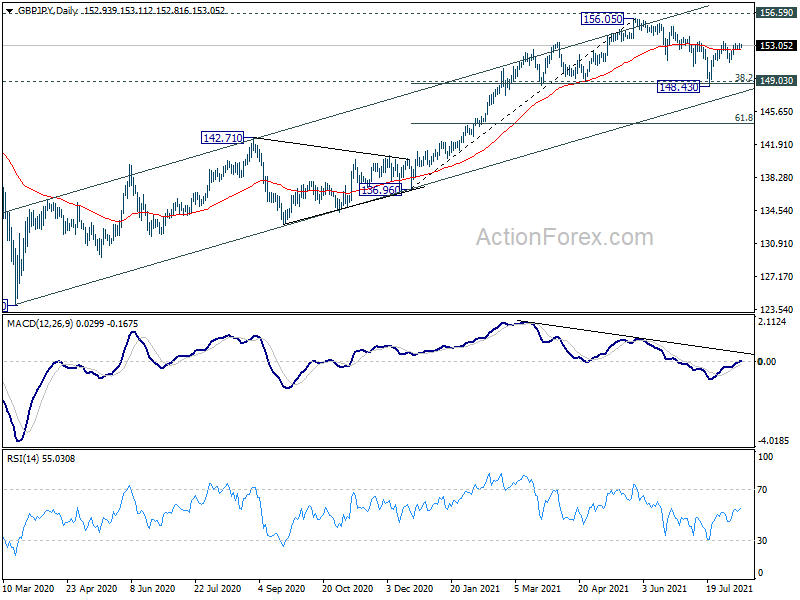
In the bigger picture, rise from 123.94 is seen as the third leg of the pattern from 122.75 (2016 low). Focus remains on 156.59 resistance (2018 high). Sustained break there should confirm long term bullish trend reversal. Next target is 61.8% retracement of 195.86 (2015 high) to 122.75 at 167.93. On the downside, sustained break of 149.03 support, however, will argue that rise from 123.94 has completed. Further break of 142.71 would open up the bearish case for retesting 122.75 low.
EUR/JPY Daily Outlook
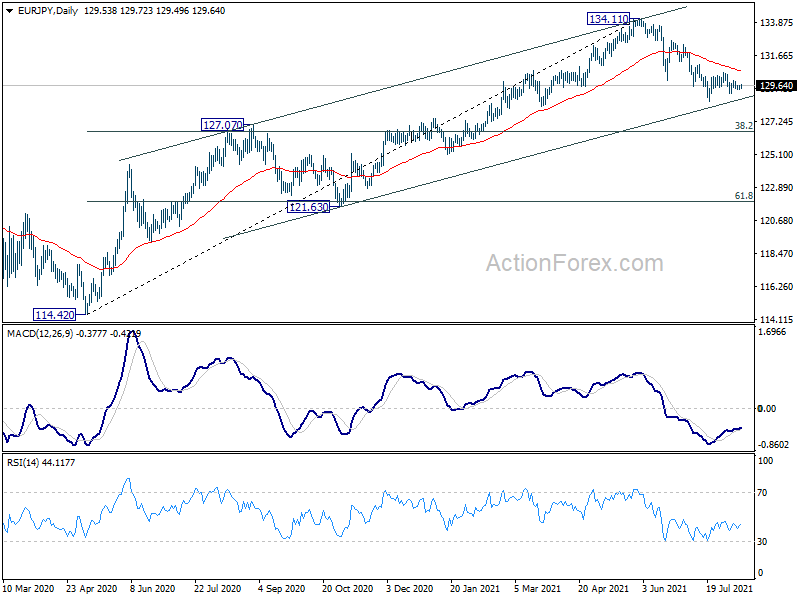
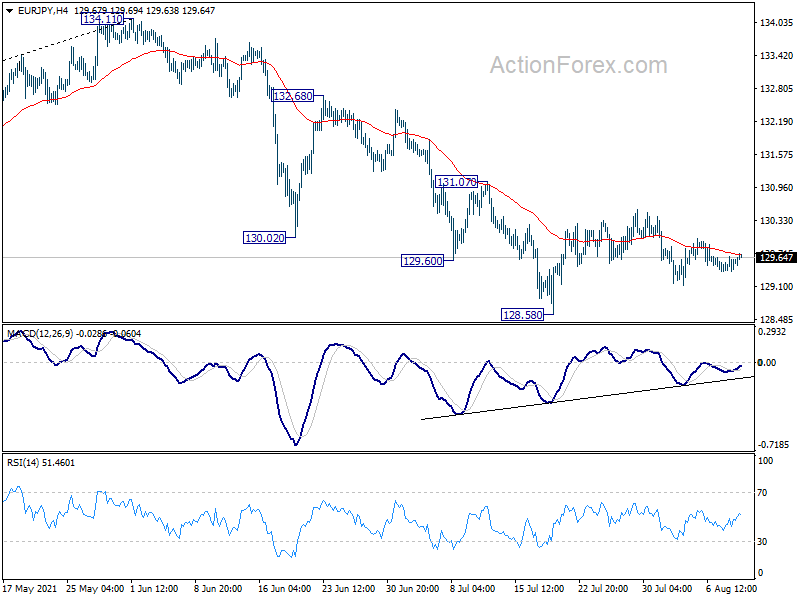
Daily Pivots: (S1) 129.44; (P) 129.57; (R1) 129.72; More....
EUR/JPY is still bounded in consolidation from 128.58 and intraday bias remains neutral first. Outlook stays bearish with 131.07 resistance intact. On the downside, break of 128.85 will resume the fall from 134.11 to 127.07 resistance turned support next. On the upside, break of 131.07 resistance will argue that choppy fall from 134.11 has completed. Intraday bias will be turned back to the upside for 132.68 resistance first.
In the bigger picture, rise from 114.42 is seen as a medium term rising leg inside a long term sideway pattern. As long as 127.07 resistance turned support holds, further rise is still expected to retest 137.49 (2018 high). However, firm break of 127.07 will argue that the medium term trend has reversed, and open up the case for retesting 114.42.