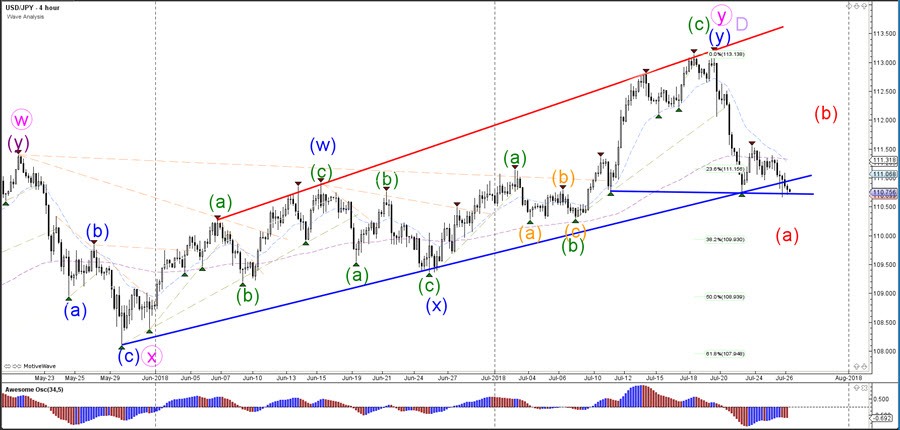
The USD/JPY bearish push lower is indicating that a wave A (red) is most likely still active. Price is now challenging key support trend lines and a breakout could indicate a push lower towards the next Fibonacci level (38.2% Fib).
A bullish bounce however could indicate that wave A (red) has been completed and price could then start an ABC correction within wave B (red). A bearish ABC (red) is expected to complete a larger wave E swing of a larger triangle after price completed wave D (purple) at the recent high.
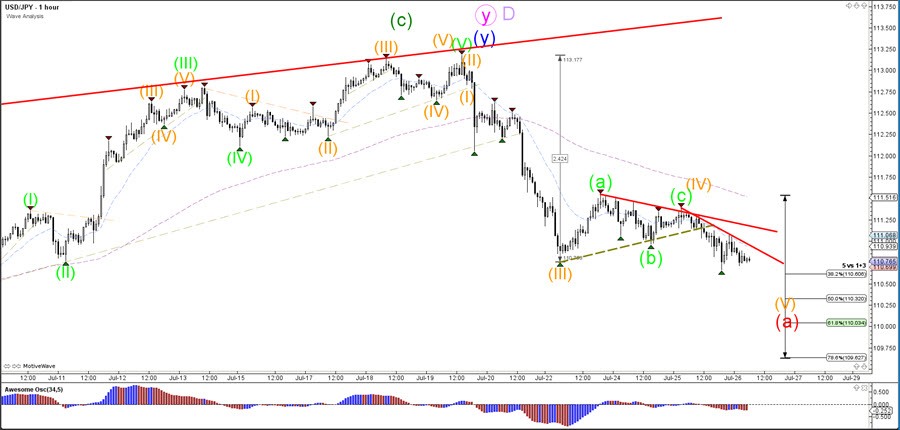
The USD/JPY seems to have completed an ABC (green) sideways correction with wave 4 (orange), which was shallow as it typical for wave 4s. The bearish breakout below the support trend line (dotted green) confirms the bearish continuation within wave 5 (orange) of wave A (red).