
The EUR/USD currency pair
Technical indicators of the currency pair:
Prev Open: 1.15796
Open: 1.16300
% chg. over the last day: +0.46
Day’s range: 1.16138 – 1.16592
52 wk range: 1.0571 – 1.2557
During yesterday’s trading session, the bullish sentiment prevailed on the EUR/USD currency pair. At the moment, the quotes are moving in flat. The technical pattern is ambiguous. Investors expect important economic reports from the United States. Local support and resistance levels are 1.16050 and 1.16300, respectively. Positions should be opened from these marks.
The news feed on the US economy on 2018.09.06:
Preliminary data on the labor market from ADP at 15:15 (GMT+3:00);
The volume of industrial orders at 17:00 (GMT+3:00);
The index of economic activity in the non-manufacturing sector from ISM at 17:00 (GMT+3:00).
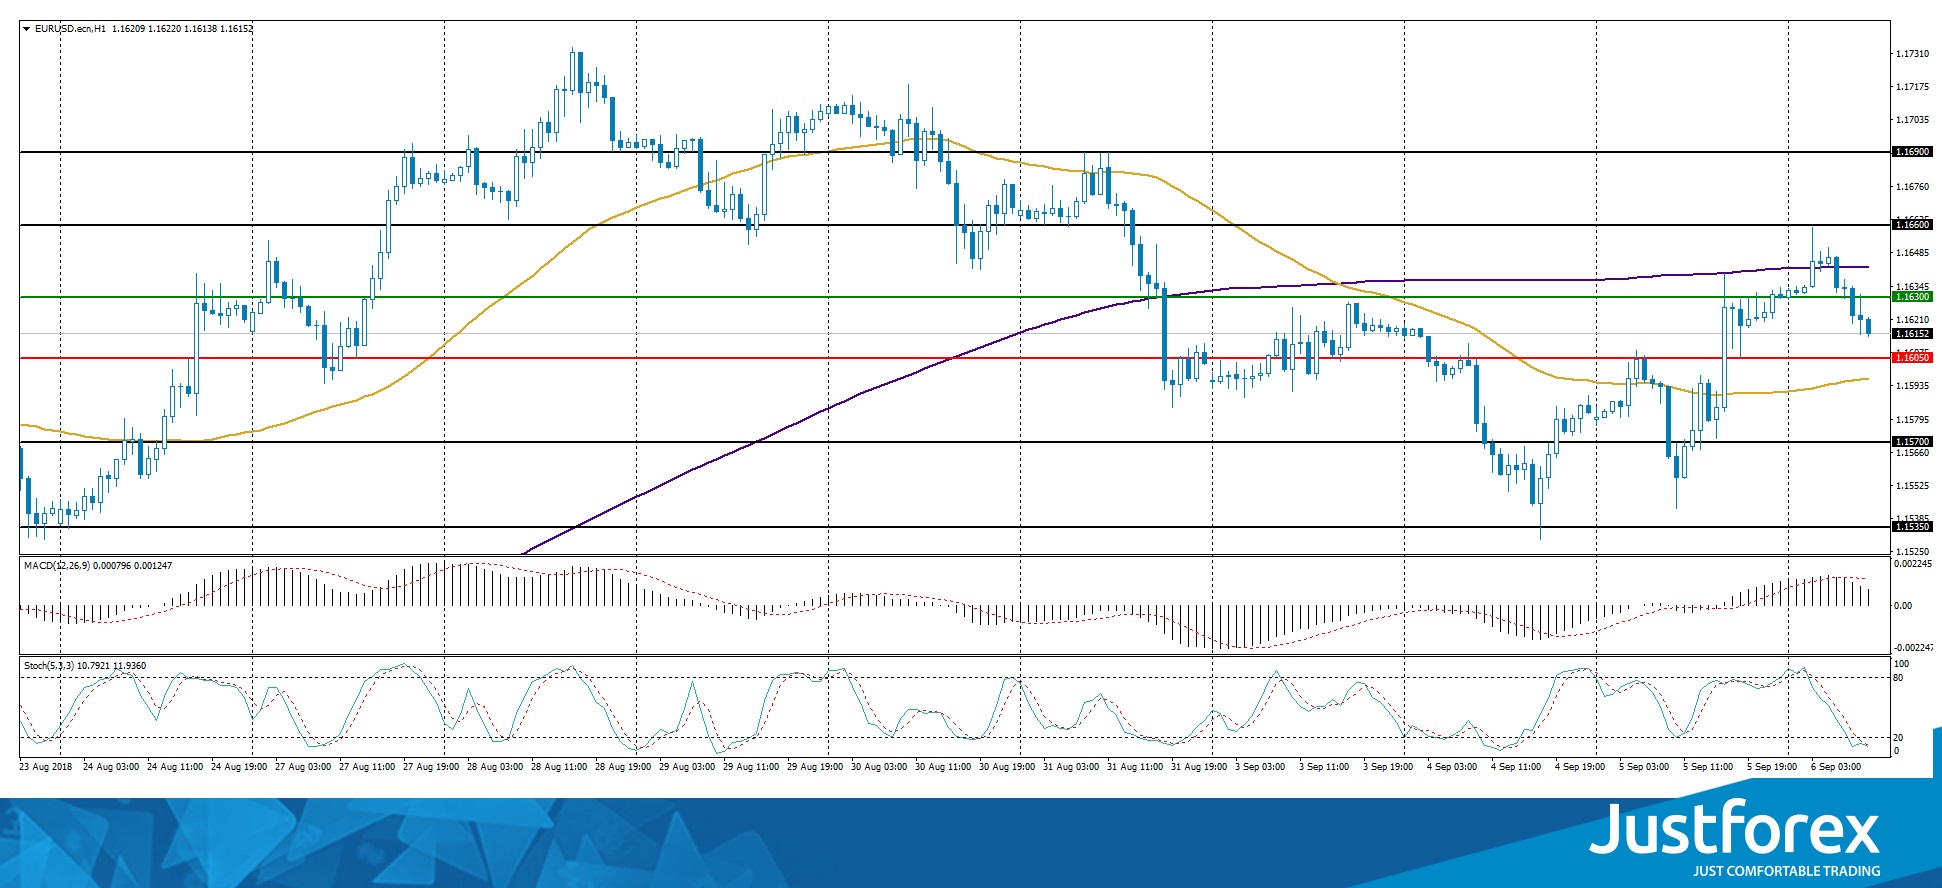
Indicators do not send accurate signals: the price has fixed between 50 MA and 200 MA.
The MACD histogram is in the positive zone, but below the signal line, which gives a weak signal to buy EUR/USD.
Stochastic Oscillator is located in the oversold zone, the %K line has crossed the %D line. There are no signals at the moment.
Trading recommendations
Support levels: 1.16050, 1.15700, 1.15350
Resistance levels: 1.16300, 1.16600, 1.16900
If the price fixes below the local support of 1.16050, the EUR/USD quotes are expected to fall. The movement is tending to 1.15700-1.15400.
Alternative option. If the price fixes above 1.16300, we recommend considering purchases of EUR/USD. The movement is tending to 1.16600-1.16900.
The GBP/USD currency pair
Technical indicators of the currency pair:
Prev Open: 1.28549
Open: 1.29018
% chg. over the last day: +0.45
Day’s range: 1.28917 – 1.29288
52 wk range: 1.2361 – 1.4345
Yesterday, aggressive purchases of GBP/USD were observed. Rumors about the progress of the Brexit negotiations supported the UK currency. According to Bloomberg, Great Britain and Germany agreed on the abolition of key mutual requirements for the process of the country’s exit from the EU. At the moment, the GBP/USD quotes are consolidating in the range of 1.28950-1.29300. The potential for growth remains. We recommend opening positions from the key levels.
The publication of important economic reports from the UK is not planned.
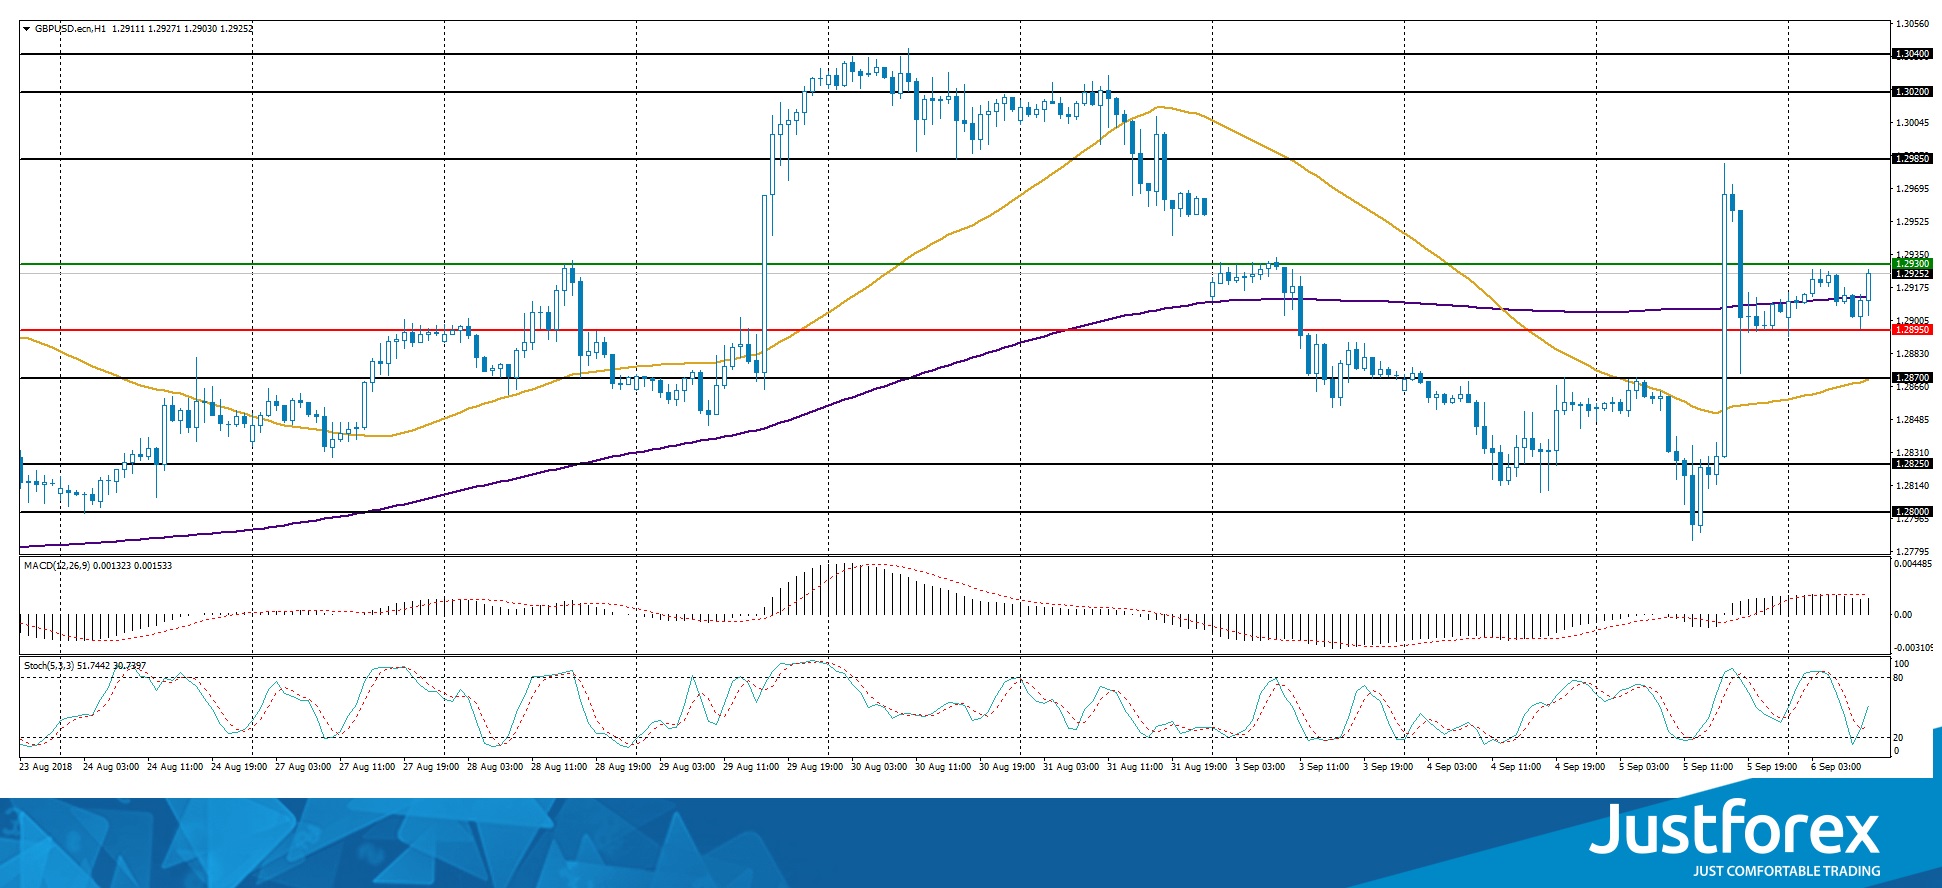
Indicators do not send accurate signals: the price has crossed 50 MA.
The MACD histogram is in the positive zone, but below the signal line, which gives a weak signal to buy GBP/USD.
Stochastic Oscillator is located in the neutral zone, the %K line is above the %D line, which indicates the bullish sentiment.
Trading recommendations
Support levels: 1.28950, 1.28700, 1.28250
Resistance levels: 1.29300, 1.29850, 1.30200
If the price fixes above 1.29300, further growth of the GBP/USD quotes is expected. The movement is tending to 1.29650-1.30000.
Alternative option. If the price fixes below the local support of 1.28950, we recommend considering sales of GBP/USD. The movement is tending to 1.28700-1.28500.
The USD/CAD currency pair
Technical indicators of the currency pair:
Prev Open: 1.31762
Open: 1.31760
% chg. over the last day: -0.10
Day’s range: 1.31639 – 1.31992
52 wk range: 1.2059 – 1.3795
The Bank of Canada, as expected, kept the key interest rate at the previous level of 1.50%. At the moment, the technical pattern on the USD/CAD currency pair is ambiguous. Quotes are in a sideways trend. The key trading range is 1.31600-1.32000. Financial market participants expect new information regarding the NAFTA negotiations. Positions should be opened from the key levels.
The news feed on the economy of Canada is quite calm.
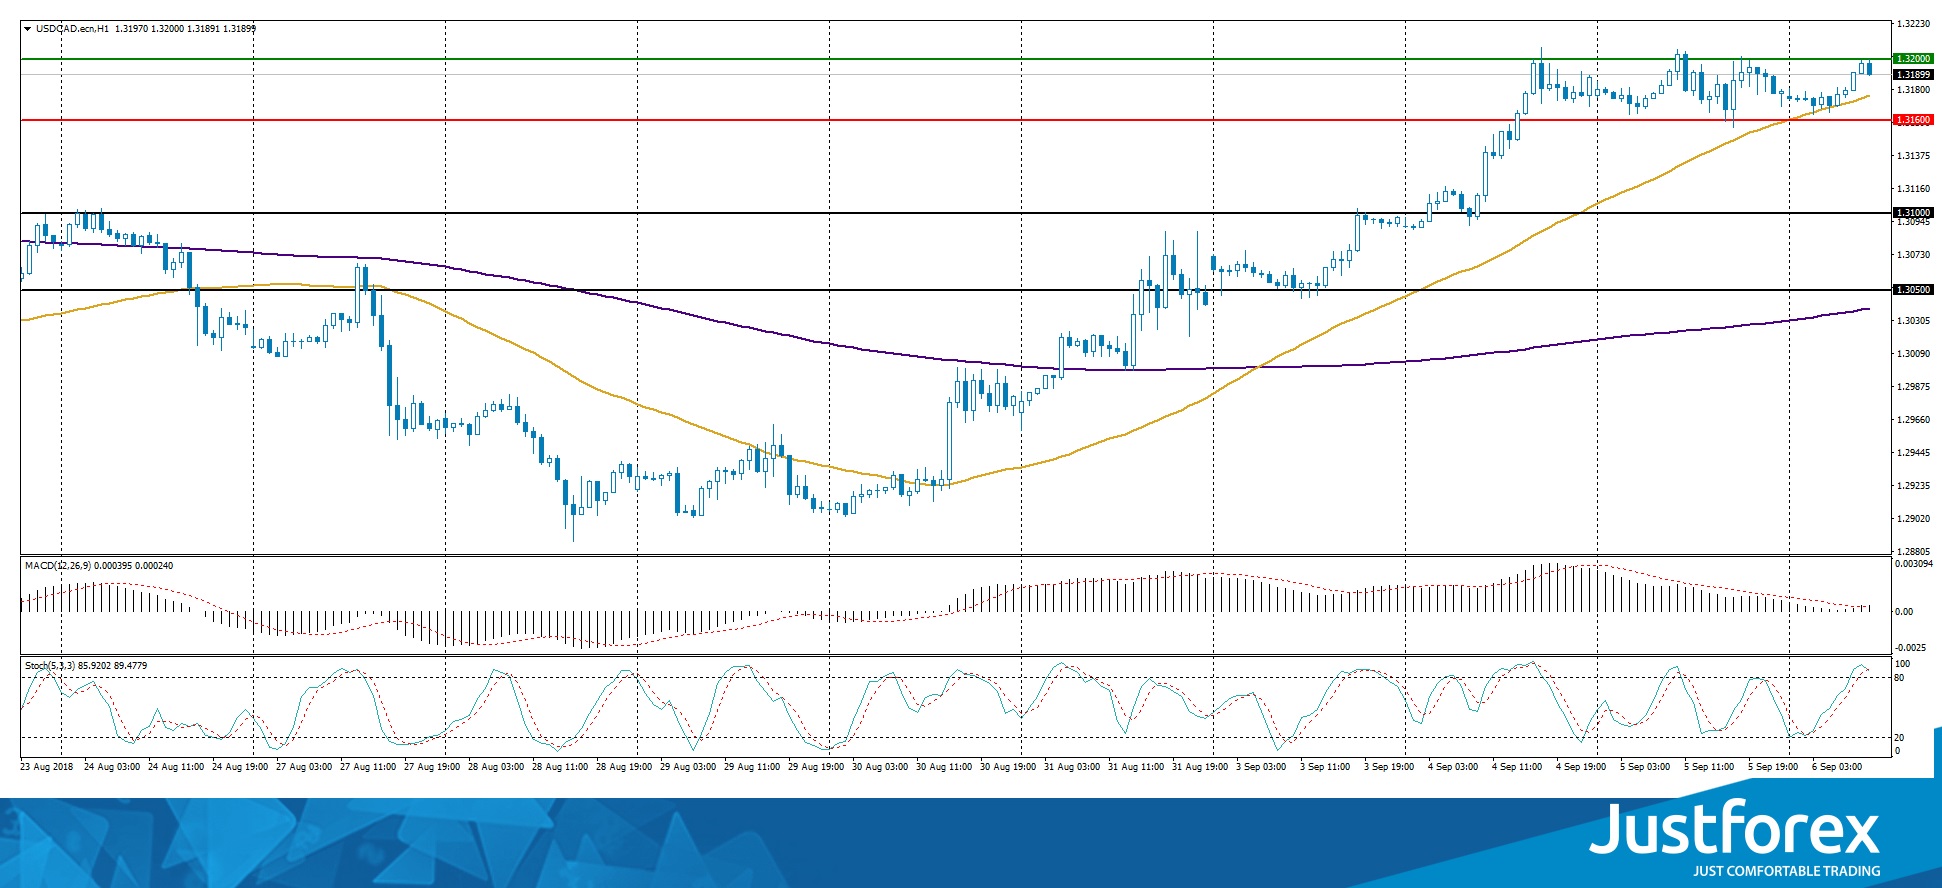
The price has fixed above 50 MA and 200 MA, which signals the power of buyers.
The MACD histogram is in the positive zone and continues to rise, which also signals to buy USD/CAD.
Stochastic Oscillator reached the overbought zone, the %K line is crossing the %D line. There are no signals at the moment.
Trading recommendations
Support levels: 1.31600, 1.31000, 1.30500
Resistance levels: 1.32000, 1.32500
If the price fixes above the round level of 1.32000, further growth of the USD/CAD currency pair is expected. The movement is tending to 1.32400-1.32600.
Alternative option. If the price fixes below the local support of 1.31600, the USD/CAD quotes are expected to correct. The target level for profit-taking is 1.31300-1.31000.
The USD/JPY currency pair
Technical indicators of the currency pair:
Prev Open: 111.313
Open: 111.528
% chg. over the last day: +0.03
Day’s range: 111.171 – 111.528
52 wk range: 104.56 – 114.74
The technical pattern on the USD/JPY currency pair is still ambiguous. Quotes are consolidating. The trading instrument is testing local support and resistance levels: 111.250 and 111.450, respectively. Investors expect important economic reports from the United States. We recommend following the current information on the trade conflict between the US and China. Positions should be opened from the key levels.
The news feed on the economy of Japan is calm.
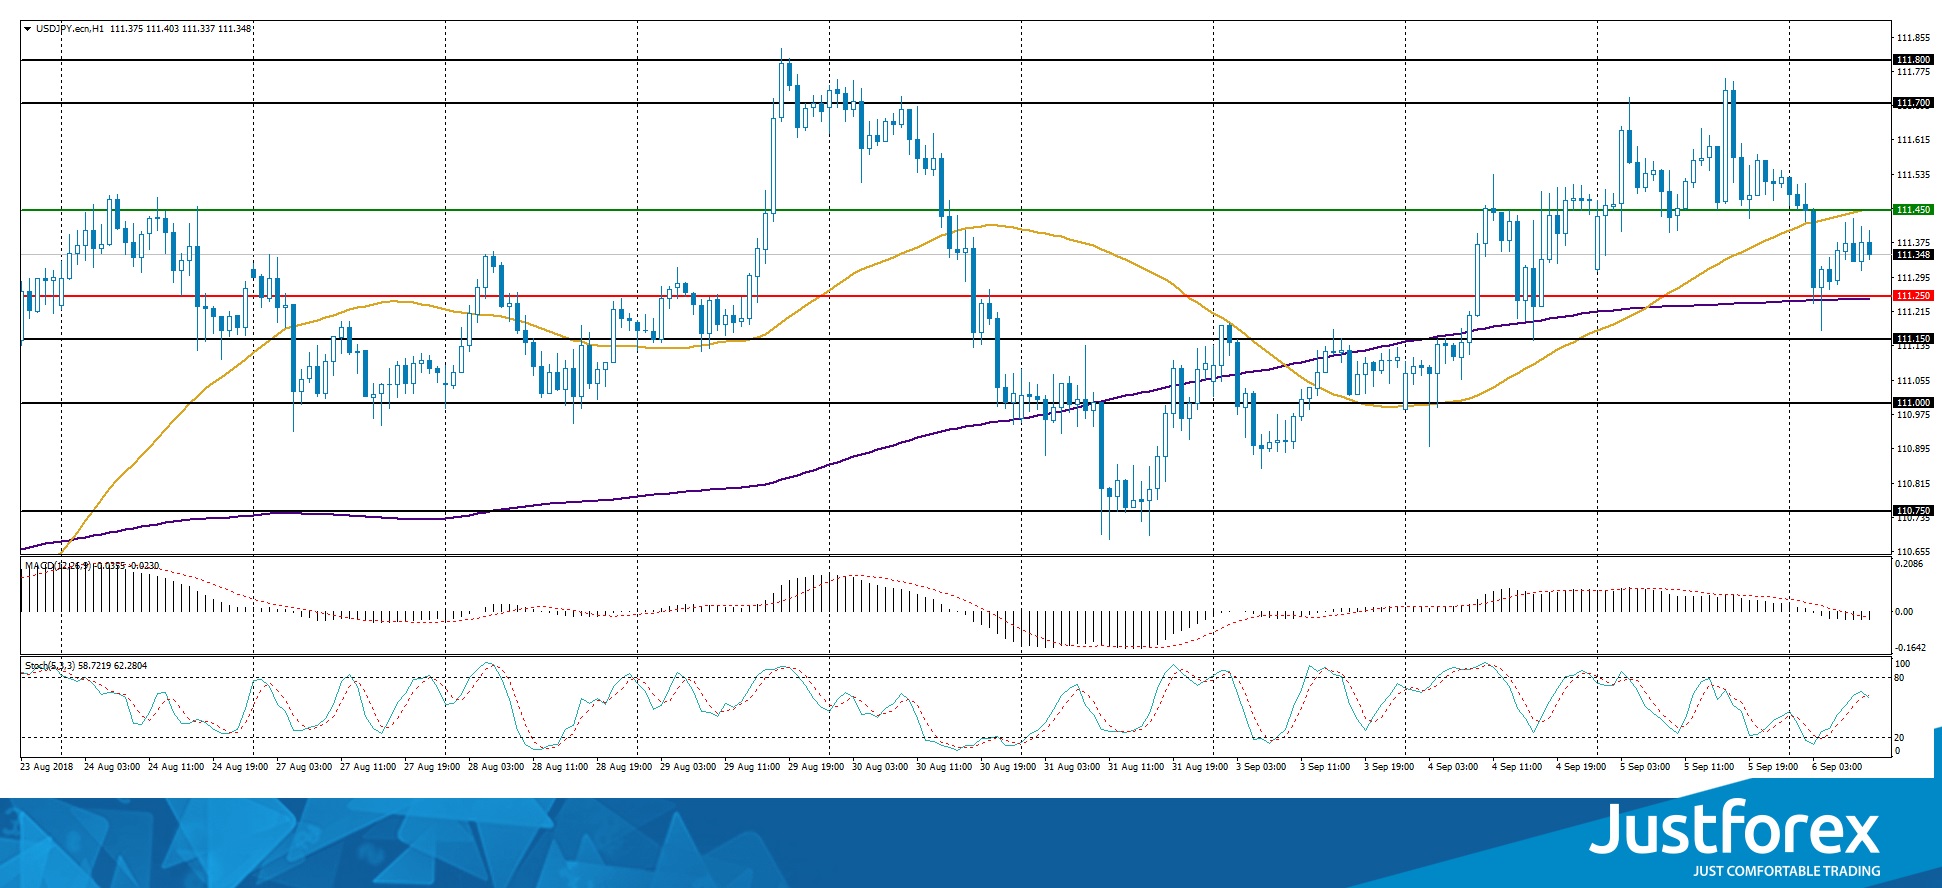
The price has fixed between 50 MA and 200 MA, which are strong dynamic support and resistance levels.
The MACD histogram has moved into the negative zone, which signals the bearish sentiment.
Stochastic Oscillator is located in the neutral zone, the %K line is crossing the %D line. There are no signals at the moment.
Trading recommendations
Support levels: 111.250, 111.000, 110.750
Resistance levels: 111.450, 111.700, 112.000
If the price fixes above the resistance level of 111.450, the USD/JPY currency pair is expected to grow. The movement is tending to 111.700-112.000.
Alternative option. If the price fixes below the level of 111.250, it is necessary to consider sales of USD/JPY. The movement is tending to 111.000-110.750.


