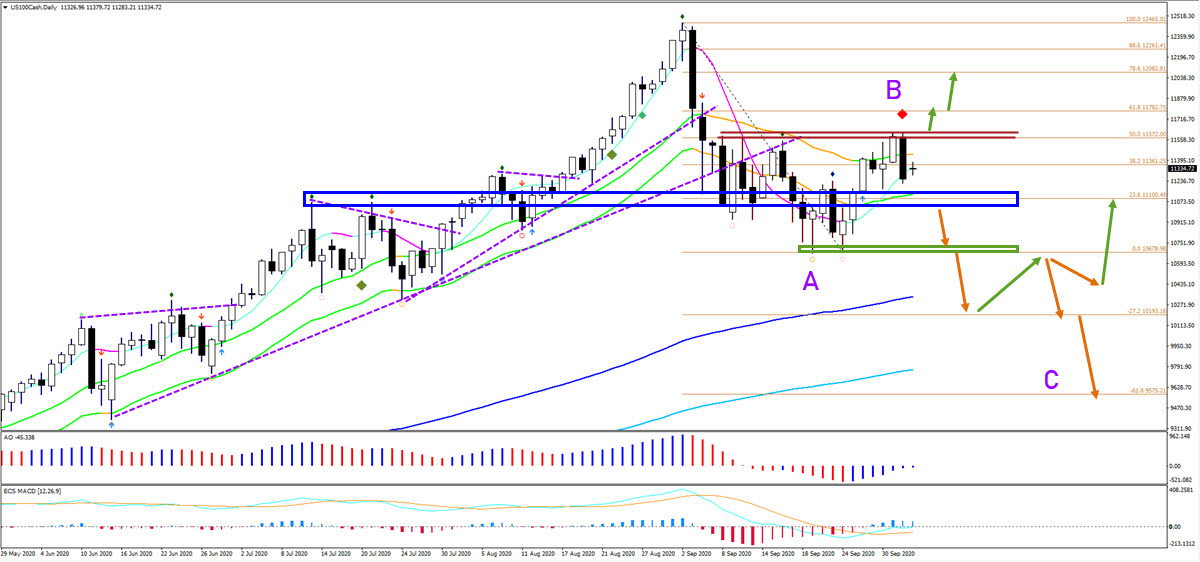
The Nasdaq 100 (NQ) stock index is struggling at the 50% Fibonacci retracement level. The bearish daily candle also shows a bearish engulfing twin candlestick pattern. Will the NQ make a larger reversal?
Price Charts and Technical Analysis
In our eyes, a bearish retracement has the best odds at the moment. There are multiple aspects that give the bears an upper hand at the moment. The Nasdaq also confirmed a bearish turn on the ecs.MACD (red diamond). The bearish drop was impulsive and also clearly broke below the 21 ema support zone. This makes it more likely that a bearish ABC (purple) pattern is unfolding. What would confirm this outlook? The key support zone is the bottom of the 21 ema and the previous support levels (blue box). A bearish breakout below that should send NQ towards the Fibonacci targets within wave C (purple). Only a break above the previous tops (red lines) could start a push up.
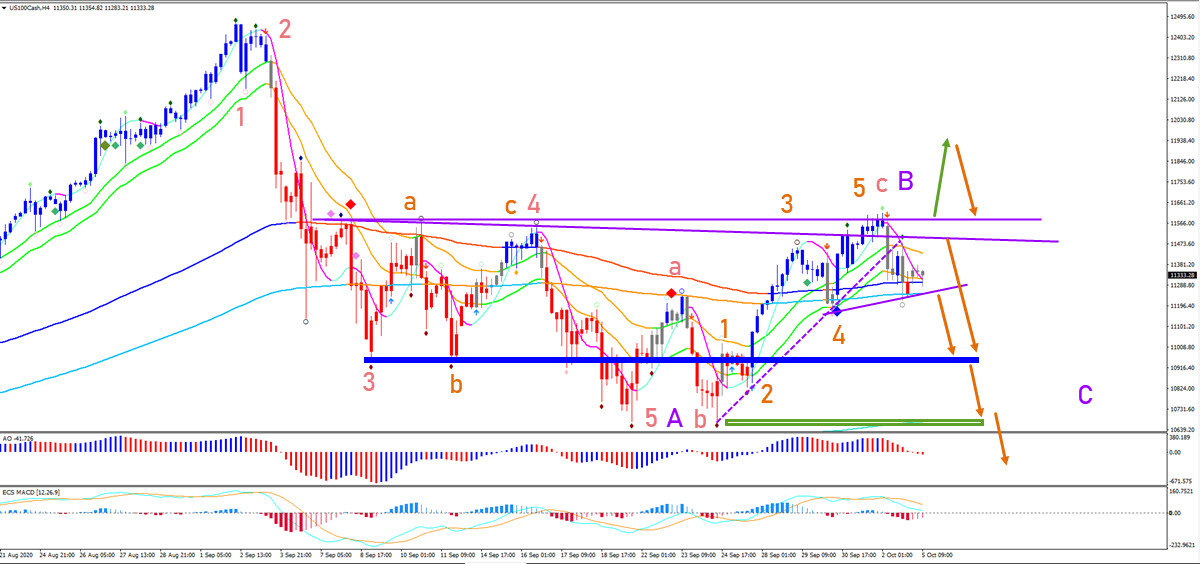
The 4 hour chart is showing good evidence of a completed wave 5 (orange) of wave C (red) of wave B (purple). But the price action does need to break below the support Fractals at the long-term moving averages (purple) line. Also a retest of the previous resistance could indicate a bearish bounce and turn down. The support zones (blue and green boxes) also remain key levels to break.