
Or more to go?
Oil prices are on the rise again after a correction over the last month but how much support does it now have?
It didn’t take long for oil to rebound after the US, China, India, Japan, UK and South Korea announced their coordinated SPR release. A sign that the market had fully priced in the announcement, perhaps even that it isn’t the game-changer it was sold to be.
The bigger threat to oil prices is lockdowns and restrictions, as we’re now seeing emerge again in Europe and that could potentially cap prices in the near term. Unless, of course, OPEC+ responds in kind to the actions of the consuming countries.
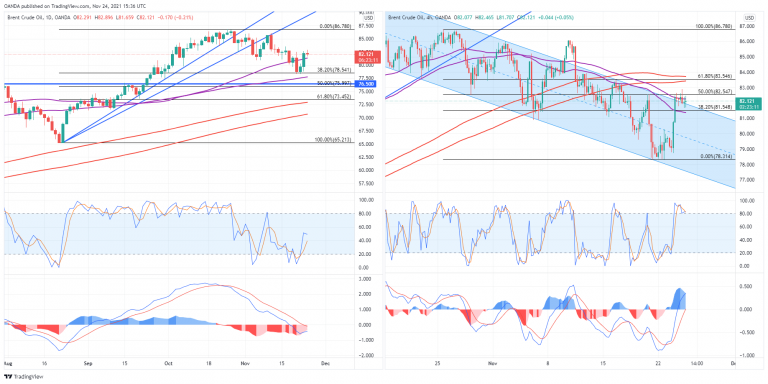
Brent rebounded off $78.50 initially, where the 38.2 fib – August lows to October highs – combines with prior resistance and the lower end of the 55/89-day SMA . If this is only a shallow correction, that would be a bullish signal for the market.
Brent is currently struggling around $82.50 with the 50 fib level – October highs to November lows – providing significant resistance. The next test above is $83.50 where the 61.8 fib combines with the 200/233-period SMA on the 4-hour chart.
A move above here would be another bullish signal for crude. A move below $78.50 and $76 becomes key, with a combination of support making it a big test to the downside.


