
Key Highlights
- Bitcoin price struggled to clear the $64,000 resistance zone.
- BTC faced hurdles near a key bearish trend line at $64,200 on the 4-hour chart.
- Oil prices rallied toward $78.80 before the bears appeared.
- EUR/USD is consolidating losses above the 1.0950 zone.
Bitcoin Price Technical Analysis
Bitcoin price started a decent upward move above the $62,000 resistance zone. BTC/USD climbed above the $63,500 resistance before it faced hurdles.
Looking at the 4-hour chart, the price settled above the 200 simple moving average (green, 4 hours) and traded toward the $64,500 resistance zone. It faced resistance near the 61.8% Fib retracement level of the downward move from the $66,456 swing high to the $59,825 low.
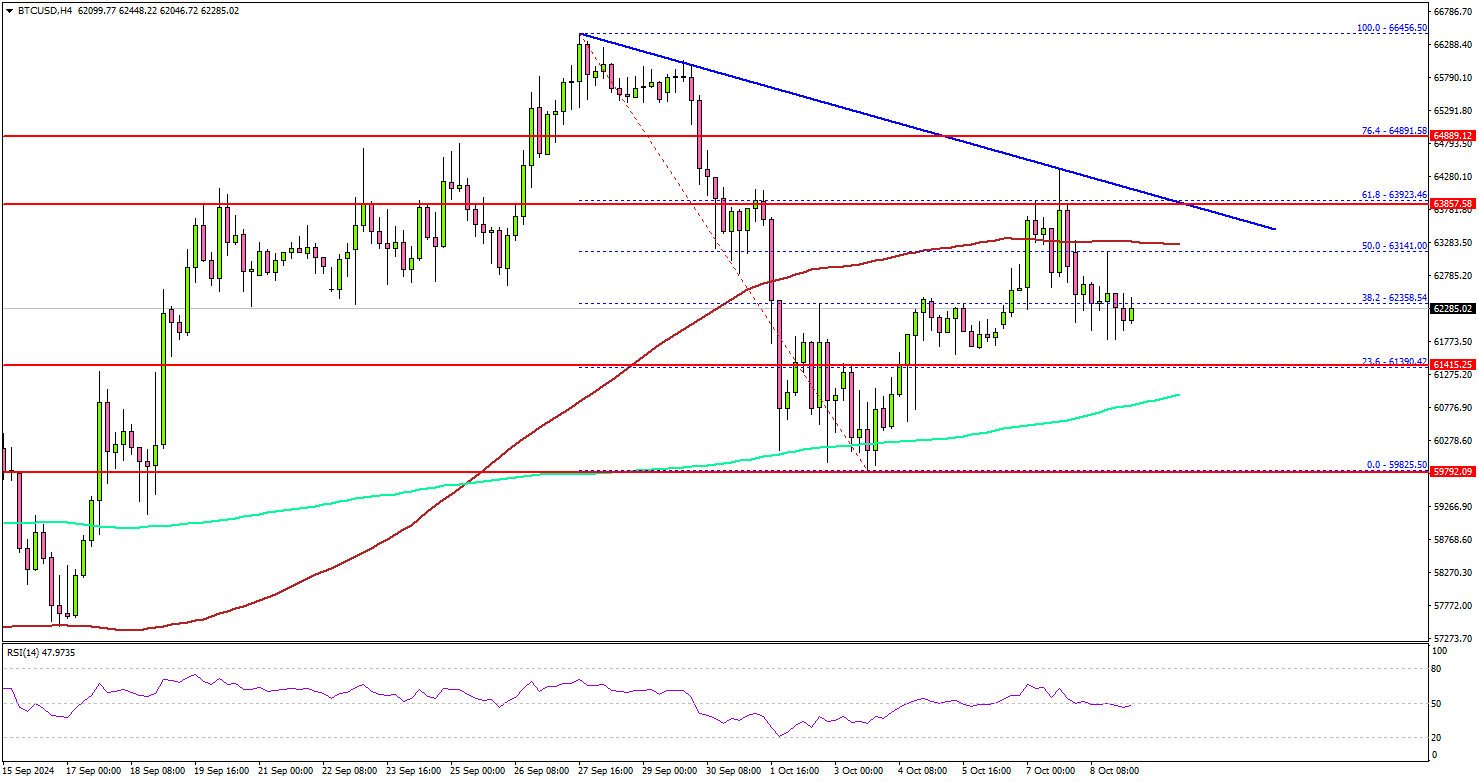
The price faced hurdles near a key bearish trend line at $64,200 on the same chart. There was no convincing close above the 100 simple moving average (red, 4 hours).
The price corrected gains and declined below the $63,500 level. Immediate support is near the $62,200 level. The next key support sits at $61,400. A downside break below $61,400 might send Bitcoin toward the $60,500 support. Any more losses might send the price toward the $60,000 support zone.
On the upside, the price could face resistance near the $63,250 level. The next key resistance is at $64,500. A successful close above $64,500 might start another steady increase. In the stated case, the price may perhaps rise toward the $65,500 level.
Looking at EUR/USD, the pair saw a lot of bearish moves, and recently started a consolidation phase above the 1.0950 support.
Today’s Economic Releases
- FOMC Meeting Minutes.


