


Key Highlights
- USD/JPY started a fresh increase above 163.20 and 163.50.
- A key bullish trend line is forming with support at 163.00 on the 4-hour chart.
- EUR/USD is struggling below the 1.1450 resistance zone.
- WTI Crude Oil prices rallied further above $92.00 and $92.50.
USD/JPY Technical Analysis
The US Dollar started a fresh increase from 162.65 against the Japanese Yen. USD/JPY cleared the key hurdle at 163.20 to enter a bullish zone.
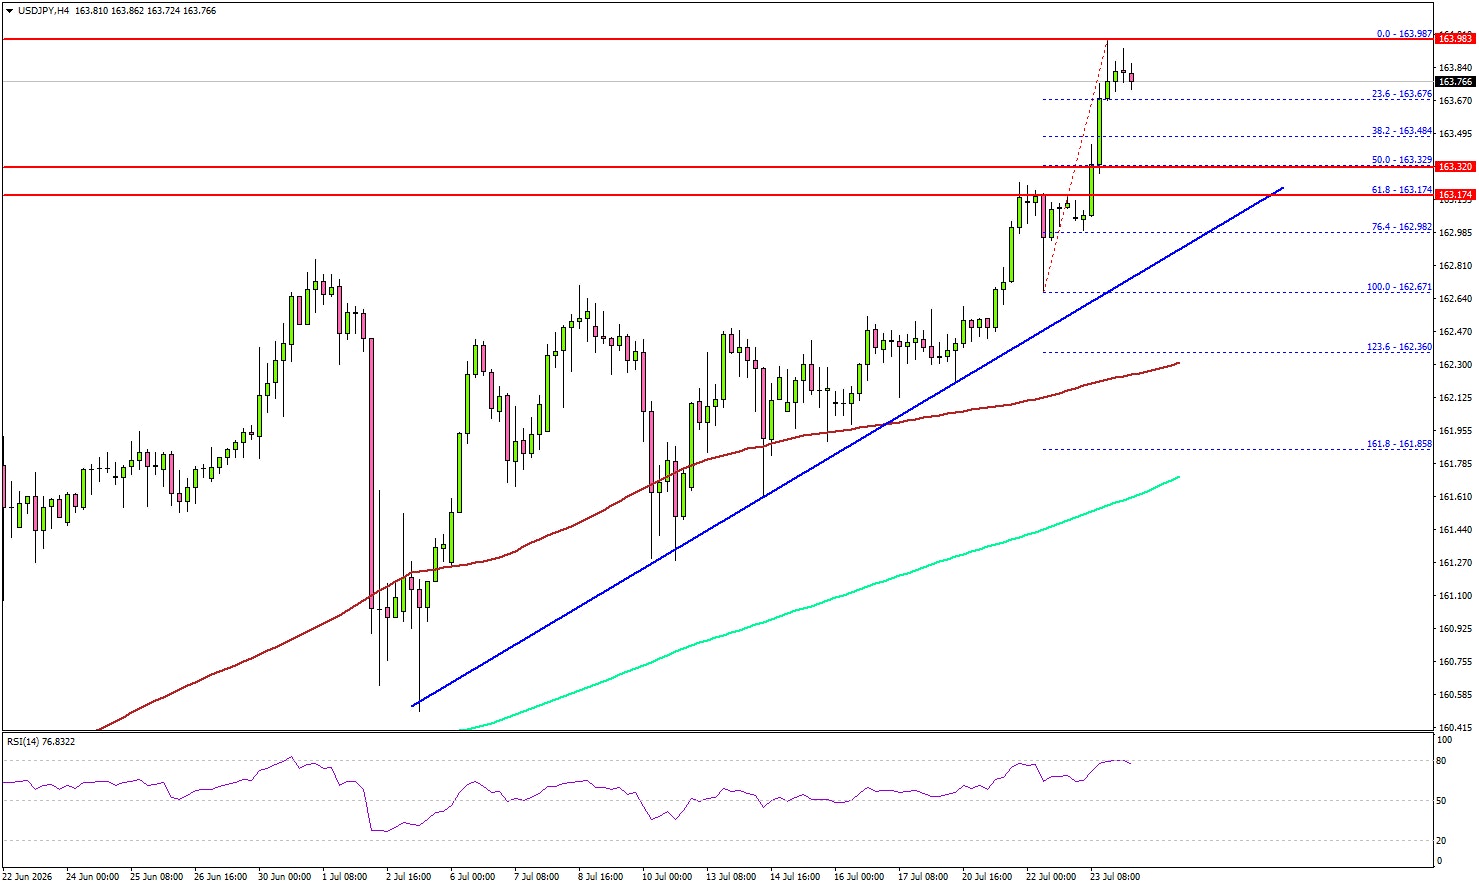
Looking at the 4-hour chart, the pair settled above 163.20, the 100 simple moving average (red, 4-hour), and the 200 simple moving average (green, 4-hour). The pair traded as high as 163.98 and started a consolidation phase.
On the upside, the pair could face resistance near 164.00. The next major resistance might be 164.40. A close above 164.40 could start another steady increase.
In the stated case, the bulls could aim for a move to 165.00. Any more gains might open the doors for a test of 165.20. If there is a downside correction, the pair might find bids near 163.50. The first major support could be near 163.20.
The main support might be 163.00. There is also a key bullish trend line forming with support at 163.00. A downside break and close below 163.00 might send the pair toward the 100 simple moving average (red, 4-hour) at 162.30. Any more losses could open the doors for a test of 162.00.
Looking at WTI Crude Oil, the bulls remained in action, and they might soon aim for a move above the $95.00 level.
Upcoming Key Economic Events:
- US S&P Global Manufacturing PMI for June 2026 (Preliminary) – Forecast 54.5, versus 53.9 previous.
- US S&P Global Services PMI for June 2026 (Preliminary) – Forecast 51.0, versus 51.2 previous.





