
Dow Jones: ⬇️ Sell
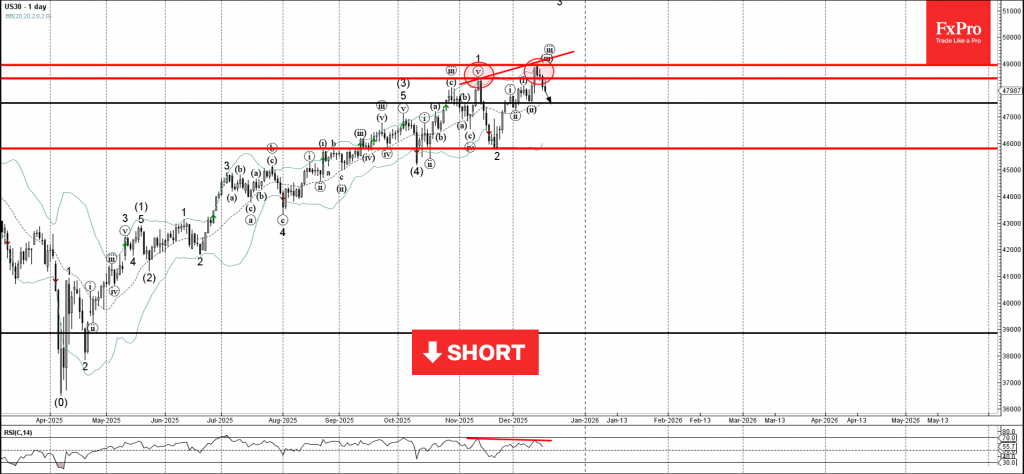
- Dow Jones reversed from resistance level 49000.00
- Likely to fall to support level 47525.00
Dow Jones index recently reversed from the resistance area between the resistance level 49000.00 and the upper daily Bollinger Band.
The downward reversal from this resistance area stopped the previous minor impulse waves iii and 3.
Given the strength of the resistance level 49000.00 and the bearish divergence on the daily RSI indicator, Dow Jones index can be expected to fall further to the next support level 47525.00 (low of the previous correction ii).


