
Global markets entered a transitional phase as investors moved from outright panic toward cautious observation. After several sessions of heavy selling triggered by the escalation of Middle East conflicts, equities staged a meaningful relief rally during the Asian session. The rebound largely followed the pattern seen on Wall Street overnight, where U.S. equities managed a late-session recovery after earlier losses.
South Korea’s Kospi led the rebound, surging more than 10% after suffering its worst single-day collapse on record the previous session, when it plunged roughly 12%. Japan’s Nikkei also joined the recovery, climbing more than 2% as sentiment improved across regional markets. Despite the strong rebound, the move should not yet be interpreted as a definitive bullish turn. Instead, it reflects a classic relief rally after a period of panic-driven liquidation, as markets transition from shock toward a more measured assessment of the evolving geopolitical situation.
Investors appear to be gradually accepting that the Middle East conflict may not be resolved quickly. Rather than focusing on worst-case scenarios, markets are beginning to price in a baseline expectation that tensions could persist for some time. Paradoxically, this shift from uncertainty to a more defined outlook can stabilize markets. While prolonged conflict implies higher energy prices and potential supply chain disruptions, having a clearer framework allows investors to evaluate risks more systematically.
Adding to the improved tone were reports suggesting possible diplomatic backchannels between the United States and Iran. Although a formal ceasefire remains far from certain, even the suggestion that negotiations might be taking place has helped calm market nerves.
Nevertheless, the energy market continues to signal that the geopolitical problem is far from resolved. WTI crude remains elevated near the 78 level, reflecting the persistent war premium embedded in oil prices. For now, the key threshold appears to be the psychological 80 level. As long as oil prices remain contained below that mark, investors may interpret the situation as manageable rather than the start of a broader global energy crisis.
Sentiment has also been supported by solid economic data. In particular, February’s strong ISM Services reading suggests the U.S. economy may be regaining momentum at the start of the year, reinforcing the narrative of continued economic resilience. While stronger data reduces the likelihood of near-term Fed rate cuts, markets appear comfortable with that trade-off. Investors are viewing robust growth as a sign that the economy can withstand higher interest rates for longer.
Currency markets reflect this cautious stabilization. Dollar remains the strongest performer of the week, followed by Loonie. At the other end of the spectrum, Euro, Swiss Franc, and New Kiwi lag behind, while Sterling and the Aussie sit near the middle of the performance table. Overall, FX markets indicate that conditions are no longer deteriorating, but they are not yet signaling a clear risk-on environment.
In Asia, at the time of writing, Nikkei is up 2.33%. Hong Kong HSI is up 1.02%. China Shanghai SSE is up 0.97%. Singapore Strait Times is up 0.81%. Japan 10-year JGB yield is up 0.043 at 2.161. Overnight, DOW rose 0.49%. S&P 500 rose 0.78%. NASDAQ rose 1.29%. 10-year yield rose 0.024 to 4.080.
China’s new growth target reflects strategic economic transition
Chinese Premier Li Qiang unveiled Beijing’s economic priorities for the year during the annual government work report at the National People’s Congress, setting the country’s GDP growth target at 4.5% to 5%. The range represents a slight step down from the “around 5%” goal used in the past three years.
The introduction of a target range rather than a single figure signals a more flexible policy approach. By allowing growth to fluctuate between 4.5% and 5%, policymakers are granting themselves greater room to manage domestic challenges without the pressure of hitting a rigid numerical target.
Those challenges remain significant. China’s economy continues to grapple with a prolonged property sector downturn, persistent industrial overcapacity, and uneven domestic demand. Against that backdrop, the leadership appears increasingly focused on stability rather than aggressive expansion.
The new target also highlights Beijing’s strategic shift toward “high-quality” growth. Instead of pursuing rapid expansion through debt-fueled infrastructure or property stimulus, policymakers are emphasizing technology development, advanced manufacturing, and consumption as the core engines of growth.
Other policy targets announced in the report reinforce this balanced approach. Inflation is projected to run around 2%, reflecting authorities’ efforts to guard against deflation risks. The unemployment rate is expected to remain below 5.5%, while the fiscal deficit is set at 4% of GDP, suggesting a somewhat more proactive fiscal stance to support economic activity.
Despite the significance of the policy signals, market reaction was relatively muted. Hong Kong equities showed little immediate response to the announcement, with trading largely influenced by global risk sentiment rather than domestic policy developments. The rebound in the Hang Seng Index during the session appeared to follow the stabilization seen in US markets overnight after the steep selloff earlier in the week triggered by escalating tensions in the Middle East.
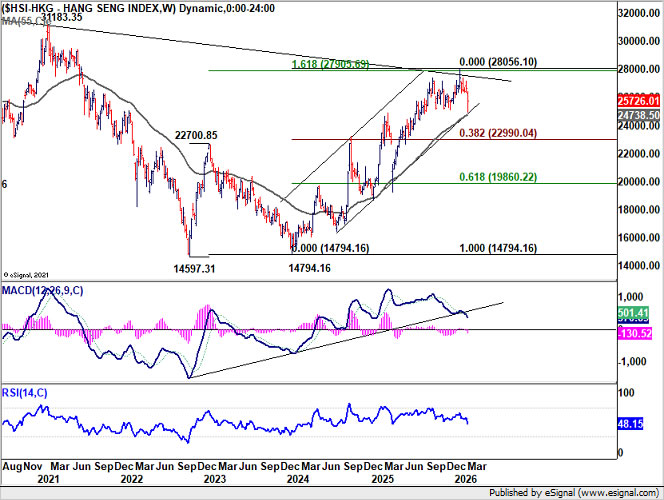
Technically, however, risks of a deeper medium-term correction in Hong Kong equities are building. The HSI recently faced rejection near the 28,000 resistance zone, where a multi-year downtrend line converges with a 161.8% projection level near 161.8% projection of 14,597 to 22,700 from 14,794, at 27905.
The index is currently attempting to hold support around the rising channel floor and the 55 W EMA near 24,738. However, decisive break below that region could open the way for a pullback to 38.2% retracement of 14,7946 to 28,056 at 22,990 at least.
Fed’s Beige Book: Employment stable, price growth seen slowing ahead
The Fed’s latest Beige Book survey showed the US economy expanding at a modest pace, though growth was uneven across regions. Overall activity increased at a “slight to moderate pace” in seven of the twelve Districts, while five districts reported flat or declining conditions, up from four in the previous report.
Consumer spending rose only “slightly” overall, with some districts reporting continued weakness. Several regions noted that sales were restrained by economic uncertainty, greater price sensitivity among consumers, and reduced spending by lower-income households. Employment conditions were broadly stable, with seven districts reporting no meaningful change in hiring.
Manufacturing activity showed somewhat stronger momentum. Eight districts reported growth in factory output, with contacts citing rising new orders and stronger demand linked to data center construction and related energy infrastructure investments.
Meanwhile, price pressures continued to build moderately, driven by rising costs for insurance, utilities, energy and raw materials. Tariffs were cited by nine districts as contributing to higher input costs, although many firms said they were reluctant to fully pass these increases on to customers due to heightened price sensitivity. On balance, firms expected prices to rise at a “somewhat slower pace” in the near term.
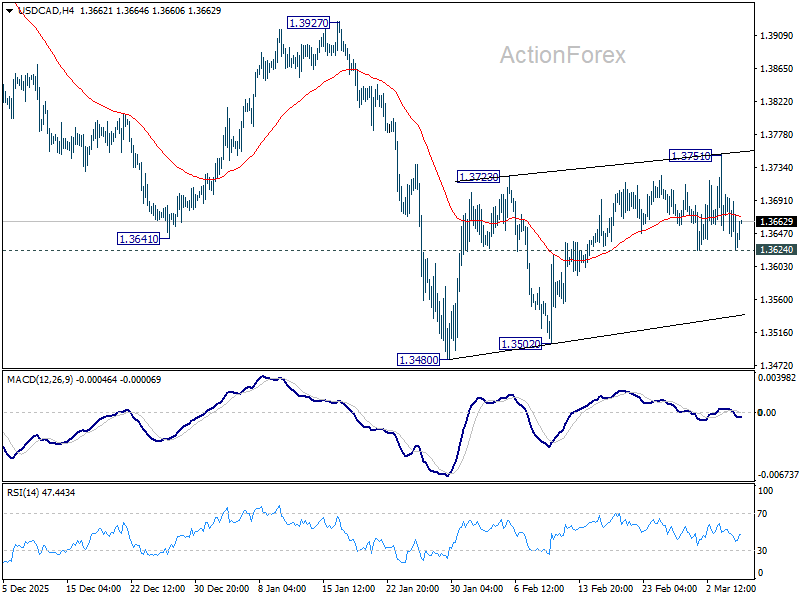
USD/CAD Daily Outlook
Daily Pivots: (S1) 1.3613; (P) 1.3657; (R1) 1.3686; More…
Intraday bias in USD/CAD remains neutral for the moment, and outlook is unchanged. Strong resistance is still expected from 55 D EMA (now at 1.3721) to limit upside to complete the consolidation pattern from 1.3480. Below 1.3624 minor support will bring retest of 1.3480 low first. However, decisive break of 55 D EMA will bring stronger rebound to 1.3927 resistance instead.
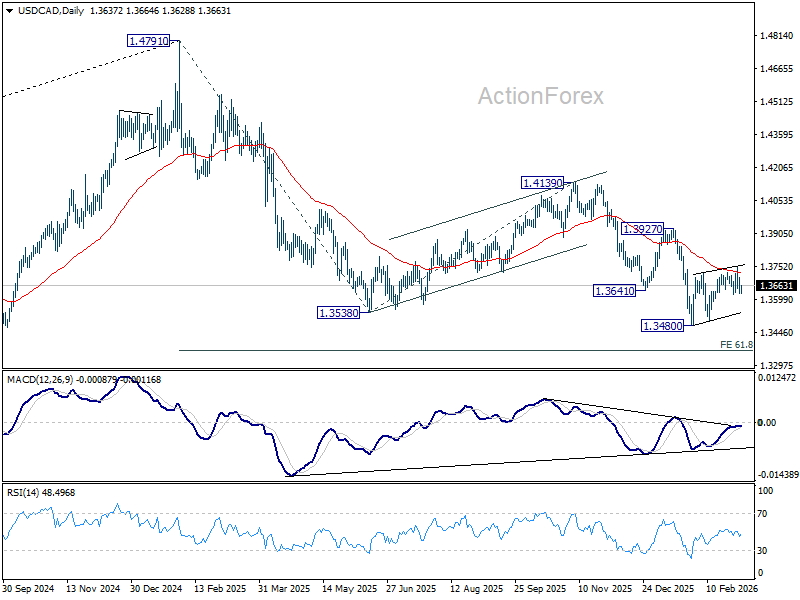
In the bigger picture, price actions from 1.4791 are seen as a corrective pattern to the whole up trend from 1.2005 (2021 low). Deeper fall could be seen as the pattern extends, to 61.8% retracement of 1.2005 to 1.4791 at 1.3069. For now, medium term outlook will be neutral at best, until there are signs that the correction has completed, or that a bearish trend reversal is confirmed.


