
Markets opened Q2 with a powerful relief rally, as a clear shift in the Iran war narrative—from attrition to conclusion—triggered a sharp repricing across assets. The change in tone from prolonged conflict toward a potential endgame has sparked “finish line” optimism, driving equities higher, pulling the Dollar lower, and easing pressure across risk assets.
The catalyst lies in a coordinated shift in messaging from Washington. US President Donald Trump signaled a near-term withdrawal, saying “We’ll be leaving very soon,” possibly within “two or three weeks,” while adding that “Iran doesn’t have to make a deal.” The remarks point to a unilateral exit strategy from “Operation Epic Fury,” removing the need for a negotiated settlement and accelerating expectations of de-escalation.
Reinforcing this shift, Secretary of State Marco Rubio described the situation as approaching a “finish line,” confirming that indirect messages are being exchanged and that a direct meeting is now plausible. He added that if “new people” (implying a change in leadership or a shift in the influence of the IRGC) emerge with a more cooperative stance, that would constitute the political finish line.
Additionally, Iran’s stance introduces a clear condition to the emerging de-escalation narrative. President Masoud Pezeshkian told EU that Tehran has the “necessary will” to end the conflict, but only if credible guarantees are in place to prevent future aggression. This signals openness to a conclusion, but not a unilateral one, with Iran seeking assurances on long-term security.
Together, the messages mark a decisive pivot in the narrative—from a war of attrition toward a conclusion phase.
The immediate impact has been a broad unwind of defensive positioning. US equities surged, with DOW closed up 1,100+ points overnight. S&P 500 rose 2.9% and NASDAQ jumped 3.8%, marking the best single-session performance since March 2025. Also, Asian markets followed with sharp rebounds. Gold has pushed above 4,600 too. The rally reflects not just improved sentiment, but also a positioning reset at the start of Q2, after weeks of risk-off flows tied to escalation fears.
In energy markets, the shift has capped upside risks. Brent crude, while still elevated around 107, has moved back below 110, suggesting that the worst-case supply disruption scenario is no longer being priced. Nevertheless, war premium is being unwound, but not fully erased, as uncertainty around the Strait of Hormuz and Iran’s strategic posture remains unresolved.
Currency markets have reacted decisively. Dollar has fallen sharply, losing its war-premium support as safe-haven demand rotates out. Yen has emerged as the strongest performer, benefiting from lower US yields and a broader unwinding of USD longs, while Euro and Aussie have also gained on improving risk appetite.
However, this is a relief rally driven by expectations, not confirmation. While markets are increasingly pricing a path toward de-escalation, key uncertainties remain. The timeline for withdrawal, the structure of any post-conflict arrangement, and the risk of renewed disruptions in energy flows all remain open questions. Any delay or reversal in these expectations could quickly reintroduce volatility.
Until rhetoric translates into concrete outcomes, conviction will remain fragile, and the current rally will continue to hinge on whether the anticipated “finish line” becomes reality.
In Asia, at the time of writing, Nikkei is up 4.87%. Hong Kong HSI is up 2.07%. China Shanghai SSE is up 1.24%. Singapore Strait Times is up 1.91%. Japan 10-year JGB yield is down -0.054 at 2.305. Overnight, DOW rose 2.49%. S&P 500 rose 2.91%. NASDAQ rose 3.83%. 10-year yield fell -0.031 to 4.311.
Gold Breaks 4,600: Reversal or Bull Trap? Q2 Becomes Battleground
Gold’s rally above 4,600 looks strong, but the move is driven by relief from easing war tensions, not resolution. Inflation risks continue to build in the background, making Gold’s outlook uncertain. Q2 will be the key battleground to determine whether this is a true reversal or a bull trap. Read more.
Japan’s Strong Tankan Signals Support BoJ Normalization Despite External Risks
Japan’s Tankan survey surprised to the upside, with stronger business sentiment and capex plans signaling resilient corporate activity. More importantly, inflation expectations climbed to record levels, reinforcing the case for further BoJ normalization. However, rising energy costs tied to Middle East tensions continue to cloud the outlook. Read more.
Japan PMI Manufacturing Finalized at 51.6, War-Driven Cost Pressures Build
Japan’s manufacturing PMI eased to 51.6 in March, signaling slower growth after February’s 45-month peak. However, the bigger shift came from surging input costs, with firms facing the sharpest price increases in over 18 months due to Middle East tensions. As companies pass on higher costs and turn more cautious, inflation risks are building even as momentum softens. Read more
AUD/USD Daily Report
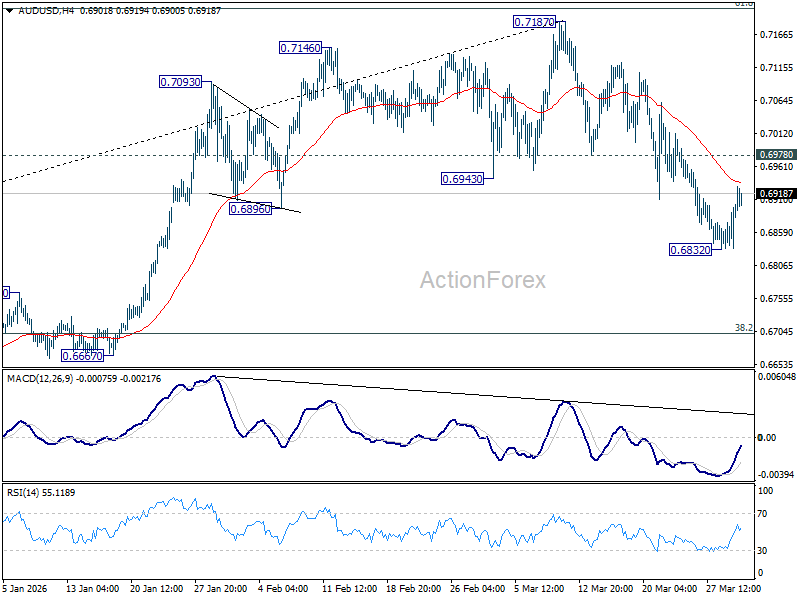
Daily Pivots: (S1) 0.6854; (P) 0.0.6879; (R1) 0.6926; More...
A temporary low should be in place at 0.6832 in AUD/USD with current recovery. Intraday bias is turned neutral first. Further decline is expected as long as 0.6978 support turned resistance. Below 0.6832 will extend the decline from 0.7187 to 38.2% retracement of 0.5913 to 0.7187 at 0.6700. However, firm break of 0.6978 will argue that the correction has completed, and bring retest of 0.7817 high.
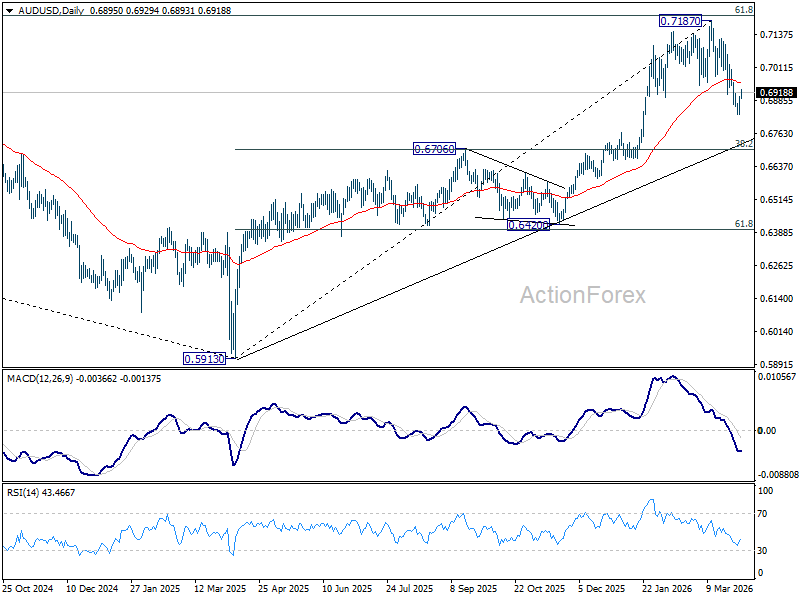
In the bigger picture, as long as 0.6706 cluster support holds, rise from 0.5913 (2024 low) should still be in progress. Decisive break of 61.8% retracement of 0.8006 to 0.5913 at 0.7206 will solidify the case that it’s already reversing the down trend from 0.8006 (2021 high). However, firm break of 0.6706 will dampen this bullish case, and bring deeper fall back to 0.6420 support, and possibly below.


