
Markets have flipped back into risk-off mode as oil rebounds above $110 following US President Donald Trump’s escalation signals at his highly anticipated Iran War update. Investors are now pricing a stagflation shock, with oil surging, stocks falling, and Dollar rebounding. However, the risk of a more catastrophic escalation remains underappreciated.
What makes the current moment particularly dangerous is timing. The next 72 hours, leading into a long weekend, present a high-risk window for escalation. With global markets set to close, the US, Israel, and Iran all have strategic incentives to act when immediate market reaction is limited.
Trump’s rhetoric has already laid the groundwork. His pledge to “hit them extremely hard over the next two to three weeks” defines a clear escalation window. Combined with the threat to “bring them back to the Stone Ages,” it signals a move toward broader infrastructure targeting rather than limited strikes.
If such actions begin, the nature of the conflict changes fundamentally. A coordinated campaign against infrastructure would likely trigger retaliation beyond Iran’s borders, particularly against regional oil producers. This is the scenario that markets are not yet fully pricing.
Iran’s response options would be increasingly asymmetric. With conventional capabilities degraded, retaliation could come through cyber attacks on US systems or targeted strikes on oil facilities in Saudi Arabia and the UAE. These actions would directly impact global supply and amplify the energy shock.
Despite these risks, current market pricing remains focused on inflation. The stagflation trade is back, with oil as the inflation trigger driving higher-for-longer interest rate expectations. Markets are pricing inflation and recession—and not yet disruption.
Brent above $110 reflects inflation fears, but a move above $120 would signal that markets are beginning to price physical supply disruption—something not yet fully embedded. The $120 level is the canary level for whether escalation risk becomes systemic.
Asset price moves reflect this partial adjustment. Asian equities are under pressure, led by a sharp drop in KOSPI, while Dollar is rebounding strongly. Loonie is supported by oil, and Yen is benefiting from risk aversion, while high-beta currencies such as Kiwi and Aussie are weakening.
The broader environment is one of maximum uncertainty. The gap between official messaging and operational signals has left markets without clarity. For now, markets remain in a transitional phase—adjusting to higher inflation risks but not yet to the possibility of systemic disruption. This creates a dangerous imbalance in expectations.
The key risk is not what markets are pricing now, but what they are not. If escalation intensifies, the current stagflation narrative could quickly give way to a more severe shock.
In Asia, at the time of writing, Nikkei is down -2.49%. Hong Kong HSI is down -1.43%. China Shanghai SSE is down -1.15%. Singapore Strait Times is down -0.90%. Japan 10-year JGB yield is up 0.087 at 2.391. Overnight, DOW rose 0.48%. S&P 500 rose 0.72%. NASDAQ rose 1.16%. 10-year yield rose 0.008 to 4.319.
From Exit Hopes to Escalation: Trump Address Raises Risk of Brent Break Above $120–125
Oil is back near $110—and the risk is now higher. Trump’s escalation signals have shifted markets sharply, with Brent potentially breaking above $120–125 as supply fears surge. Read more.
AUD/USD Daily Report
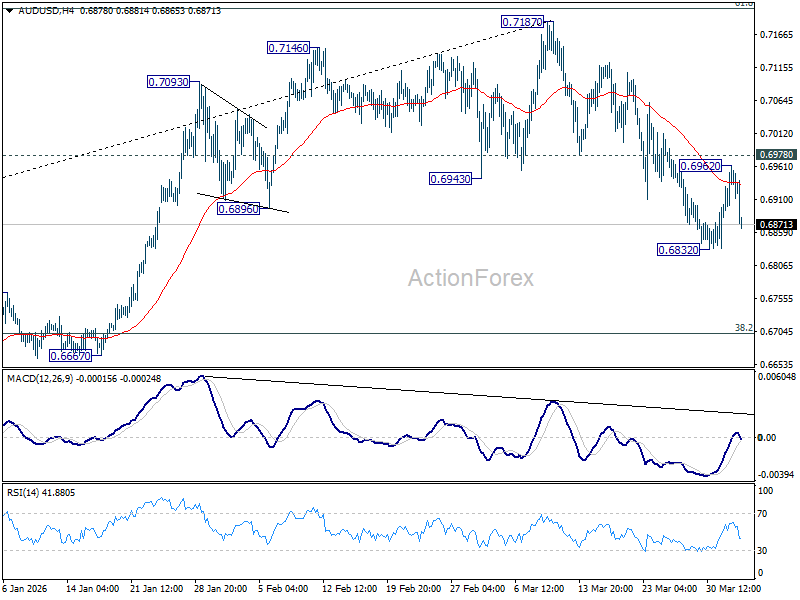
Daily Pivots: (S1) 0.6895; (P) 0.6930; (R1) 0.6964; More...
AUD/USD’s recovery stalled at 0.6962 and reversed. But downside is contained above 0.6832 temporary low. Intraday bias remains neutral. first. Below 0.6832 will extend the decline from 0.7187 to 38.2% retracement of 0.5913 to 0.7187 at 0.6700. However, firm break of 0.6978 will argue that the correction has completed, and bring retest of 0.7817 high.
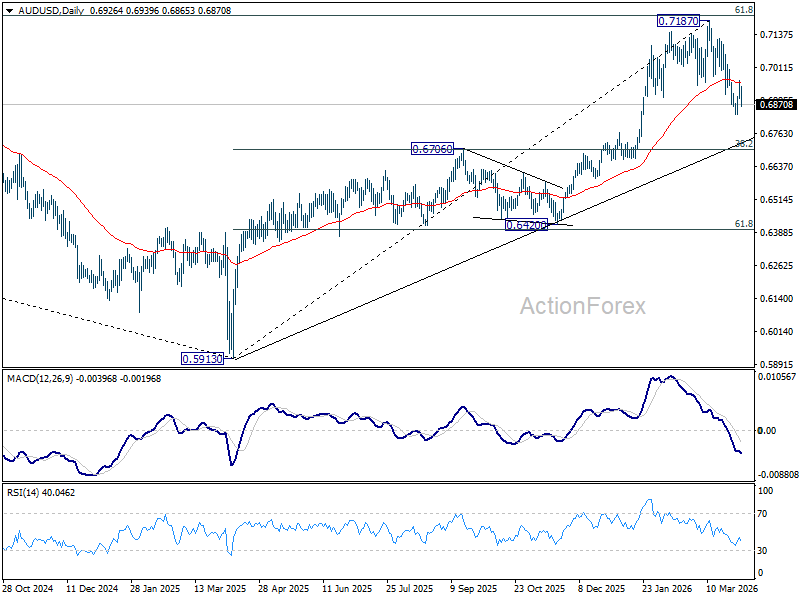
In the bigger picture, as long as 0.6706 cluster support holds, rise from 0.5913 (2024 low) should still be in progress. Decisive break of 61.8% retracement of 0.8006 to 0.5913 at 0.7206 will solidify the case that it’s already reversing the down trend from 0.8006 (2021 high). However, firm break of 0.6706 will dampen this bullish case, and bring deeper fall back to 0.6420 support, and possibly below.


