
Markets were aggressively pricing in a violent restart of hostilities between the United States and Iran following this morning’s firm rejection of the latest Iranian diplomatic proposal.
However, the geopolitical landscape just experienced a significant shift: President Trump has officially called off the planned offensives, signalling a pivot toward a more strategic, diplomatic approach.
According to the president’s own Truth Social post, Trump was scheduled to meet with his war cabinet tomorrow to discuss the next immediate military strike. Instead, he announced that he is halting the planned attack on Iran at the direct request of the Crown Prince of Saudi Arabia and the President of the UAE.
The regional leaders urged the US to hold off on military action, citing that serious, high-level negotiations are currently taking place behind the scenes.
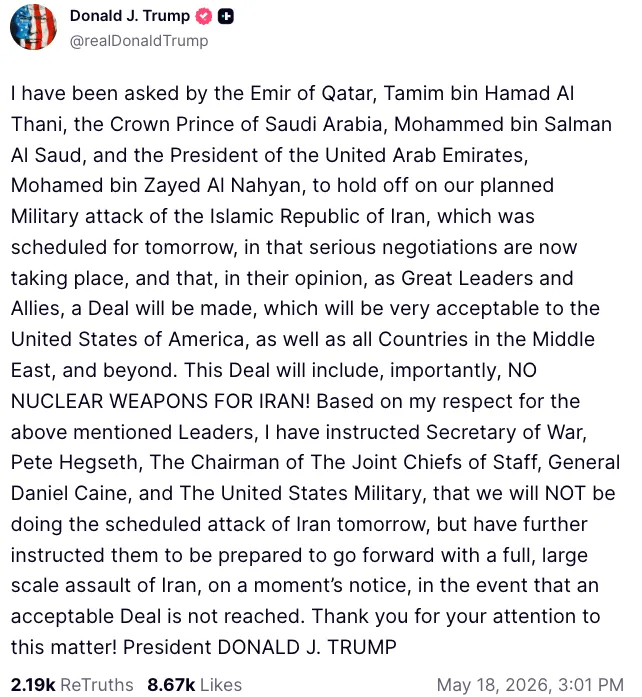
Trump’s Truth Social post. May 18, 2026.
This sudden de-escalation is sparking a huge relief rebound across global financial markets. After a notably rough start to the trading week, heavily clouded by the latest Iran proposition rejection and the Warsh trade/Federal Reserve repricing, investor sentiment is rapidly bouncing back.
US stock benchmarks are aggressively catching a bid, reversing earlier intraday losses as the removal of immediate military tail risks allows buyers to confidently step back into the fold. On the other hand, oil, which quickly rebounded above the $100 mark, is now seeing some heavier selling flows.
While structural macroeconomic concerns remain, the diplomatic news provides a sweet safety net that market bulls desperately needed to regain their footing.
Let’s dive into a few key charts to see how the latest news affected markets.
Stock Markets Bounce Significantly
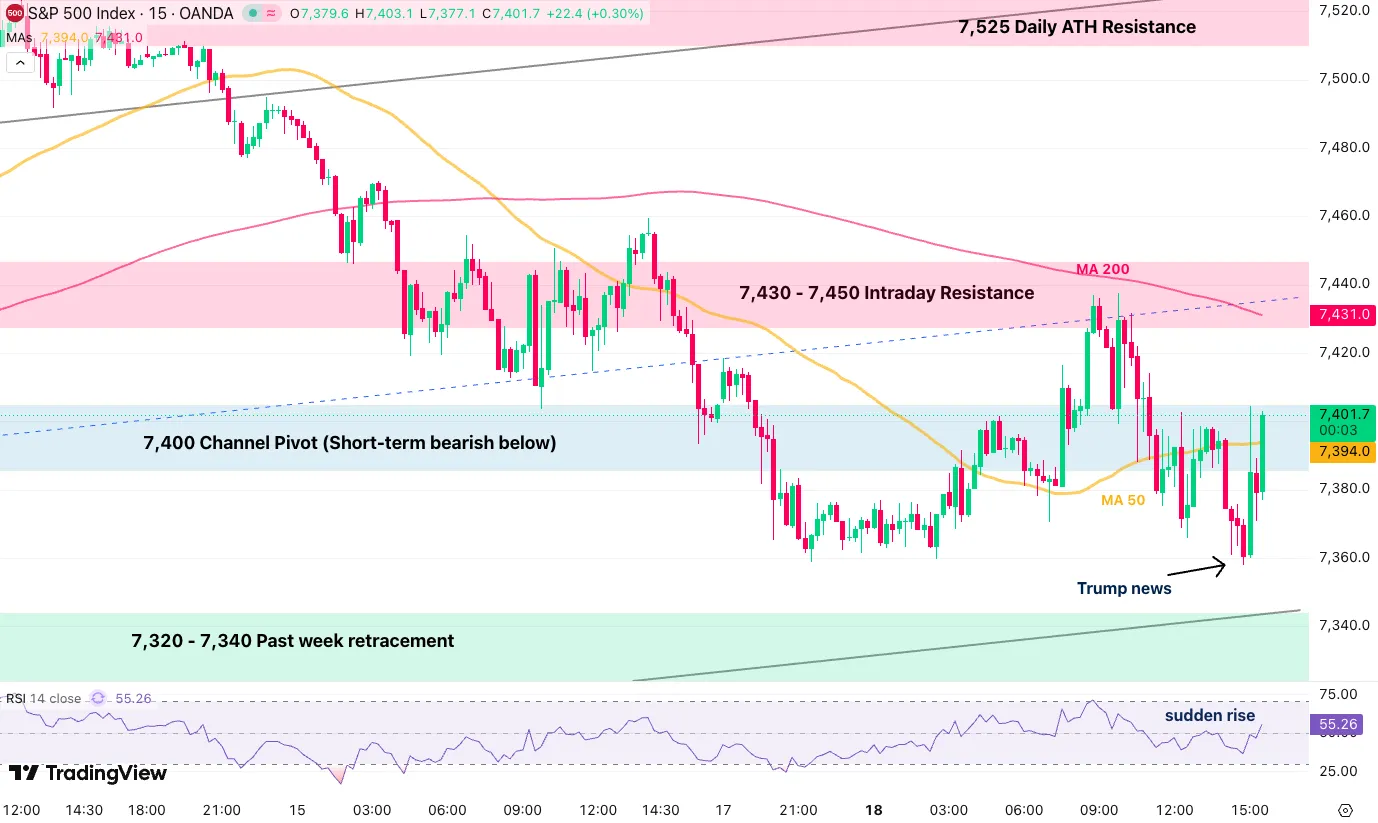
S&P 500 CFD 15M chart. Source: TradingView, May 18, 2026, 15:45.
The S&P 500 erased most of its daily losses, retesting the 7,400 level only a few hours after breaking it to the downside.
Energy Markets
WTI US oil prices exploded to new highs, close to $110 in CFD prices, this morning but are now back below the 15M 50-period MA on strong selling momentum.
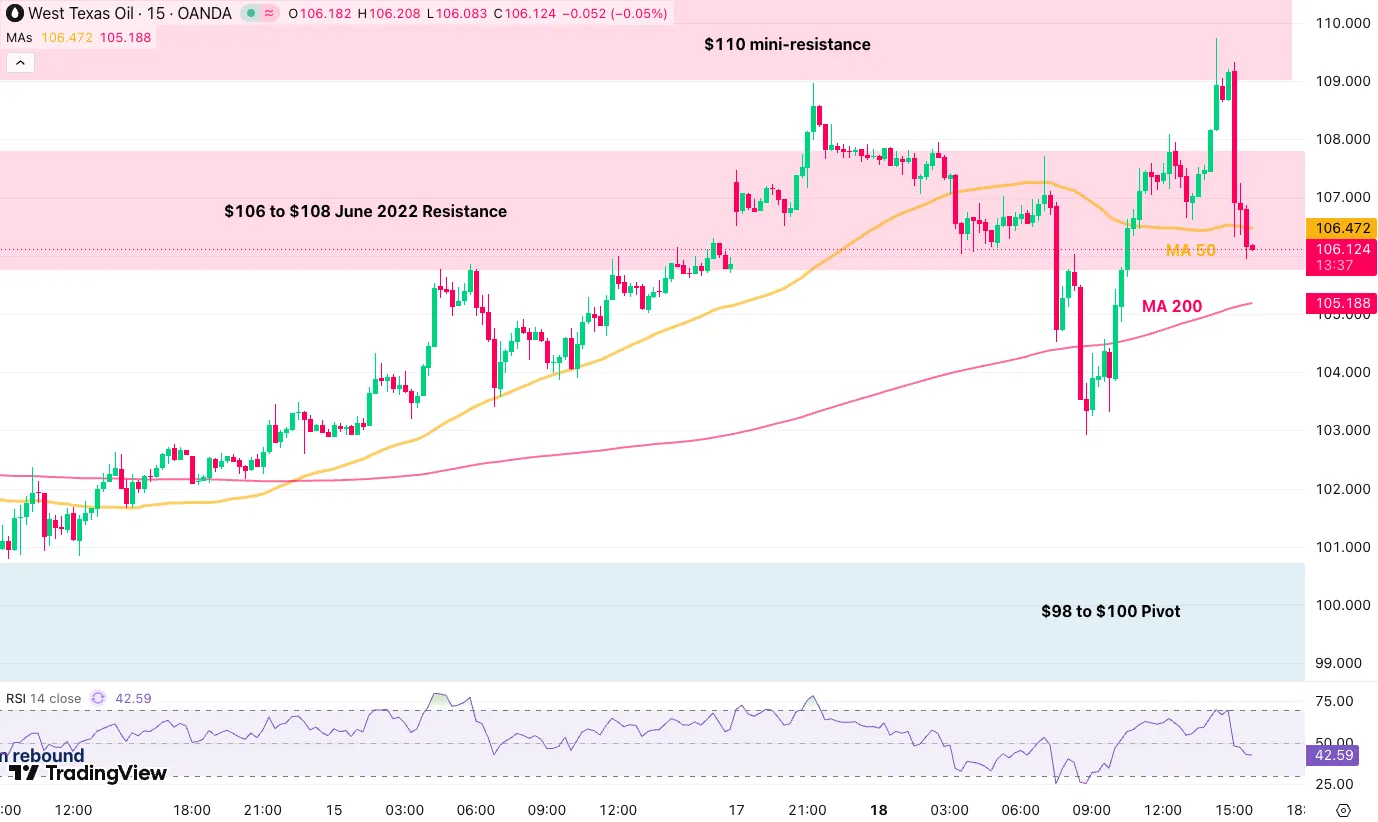
WTI US Oil CFD 15M chart. Source: TradingView, May 18, 2026.
WTI Technical Levels:
Resistance Levels
- 15M 50-period MA 106.47
- $106 to $108 June 2022 resistance, rejecting
- $110 mini-resistance
- 2022 and Monday highs $117 to $120, larger channel top
Support Levels
- $105 15M 200-period MA
- $98 to $100 pivot
- Momentum support $93 to $95
- $90 psychological level and past session’s lows
- $87 to $90 mini-support
- $82 Friday 17 lows
- 2025 highs key support $78 to $80
Metals Markets
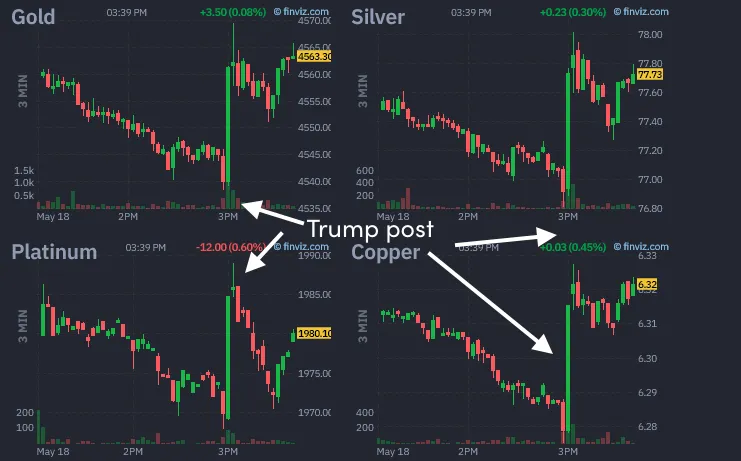
Metal futures intraday charts. Source: Finviz, May 18, 2026.
Metals are somewhat bouncing higher again from the better market narratives, with Copper and Silver leading the way to the upside.
The reaction is still quite contained for now.
US Dollar
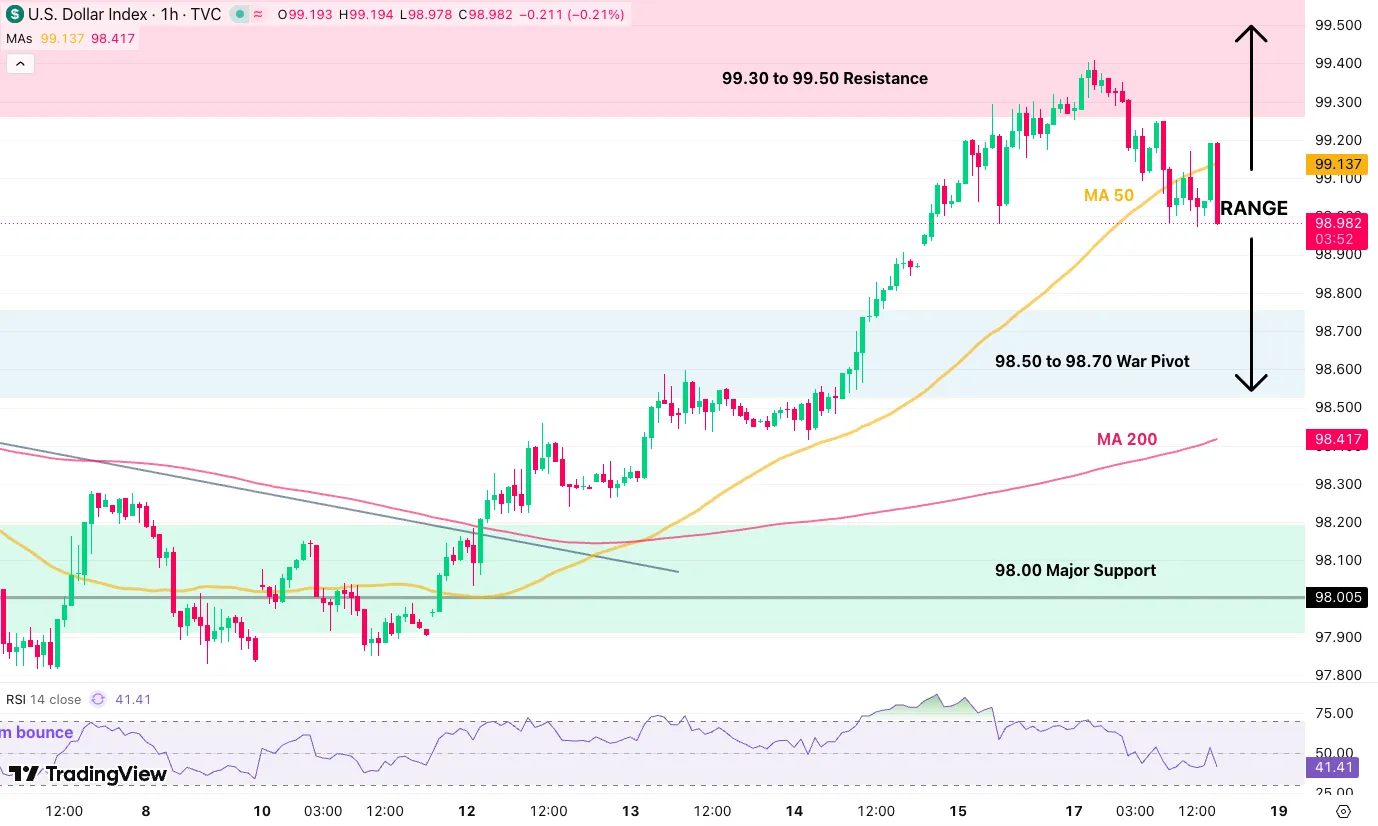
Dollar Index, DXY, 1H chart. Source: TradingView, May 18, 2026.
The US Dollar is seeing heavy rejection, failing to hold above its 50-hour MA and instantly tumbling back below 99.00.
Safe trades and keep track of the latest headlines.


