
- Bitcoin retraced from the $80,000 level, along with other altcoins, and they are lagging US equities after the latest US-Iran peace draft.
- Cryptos have been consolidating for a while, but present interesting technical indications. A trap or an opportunity?
- Exploring technical analysis and trading levels for Bitcoin and Ethereum.
Bitcoin has pulled back from the important $80,000 level, and this drop has also affected the wider altcoin market.
Right now, cryptocurrencies are somewhat falling behind US stocks after the recent US-Iran peace draft. Nasdaq, normally highly correlated to digital assets, has quickly moved back toward new highs thanks to optimism about diplomacy, but despite the correlations, cryptocurrencies have barely moved.
This clear difference shows that digital assets are not following the usual trends in the broader market, at least for now.
Cryptocurrencies have been stuck in a long period of relative sideways movement, unable to break out as some traders hoped.
This may have been frustrating for those looking for quick gains, but there are still some interesting technical signals to watch. The big question now is whether this slow price action is a warning sign or a chance to buy at a discount.
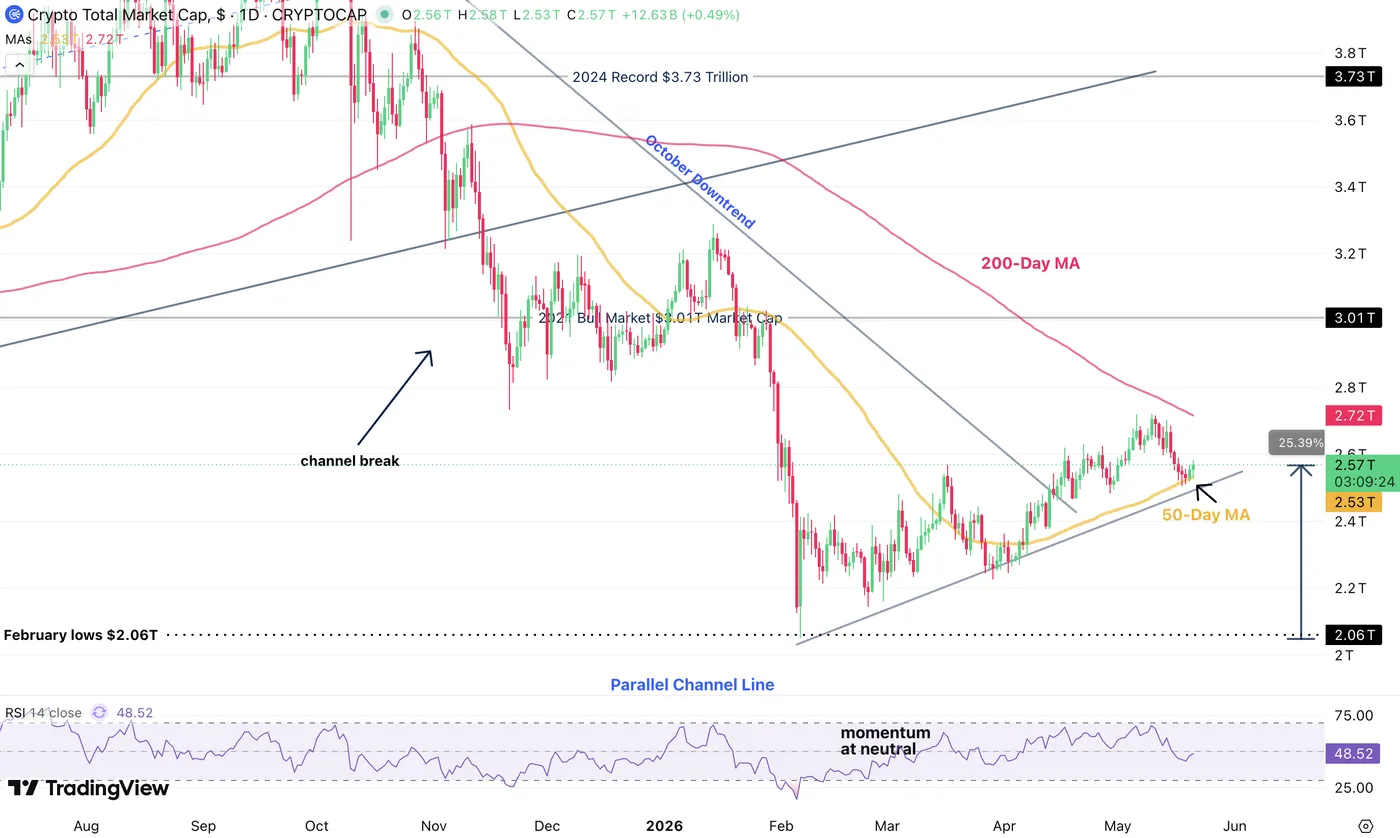
Total crypto market cap daily chart. Source: TradingView, May 21, 2026.
The digital asset market has shown resilience by bouncing off important moving averages, even though there has not been a big surge in retail trading.
If overall market sentiment remains positive and the peace talks continue to hold, Bitcoin and other cryptocurrencies could soon rally and make up for lost ground compared to tech stocks. But this will depend on whether investors can remain hopeful about the deal and its effect.
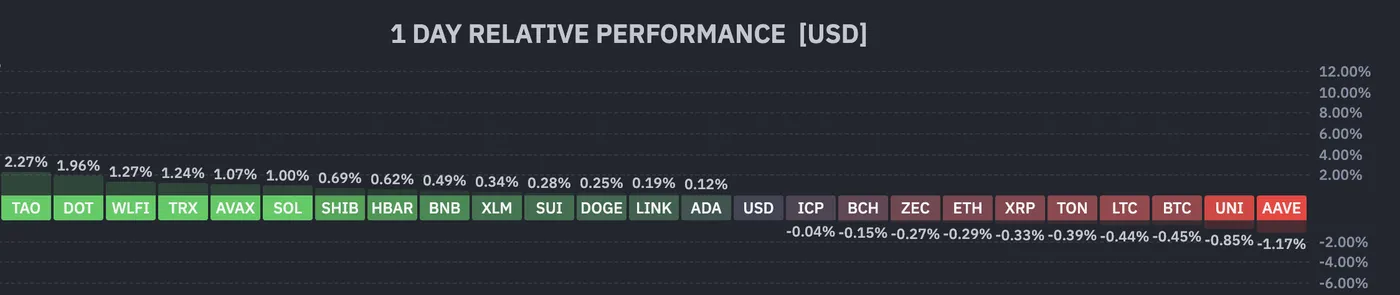
Daily crypto performance, 16:48. Source: Finviz, May 21, 2026.
Let’s dive right into technical analysis and key trading levels for both Bitcoin and Ethereum to spot if a clear breakout is indeed in play from here.
Bitcoin (BTC) 4H Chart and Technical Levels
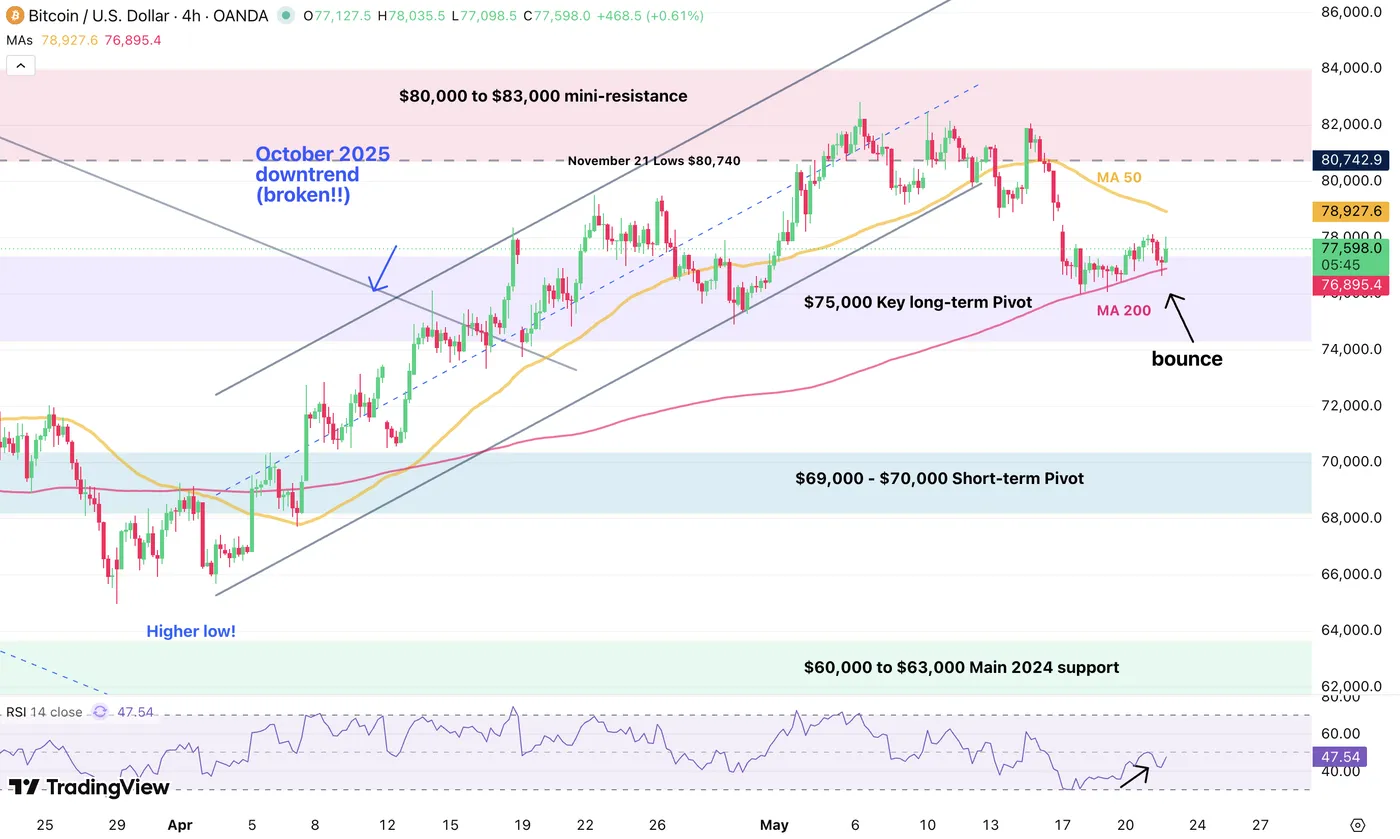
Bitcoin (BTC) 4H chart. Source: TradingView, May 21, 2026.
Bitcoin has broken its recent upward channel that brought the action above $80,000, but looking at current trading, the action is far from bearish.
The pullback stalled right at the 4H 200-period MA, $77,000, and is currently acting as support.
Bouncing back above $78,800, the 4H 50 MA, opens the way for a new test of a higher break.
On the other hand, bears will want to see a break of the 200 MA with an extension below $75,000.
Levels of interest for BTC trading:
Support Levels:
- 4H 200-period MA: $77,000
- $75,000 key long-term pivot, acting as resistance
- $70,000 short-term momentum pivot
- $60,000 to $63,000 main 2024 support, recent double bottom
- $59,935 February lows
Resistance Levels:
- $78,800, the 4H 50 MA
- $80,000 to $83,000 mini-resistance, entering and bullish above
- $82,500 cycle highs
- $90,000 to $95,000 minor resistance
- $98,000 to $100,000 pivotal resistance
- Current ATH resistance: $124,000 to $126,000
Ethereum (ETH) 4H Chart and Technical Levels
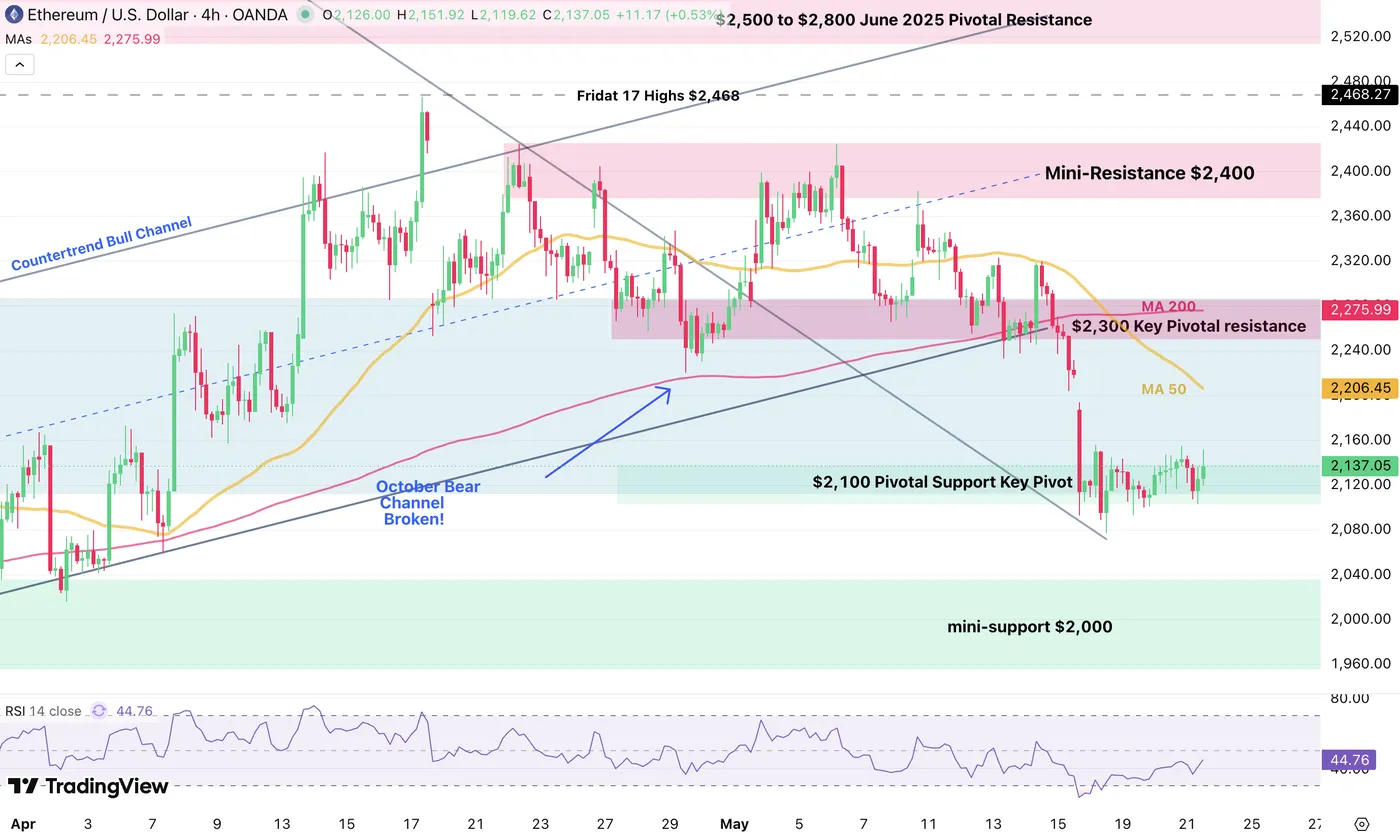
Ethereum (ETH) 4H chart. Source: TradingView, May 21, 2026.
Ethereum is still showing a somewhat weaker price action than Bitcoin, but is finding support at the bottom of its major pivot region, around $2,100.
Rebounding from here should relaunch better prospects for a rebound, but the action is not showing much impulse from here.
A bounce above $2,200, the 50-period MA, should clear the path for more bullish action ahead.
For bears, look for a clean break and close below $2,100.
Levels of interest for ETH trading:
Support Levels:
- Pivot zone lows: $2,100
- $1,700 to $1,800 pre-bounce 2025 key support, testing
- $1,744 February 6 lows
- $1,380 to $1,500 2025 support
- 2025 lows: $1,384
Resistance Levels:
- 4H 50 MA: $2,200
- Mini-resistance: $2,400
- $2,500 to $2,800 June 2025 pivotal resistance
- $3,000 to $3,200 major momentum pivot, test of $3,000
- $4,950 current new all-time highs
The narrative is easing, but keep track of WTI crude and the latest headlines to stay ahead of the game.
Safe trades.


