
Despite jumping to 1.3455 last week, subsequent sharp fall in USD/CAD argues that the corrective fall from 1.3534 is not completed yet. That is, such decline is in favor to extend through 1.3263 before completion. But overall, we’re still expect rise from 1.2968, and that from 1.2460 to resume later through 1.3598 at a later stage.
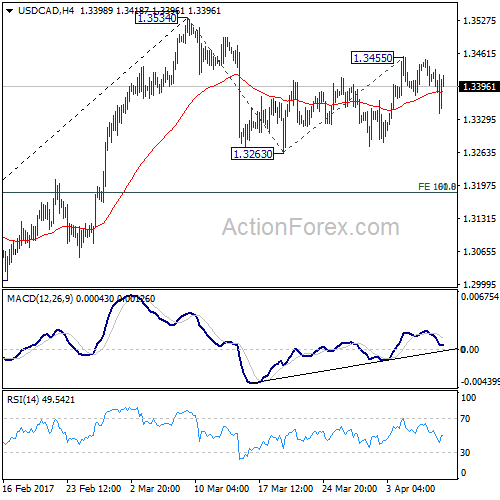
Initial bias in USD/CAD stay son the downside for 1.3263 support. Break will confirm resumption of whole fall from 1.3534. Nonetheless, in that case, we’d expect strong support from 1.3184 cluster level (61.8% retracement of 1.2968 to 1.3534 at 1.3184, 100% projection of 1.3534 to 1.3263 from 1.3455 at 1.3814 too) to contain downside and bring rebound. On the upside, break of 1.3455 will turn bias back to the upside for 1.3534 resistance.
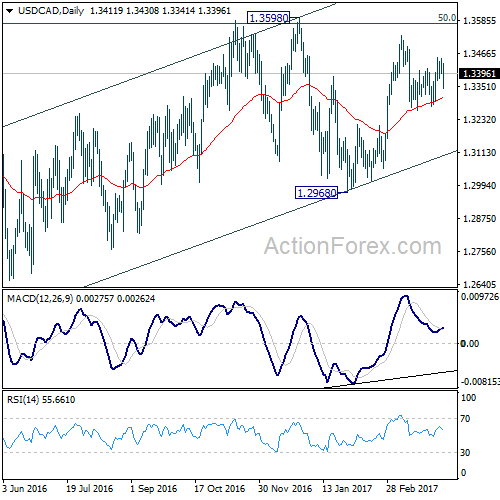
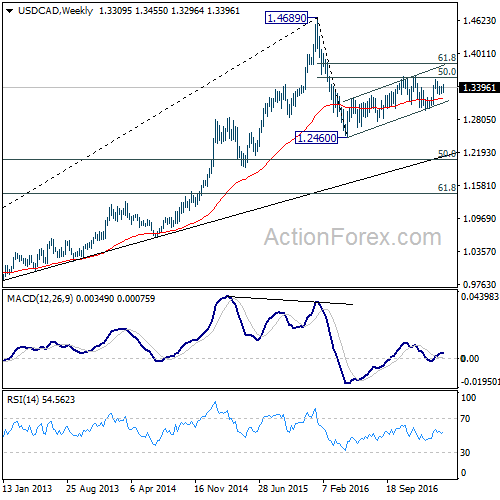
In the bigger picture, price actions from 1.4689 medium term top are seen as a correction pattern. The first leg has completed at 1.2460. The second leg from 1.2460 is likely still in progress and could target 61.8% retracement of 1.4689 to 1.2460 at 1.3838. We’d look for reversal signal there to start the third leg. However, break of 1.2968 will argue that the third leg has already started and should at least bring a retest of 1.2460 low. Meanwhile, sustained trading above 1.3838 would pave the way to retest 1.4689 high.
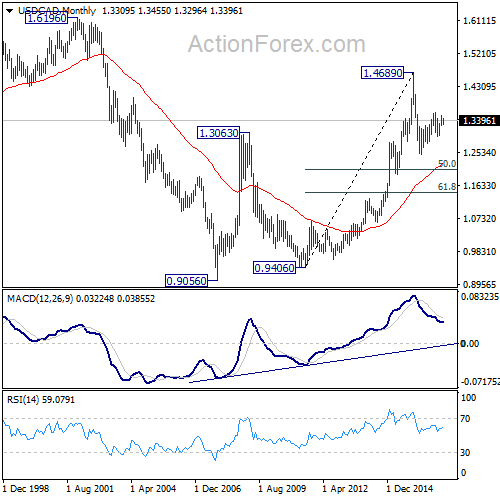
In the longer term picture, rise from 0.9056 (2007 low) is viewed as a long term up trend. It’s taking a breath after hitting 1.4689. But such rise expected to resume later to test 1.6196 down the road.


