
Renewed selloff in the Chinese Yuan weighs down sentiments across Asia and boosts the greenback today. USD/CHN breaks recent high at 6.912 to resume up trend. With that, China Shanghai SSE is trading down -2.31% at the time of writing. Hong Kong HSI is down -1.52%, Singapore Strait Times is down -0.17% and Nikkei is down -0.72%. Dollar is the clear winner in the currency markets. Yen and Canadian Dollar follow as the next strongest. Australian Dollar and New Zealand Dollar, on the other hand, suffer deep selling.
Technically, Dollar remains in up trend against Euro, Sterling and Australian Dollar. Meanwhile, USD/CHF, USD/JPY and USD/CAD are still kept in range. USD/JPY’s break of 111.17 minor resistance overnight is taken as indicate of near term reversal. That is, correction from 113.17 has completed at 110.10. But there is no clear cut upside momentum yet. We’ll see if these four currencies will stay strong altogether ahead.
Chinese Yuan in decline again, USDCNH heading to 7?
The Chinese Yuan is under renewed selling pressure again today. USD/CNH (offshore Yuan) rises to as high as 6.921 so far and breaks 6.912 resistance. USD/CNH has been in steep rise since hitting a low at 6.2359, as trade tension between the US and China escalated. The next batches of tariffs will start next week and more are coming. The Chinese National Development and Reform Commission pledged today to work on meeting this year’s 6.5% growth target. With usual way of interpreting Chinese rhetorics, it means they found it difficult to meet that target.
Now USD/CNH is on course to have a test on key resistance level at 6.9871, 2017 high. It remains to be seen if the government will intervene more aggressively. If the Yuan is solely moved by market forces, we see no reason why USD/CNH will not break 7 handle.
Gold extends decline on Dollar strength, breaks 1190
On the back of broad based strength in Dollar, Gold’s decline continues today and breaks 1190 handle to as low as 1188.42 so far. The down trend from 1365.24 is on track for 1172.06 fibonacci level. Daily RSI may indicate Gold is in oversold condition again. But based on current acceleration, RSI indeed suggests solid downside momentum. 1172.06 could be taken out without much hesitation and the next real hurdle is probably 1122.81 support. And in any case, near term outlook will remain bearish as long as 1217.20 resistance holds.
In the bigger picture, currently decline from 1365.24 is viewed as part of the long term sideway pattern from 1046.54 (2015 low). Sustained break of 61.8% retracement of 1046.64 to 1375.15 at 1172.06 will pave the way to 1046.54/1122.81 support zone. At this point, we’re not expecting a break there to resume long term down trend yet. Hence, we’ll look for bottoming signal below 1122.81.
Australia consumer sentiment dipped -2.3% mom, wage price grew 0.6% qoq
Australia Westpac Melbourne Institute consumer sentiment dropped -2.3% to 103.6 in August, down from 106.1. The index pared back half of the “surprisingly strong gains in June to Jule” as the impact of government’s tax cuts faded. The decline also came against the backdrop of rising global trade tension and housing markets correction in Sydney and Melbourne.
Westpac pointed out RBA’s projection that inflation will hit 2.25% by 2020 and expects next move is up. It noted an “obvious headwind” for RBA is “the impact that five years of underperformance in inflation will have on households’ and firms’ expectations.” And, “lower expectations will make it that much more difficult to lift inflation back into the band”. Westpac also noted that “certainly it will be quite some time before the Bank has a case to adjust the cash rate.” And it maintains the view that RBA will be on whole in both 2018 and 2019.
Also from Australia, Wage price index rose 0.6% qoq, 2.1% yoy in Q2, in line with expectation. Private sector wage price grew 0.5% qoq, 2.0% yoy. Public sector wage grew 0.6% qoq, 2.4% yoy.
Looking ahead – UK inflation data unlikely to alter Sterling’s down trend
UK data will once again be the highlight in European session. Headline CPI is expected to accelerate from 2.4% yoy to 2.5% yoy in July. Core CPI is expected to be unchanged at 1.9% yoy. RPI, PPI and hour price index will also be released. Note that according to the August Inflation Report, BoE projects CPI to peak at 2.5% in Q3 this year, then slow to 2.2% in Q3 2019. It doesn’t expect a full 25bps rate hike until Q1 2020. One month of inflation data shouldn’t have much impact on something that’s going to happen in nearly 1.5 years time. So, with or without surprise, the down trend in Sterling will likely continue after the release.
Later in the day, a number of US data will be featured, including retail sales, industrial production, business inventories, NAHB housing index Empire state manufacturing and non-farm productivity.
AUD/USD Daily Outlook
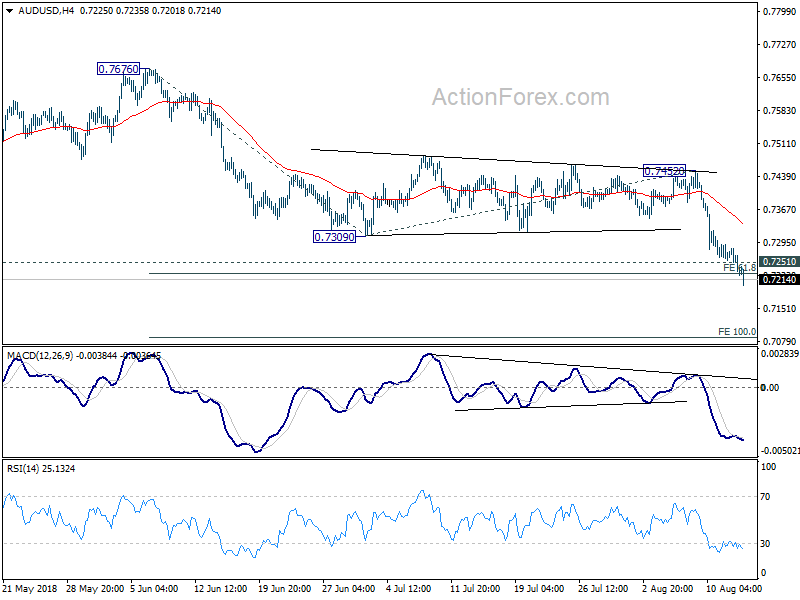
Daily Pivots: (S1) 0.7214; (P) 0.7248; (R1) 0.7274; More…
AUD/USD’s drops to as low as 0.7201 so far and met 61.8% projection of 0.7676 to 0.7309 from 0.7452 at 0.7225 already. Intraday bias remains on the downside for next target at 100% projection at 0.7085. On the upside, above 0.7251 minor resistance will turn intraday bias and bring consolidation. But recovery should be limited well below 0.7452 resistance to bring fall resumption.
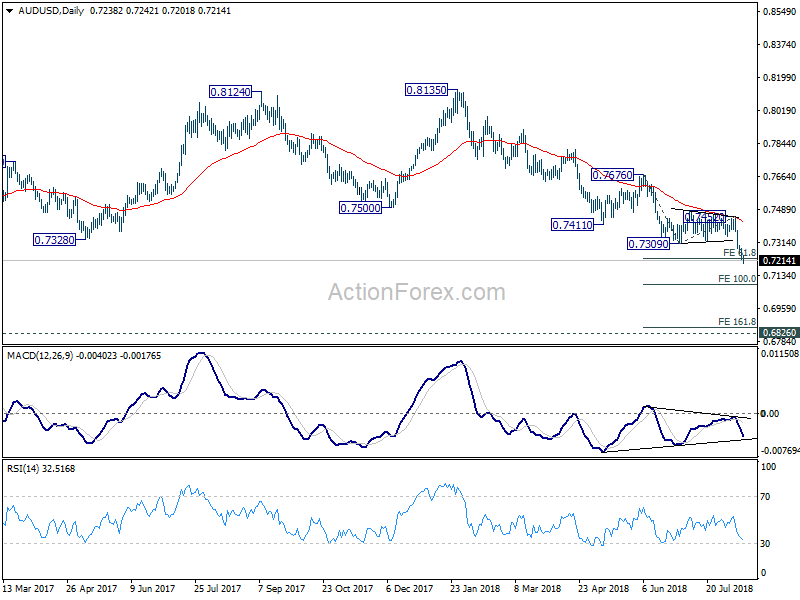
In the bigger picture, medium term rebound from 0.6826 (2016 low) is seen as a corrective move that should be completed at 0.8135. Fall from there should now have a test on 0.6826. There is prospect of resuming long term down trend from 1.1079 (2011 high). But we’ll look at downside momentum to assess at a later stage. On the upside, break of 0.7452 resistance is needed to indicate medium term bottoming. Otherwise, outlook will remain bearish even in case of strong rebound.
Economic Indicators Update
| GMT | Ccy | Events | Actual | Forecast | Previous | Revised |
|---|---|---|---|---|---|---|
| 00:30 | AUD | Westpac Consumer Confidence Aug | -2.30% | 3.90% | ||
| 01:30 | AUD | Wage Price Index Q/Q Q2 | 0.60% | 0.60% | 0.50% | |
| 08:30 | GBP | CPI M/M Jul | -0.20% | 0.00% | ||
| 08:30 | GBP | CPI Y/Y Jul | 2.50% | 2.40% | ||
| 08:30 | GBP | Core CPI Y/Y Jul | 1.90% | 1.90% | ||
| 08:30 | GBP | RPI M/M Jul | 0.40% | 0.30% | ||
| 08:30 | GBP | RPI Y/Y Jul | 3.60% | 3.40% | ||
| 08:30 | GBP | PPI Input M/M Jul | -0.10% | 0.20% | ||
| 08:30 | GBP | PPI Input Y/Y Jul | 10.80% | 10.20% | ||
| 08:30 | GBP | PPI Output M/M Jul | 0.10% | 0.10% | ||
| 08:30 | GBP | PPI Output Y/Y Jul | 3.20% | 3.10% | ||
| 08:30 | GBP | PPI Output Core M/M Jul | 0.10% | 0.20% | ||
| 08:30 | GBP | PPI Output Core Y/Y Jul | 2.30% | 2.10% | ||
| 08:30 | GBP | House Price Index Y/Y Jun | 2.80% | 3.00% | ||
| 12:30 | USD | Empire State Manufacturing Aug | 20.3 | 22.6 | ||
| 12:30 | USD | Nonfarm Productivity Q2 P | 2.50% | 0.40% | ||
| 12:30 | USD | Unit Labor Costs Q2 P | -0.20% | 2.90% | ||
| 12:30 | USD | Retail Sales Advance M/M Jul | 0.30% | 0.50% | ||
| 12:30 | USD | Retail Sales Ex Auto M/M Jul | 0.40% | 0.40% | ||
| 13:15 | USD | Industrial Production M/M Jul | 0.30% | 0.60% | ||
| 13:15 | USD | Capacity Utilization Jul | 78.20% | 78.00% | ||
| 14:00 | USD | Business Inventories Jun | 0.20% | 0.40% | ||
| 14:00 | USD | NAHB Housing Market Index Aug | 67 | 68 | ||
| 14:30 | USD | Crude Oil Inventories | -1.4M | |||
| 20:00 | USD | Net Long-term TIC Flows Jun | 32.3B | 45.6B |


