
Yen, Swiss Franc and Dollar strengthen generally today as risk appetite is having a setback after dovish FOMC announcement overnight. While NASDAQ continued to defy gravity and extended the record run, DOW and S&P 500 closed mildly lower. Asian markets are also trading in red as pull back in stocks follow through. As a result, commodity currencies are generally lower for today together with Sterling. Indeed, it should be noted that Aussie is currently the weakest one for the week, followed by Canadian. There is prospect of more risk pull back before weekly close.
Technically, while EUR/USD, GBP/USD and AUD/USD edged higher after FOMC overnight, they quickly lost momentum. Focus is now on 1.1241 minor support in EUR/USD, 1.2618 minor support in GBP/USD and 0.6898 minor support in AUD/USD. Break of these level will open up near term corrective falls in these pairs. Nevertheless, Dollar will likely remain weak against Swiss Franc and Yen. In particular, with 0.9456 fibonacci support taken out, USD/CHF is heading to 0.9337 projection level.
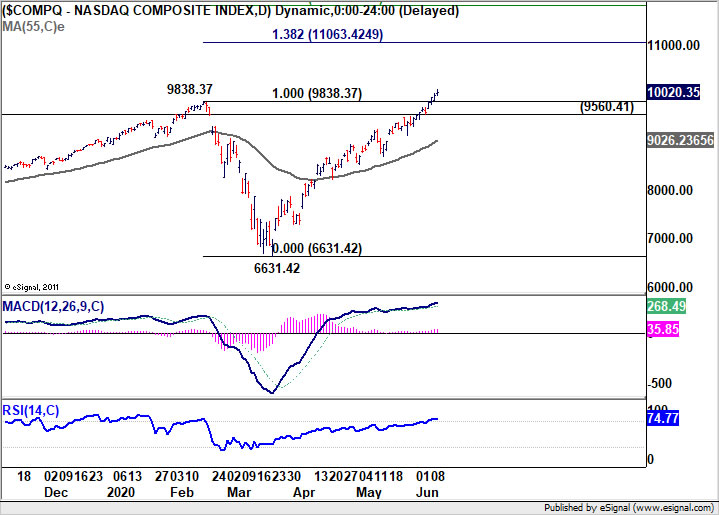
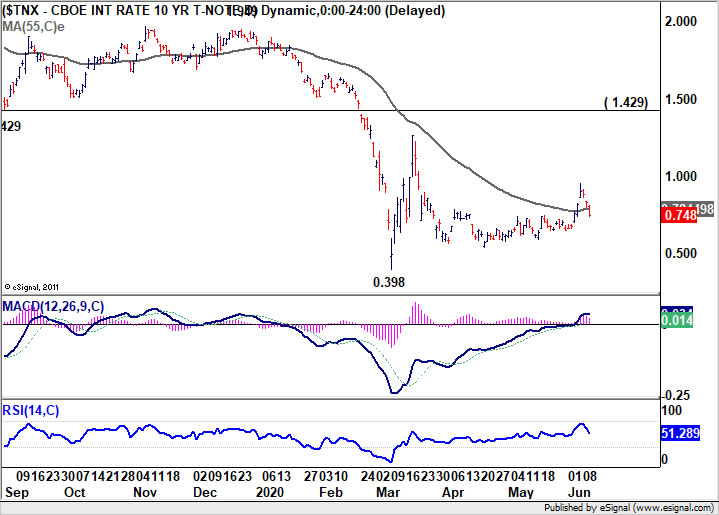
In Asia, Nikkei closed down -2.82%. Hong Kong HSI is down -1.68%. China Shanghai SSE is down -0.80%. Singapore Strait Times is down -2.95%. Japan 10-year JGB yield is down -0.0132 at 0.011. Overnight, DOW dropped -1.04%. S&P 500 dropped -0.53%. But NASDAQ rose 0.67% to new record high at 10020.35. 10-year yield dropped -0.081 to 0.748.
Fed kept rate at 0.00-0.25%, maintains asset purchase pace
Fed kept monetary policy unchanged overnight as widely expected. Federal funds rate target rate unchanged at 0.00-0.25%. FOMC pledged to maintain the target range “until it is confident that the economy has weathered recent events and is on track to achieve its maximum employment and price stability goals.” Regarding the asset purchase program, Fed said it will “increase its holdings of treasury and MBS “at least at the current pace”.
In the new economic projections (median), Fed expects:
- GDP to contract -6.5% in 2020, then rebound by 5.0% in 2021, before slowing to 3.5% in 2022.
- Unemployment rate is expected to hit 9.3% by the end the of year, then dropped back to 6.5% at 2021 end, and 5.5% in 2022 end.
- Core PCE inflation is projected to be at 1.0% by 2020 year end, then gradually climb back to 1.5% in 2021 end, and 1.7% in 2022 end. F
- Federal funds rates are expected to stay at 0.1%, i.e. the current target range, throughout projection horizon till 2022.
Suggested readings:
- FOMC Signals to Increase Asset Purchases in Coming Months
- Fed Signals Low Rates Are Here to Stay
- Fed Leaves Rates Unchanged, Lays Out Somber Outlook
- FOMC Meeting Recap: Powell’s Punch Bowl Party Persists
- Fed chair Jerome Powell’s press conference live stream
- Fed projections GDP to contract -6.5% in 2020, unemployment rate to end at 9.3%
- Fed kept interest rate at 0-0.25%, maintain asset purchase at least at current pace
NASDAQ extended record run after Fed, But DOW and TNX dip
Market reactions to the dovish FOMC statement and projections overnight were generally negative, except NASDAQ. DOW closed down -1.04% while S&P 500 dropped -0.53%. But NASDAQ extended the record run and rose 0.67% to 10020.35. 10-year yield extended this week’s steep reversal and closed down -0.081 to 0.748.
Nevertheless, it should be noted that both DOW and S&P 500 are both kept well above the near term gap bottoms (last Thursday’s highs) of 26384.10 and 3128.91 respectively. There is no indication of topping yet. NASDAQ’s rally is still in progress with solid momentum. If trading could sustained above 10k handle, NASDAQ might target 138.2% retracement of 9838.37 to 6631.42 at 11063.42 before making a top.
10-year yield’s break of 55 day EMA suggests that last week’s rebound is all over. It’s likely heading back to prior range between 0.55 and 0.70, which is not far away. TNX would likely settle there without further decline. If that’s the case, USD/JPY would be dragged down slightly further for the near term, but downside should be relatively limited.
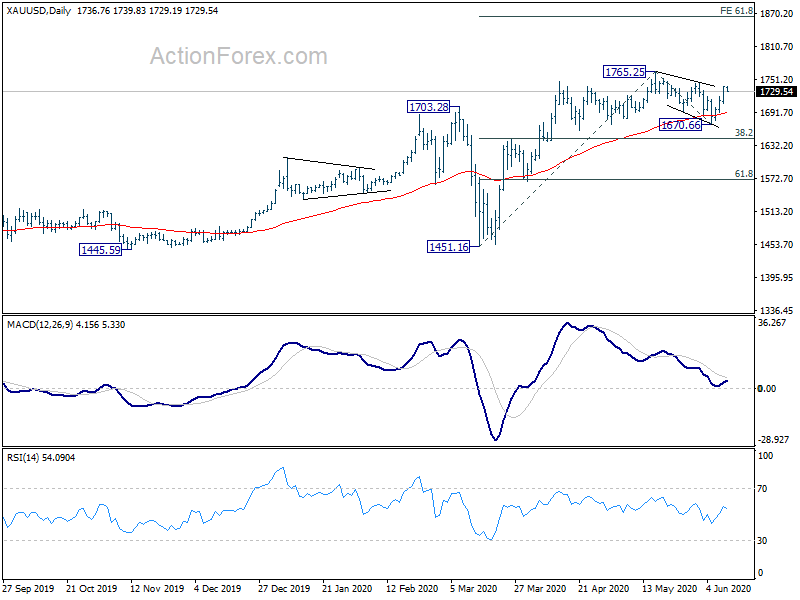
Gold finished correction, extending up trend through 1765 high
Gold’s firm break of 1721.90 resistance yesterday suggests that corrective fall from 1765.25 has completed with three waves down to 1670.66. That came after drawing support from 55 day EMA. Further rise is now in favor as long as 1707.84 minor support holds.
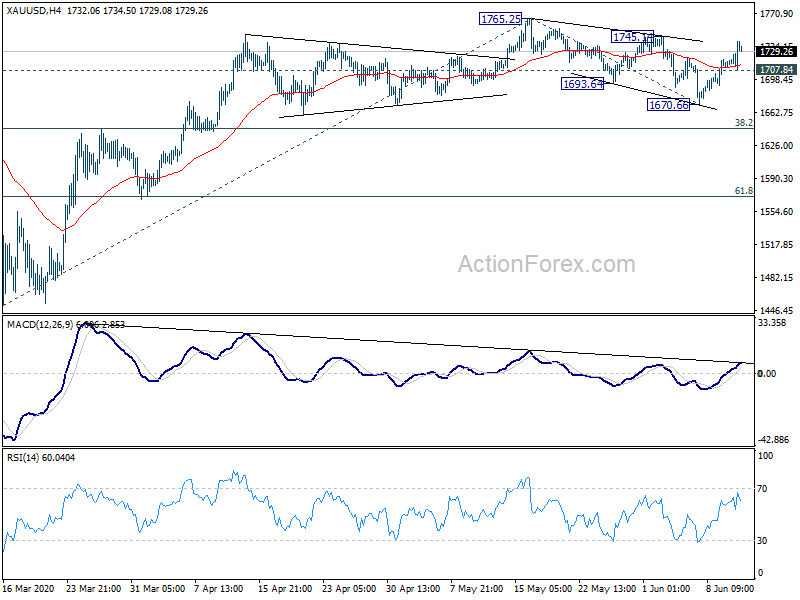
Decisive break of 1765.25 high will resume larger up trend. Next near term target will be 61.8% projection of 1451.16 to 1765.25 from 1670.66 at 1864.76. If that happens, the question is whether gold and Dollar with strengthen together on come back of risk aversion. Or, it would be riding on extended selloff in the greenback. This is something to be watched.
Japan large industries BSI dropped to -47.6 in Q2, worst in 11 years
According to Japan’s Finance Ministry and Cabinet Office, Business Sentiment Indicator of all large industries plunged to -47.6 in Q2, down from -10.1 in Q1. That’s the worst reading in 11 years. Large manufacturing BSI dropped to -52.3, down from -17.2. Large non-manufacturing BSI dropped to -45.3, down from -6.6. All industries medium BSI dropped to -54.1, down from -13.1. All industries small BSI dropped to -61.1, down form -25.3.
“There are many small businesses in the service industry which are greatly affected by the coronavirus,” the Ministry of Finance said. “The pandemic has contributed to a larger drop in business sentiment among small and medium-sized companies than during the crisis caused by of Lehman Brothers.”
Elsewhere
UK RICS house price balance dropped to -32 in May, down form -21. Australian consumer inflation expectations slowed to 3.3% in June. Italy will release industrial output in European session. US will release PPI and jobless claims later today.
AUD/USD Daily Report
Daily Pivots: (S1) 0.6933; (P) 0.6998; (R1) 0.7064; More…
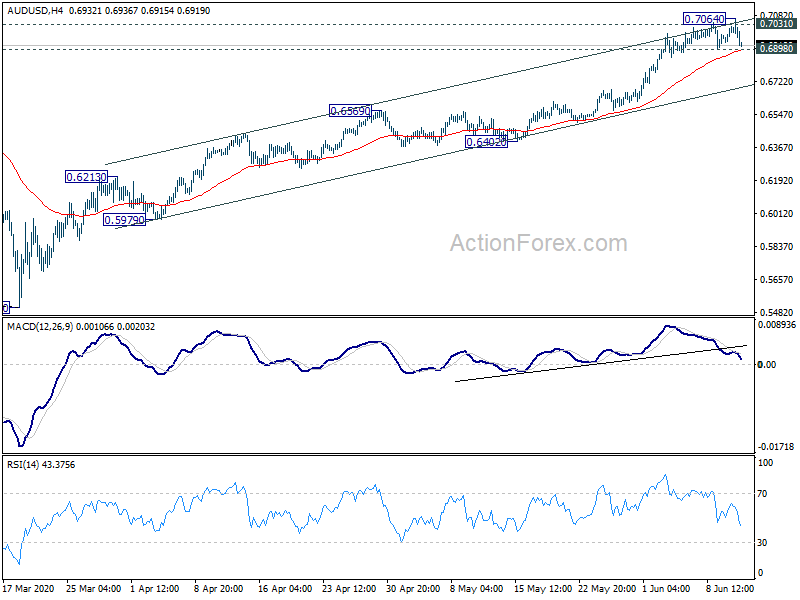
AUD/USD edged higher to 0.7064 but failed to sustain above 0.7031 resistance again and retreated. Intraday bias remains neutral first. On the downside, firm break of 0.6898 minor support should indicate short term topping and rejection by 0.7031. Intraday bias will be turned back to the downside, for correction back to 0.6569 resistance turned support. On the upside, however, sustained break of 0.7031 will extend the rise from 0.5506.
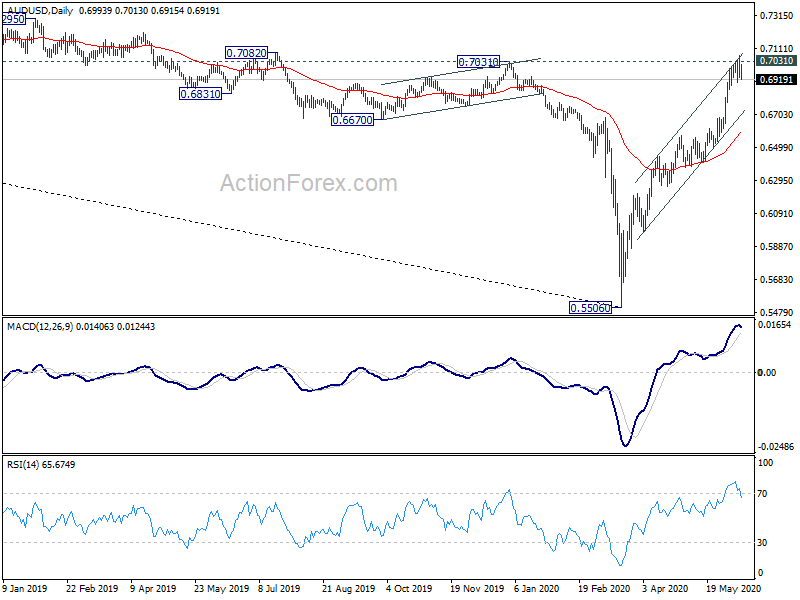
In the bigger picture, the firm break of 0.6826 (2016 low) now suggests that 0.5506 is a medium term bottom. Rebound from there is likely correcting whole long term down trend form 1.1079 (2011 high). Further rally would be seen to 55 month EMA (now at 0.7326). This will remain the preferred case as long as it stays above 55 week EMA (now at 0.6721).
Economic Indicators Update
| GMT | Ccy | Events | Actual | Forecast | Previous | Revised |
|---|---|---|---|---|---|---|
| 23:01 | GBP | RICS Housing Price Balance May | -32% | -24% | -21% | |
| 1:00 | AUD | Consumer Inflation Expectations Jun | 3.30% | 3.40% | ||
| 8:00 | EUR | Italy Industrial Output M/M Apr | -25.80% | -28.40% | ||
| 12:30 | USD | PPI M/M May | 0.10% | -1.30% | ||
| 12:30 | USD | PPI Y/Y May | -1.10% | -1.20% | ||
| 12:30 | USD | PPI Core M/M May | -0.10% | -0.30% | ||
| 12:30 | USD | PPI Core Y/Y May | 0.90% | 0.60% | ||
| 12:30 | USD | Initial Jobless Claims (Jun 5) | 1877K | |||
| 14:30 | USD | Natural Gas Storage | 102B |


