
Markets remained relatively subdued in today’s Asian trading session with Australian Dollar and Canadian Dollar showing modest strength. The pervasive risk-off sentiment that characterized the overnight U.S. stock market selloff did not extend into Asia, as evidenced by recoveries in both Japan’s Nikkei and Hong Kong’s HSI. Japanese Yen, buoyed slightly by robust Tokyo inflation figures, lacked the momentum for a significant resurgence. Concurrently, Dollar, Euro, and Swiss Franc softened, while British Pound presented a mixed picture.
The market’s attention is now pivoting to the impending release of PCE data. Both headline and core annual readings for September are anticipated to exhibit deceleration, partly attributable to base effects. However, the monthly data could assume greater significance for Fed officials and the broader market. Although these figures are not expected to alter the consensus for another Fed hold on November 1, they remain crucial in evaluating the likelihood of further tightening in December.
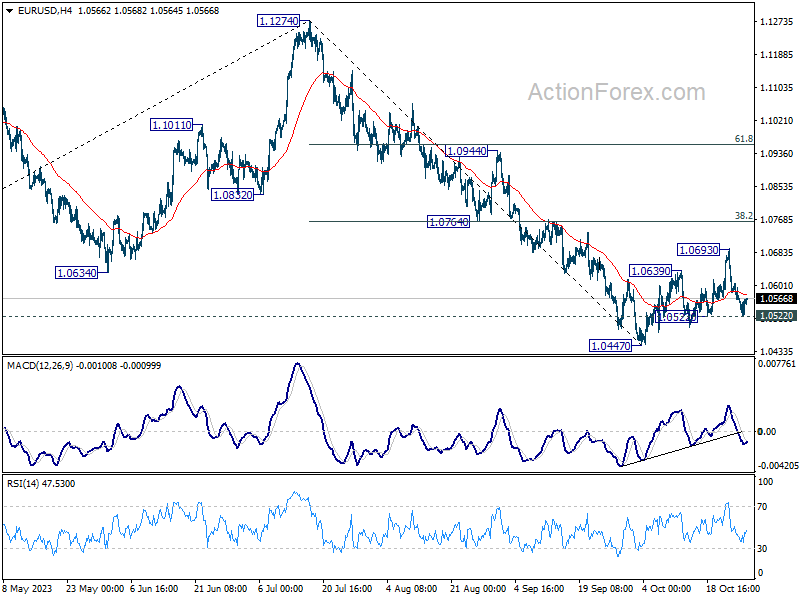
On the technical front, Dollar would be a focus before the weekends, considering that risk aversion in the US could intensify. In particular, break 1.0522 minor support in EUR/USD should confirm that near term corrective recovery from 1.0447 has completed. Larger fall from 1.1274 should then be ready to resume. At the same time, break of 0.9000 minor resistance in USD/CHF would at least set the stage for stronger rebound.
In Asia, at the time of writing, Nikkei is up 1.34%. Hong Kong HSI is up 1.17%. China Shanghai SSE is up 0.50%. Singapore Strait Times is down -0.14%. Japan 10-year JGB yield is down -0.0101 at 0.875. Overnight, DOW dropped -0.76%. S&P 500 dropped -1.18%. NASDAQ dropped -1.76%. 10-year yield dropped -0.108 to 4.845.
NASDAQ set for deeper selloff as key support shattered
US stocks underwent a marked decline overnight, with NASDAQ at the forefront, shedding -1.76% of its value. This follows closely on the heels of Wednesday’s downturn, where the tech-driven index recorded its most significant single-day loss in eight months, plummeting by -2.5%. Notably, several pivotal technical support have been violated, hinting that we might be witnessing the onset of a medium-term downtrend in NASDAQ.
Interestingly, the strong US Q3 GDP figures released overnight did little to lift investor spirits. Paradoxically, these robust economic indicators are fueling concerns about Fed maintaining higher interest rates for an extended period, rather than providing reassurance to the markets.
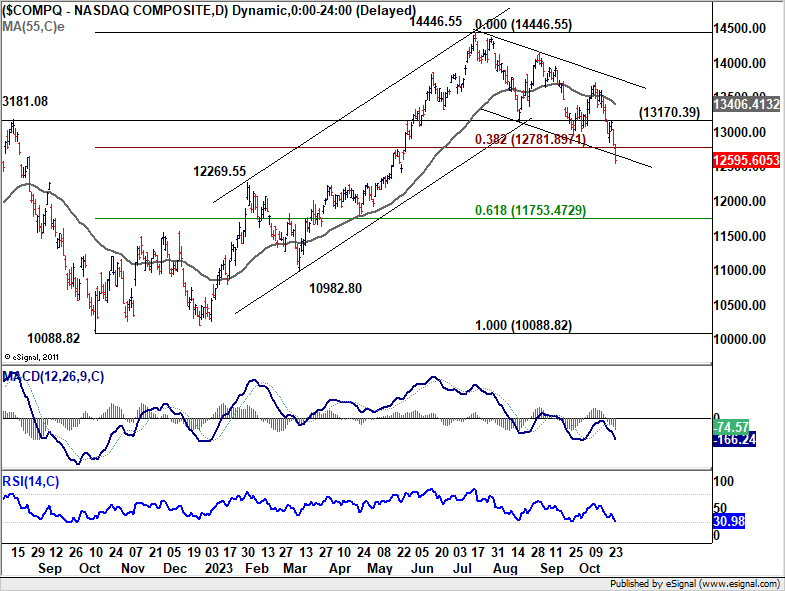
On the technical front, NASDAQ has taken out both 38.2% retracement of 10088.82 to 14446.55 at 12781.89 and 55 W EMA (now at 12826.98). These developments lend notion to the hypothesis that the entire rally from 10088.82 has concluded. Additionally, the break of channel support suggests that the index may be entering a phase of downside acceleration. For the near term, outlook will stay bearish as long as 13170.39 resistance holds. Next target is 61.8% retracement at 11753.47.
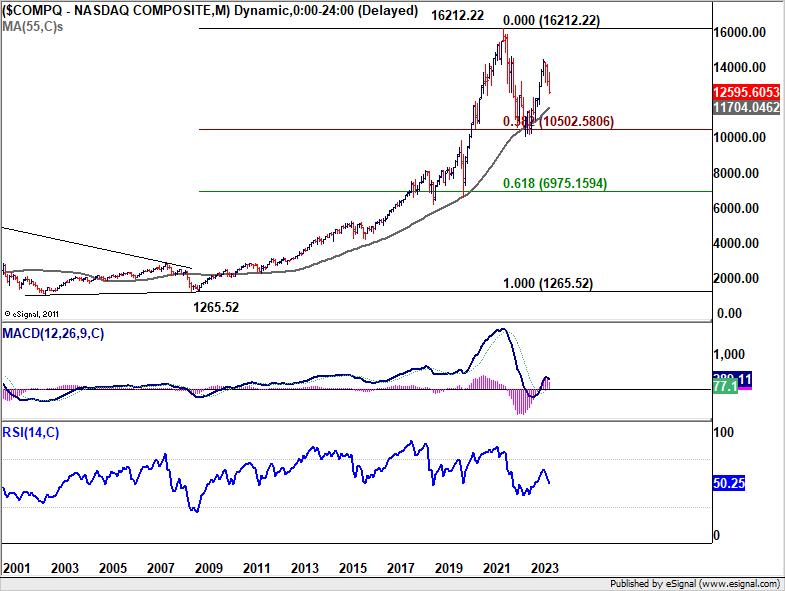
In a broader context, rise from 10088.82 (2022 low) is seen as the second leg of the corrective pattern from 16212.22 (2021 high). In a less bearish scenario, the fall from 14446.55 could merely be a correction to rise from 10088.82. In this case, significant support might emerge around the 55 M EMA (now at 11704.04), close to the aforementioned fibonacci level, triggering a substantial bounce.
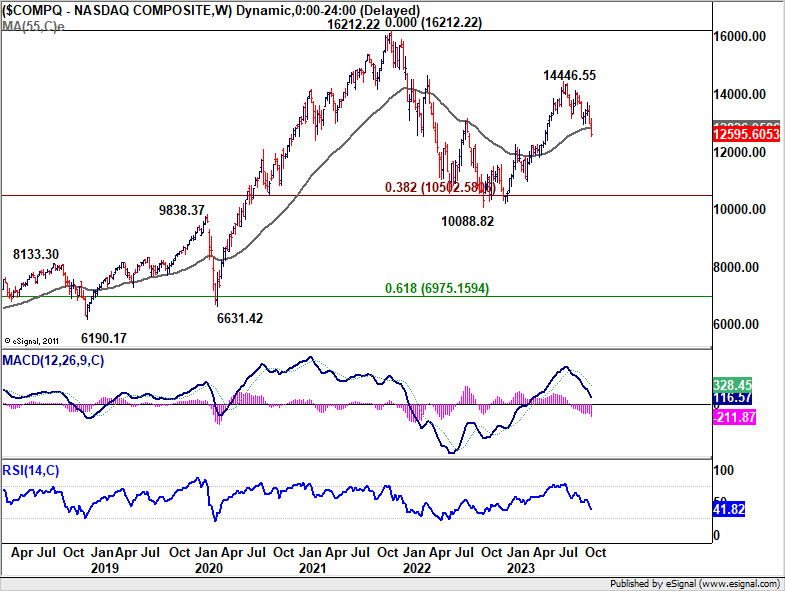
However, in a gloomier perspective, the decline from 14446.55 might represent the third leg of the corrective pattern from 16212.22. This would suggest a more significant and persistent decline, plummeting below 10088.82. While it’s premature to definitively conclude, market’s reaction around 11700 level should provide valuable insights into future trends.
Tokyo CPI signals rising inflation; BoJ likely to upgrade forecasts
In Japan, Tokyo’s headline CPI unexpectedly accelerated from 2.8% yoy to 3.3% yoy in October. CPI core, which excludes the volatile prices of fresh food, also witnessed an acceleration, moving from 2.5% yoy to 2.7% yoy. On the other hand, CPI core-core, which strips out impact of both food and energy prices, marginally slowed from 3.9% yoy to 3.8% yoy, but remained elevated.
An important metric to note is acceleration in services prices, which went from 1.9% yoy 2.1% yoy. The continued uptick in services inflation indicates a more entrenched and broad-based price pressure scenario, suggesting that it could be a prolonged period before inflation retraces its steps back below BoJ’s 2% target.
Considering that consumer inflation in Tokyo often sets the tone for national trends, the data bolsters the anticipation that BoJ might have to upgrade its inflation forecasts. Market participants are now keenly awaiting the fresh quarterly projections that are expected to be unveiled at BoJ’s policy meeting next week.
Looking ahead
US personal income and spending, as well as PCE price index will be the main focus of the day.
USD/CHF Daily Outlook
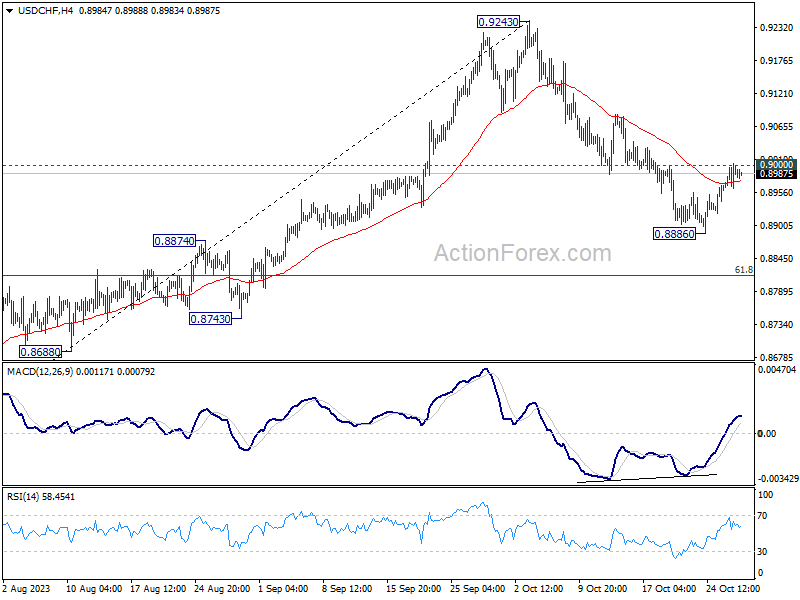
Daily Pivots: (S1) 0.8960; (P) 0.8983; (R1) 0.9011; More….
Intraday bias in USD/CHF remains neutral at this point. On the upside, firm break of 0.9000 resistance will confirm short term bottoming at 0.8886. Intraday bias will be turned back to the upside for stronger rebound, back towards 0.9243. On the downside, break of 0.8886 will resume the fall from 0.9243 to 61.8% retracement of 0.8551 to 0.9243 at 0.8815 next.
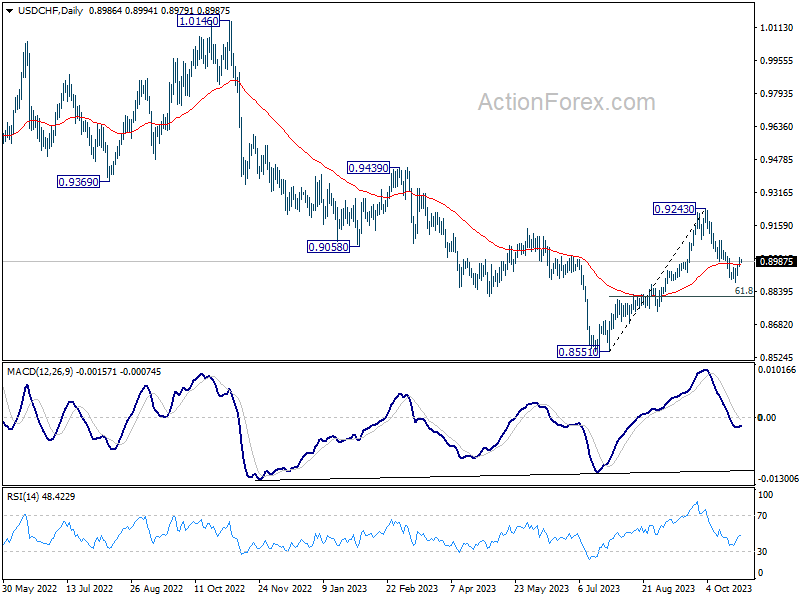
In the bigger picture, rebound from 0.8551 might be completed as a correction at 0.9243. In other words, larger fall from 1.0146 (2022 high) is possibly not over yet. Risk will now stay on the downside as long as 0.9243 resistance holds. Firm break of 0.8551 will confirm down trend resumption.
Economic Indicators Update
| GMT | Ccy | Events | Actual | Forecast | Previous | Revised |
|---|---|---|---|---|---|---|
| 23:30 | JPY | Tokyo CPI Y/Y Oct | 3.30% | 2.80% | ||
| 23:30 | JPY | Tokyo CPI ex Fresh Food Y/Y Oct | 2.70% | 2.50% | 2.50% | |
| 23:30 | JPY | Tokyo CPI ex Food & Energy Y/Y Oct | 3.80% | 3.80% | 3.90% | |
| 00:30 | AUD | PPI Q/Q Q3 | 1.80% | 0.70% | 0.50% | |
| 00:30 | AUD | PPI Y/Y Q3 | 3.80% | 3.90% | ||
| 12:30 | USD | Personal Income M/M Sep | 0.40% | 0.40% | ||
| 12:30 | USD | Personal Spending Sep | 0.40% | 0.40% | ||
| 12:30 | USD | PCE Price Index M/M Sep | 0.30% | 0.40% | ||
| 12:30 | USD | PCE Price Index Y/Y Sep | 3.40% | 3.50% | ||
| 12:30 | USD | Core PCE Price Index M/M Sep | 0.30% | 0.10% | ||
| 12:30 | USD | Core PCE Price Index Y/Y Sep | 3.70% | 3.90% | ||
| 14:00 | USD | Michigan Consumer Sentiment Index Oct F | 63 | 63 |


