
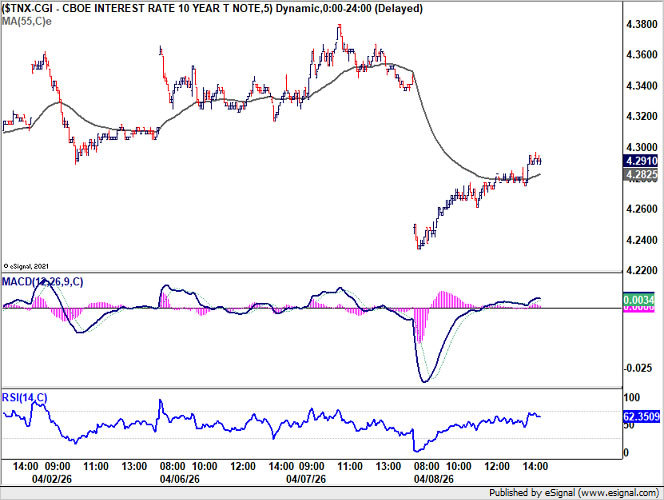
The market reaction to the two-week US-Iran ceasefire is already turning, with signs of rejection of ceasefire optimism emerging across key asset classes. What initially appeared as a decisive de-escalation could be reassessed as a fragile truce, not peace, with markets are pricing risk re-entry as early doubts take hold. The most telling signal lies in the rates market. The US 10-year yield “V-shaped” reversal—from an initial drop to 4.234 overnight, and then back to close 4.291—highlights a sharp shift in sentiment. It should be highlighted that 4.300 was nearly reclaimed.
This is not a stable repricing of lower risk, but a bond market rejecting the peace trade, with the yields rebound signals skepticism on de-escalation. This reversal carries broader implications. It suggests that the rates market are not pricing clean disinflation, as the initial assumption of easing energy pressures is being questioned.
Oil markets reinforce this narrative. Brent’s recovery from near $93 back to around $100 suggests that the war premium is creeping back. FX markets are adjusting in tandem. Dollar is stabilizing and recovering mildly, paring ceasefire-driven losses as euphoria fading. The move reflects a broader shift from optimism to caution.
What’s driving this rapid reversal is not just market positioning, but developments on the ground. The ceasefire is already facing compliance issues, with doubts emerging within the first 24 hours.
Iran’s Parliament Speaker Mohammad Bagher Ghalibaf accused the US of violating multiple clauses. At the center of the dispute is the “Lebanon Gap” as key fault line. While Iran and mediators claim the ceasefire should cover the Israel-Hezbollah front, Washington has rejected that interpretation, with strikes in Beirut continuing. This divergence is not a minor detail—it is a structural flaw in the agreement.
At the same time, the Strait of Hormuz remains a critical uncertainty. Despite reopening headlines, Hormuz still contested despite reopening claims, with Iranian naval threats requiring transit “permission” keeping shipping conditions fragile.
Taken together, these developments explain why negotiations risk collapsing before they begin. Institutional investors could already be pricing in a higher probability that upcoming talks will fail to produce a durable agreement.
Looking ahead, the Islamabad talks is next binary catalyst. A high-level US delegation led by Vice President JD Vance is expected to begin formal talks in Islamabad on Friday to attempt to solidify the “two-week pause” into something more durable. However, If the US insists on “complete denuclearization” and Iran insists on “lifting all sanctions” as prerequisites for a permanent deal, the ceasefire is merely a 14-day clock ticking toward a larger escalation.
In parallel, data like those from MarineTraffic over the next 12 hours will be the ultimate “truth-teller” regarding whether the Strait of Hormuz is actually open for commercial transit or if insurance premiums will remain at prohibitive, war-time levels. Until then, ceasefire is a 14-day clock, not a resolution, and markets are shifting from optimism to conditional skepticism.
In the currency markets, Dollar is the worst performer so far this week, followed by Yen and Loonie. Kiwi leads gains, with Aussie and Sterling also firm, while Euro and Swiss Franc trade in the middle of the pack.
In Asia, at the time of writing, Nikkei is down -0.65%. Hong Kong HSI is down -0.25%. China Shanghai SSE is down -0.73%. Singapore Strait Times is down -0.24%. Japan 10-year JGB yield is up 0.026 at 2.398. Overnight, DOW rose 2.85%. S&P 500 rose 2.51%. NASDAQ rose 2.80%. 10-year yield fell -0.052 to 4.291.
Fed Minutes: Rates Near Neutral, Cuts Still Seen but No Longer a Given
Federal Reserve minutes delivered a clear message: rate cuts are no longer on autopilot. With policy now near neutral, officials signaled that further easing will depend on a sustained decline in inflation—not just expectations. At the same time, Middle East tensions and oil price risks have created a rare two-sided policy dilemma, where both rate cuts and hikes remain possible. Read More.
RBNZ’s Breman: Ready to Act Decisively with Rate Hikes if Inflation Jumps
RBNZ Governor Anna Breman delivered a clear hawkish signal: if inflation starts rising again, the central bank is ready to act decisively with rate hikes. With risks now tilted to the upside, easing is off the table as policymakers focus on preventing a renewed inflation surge. Geopolitical tensions and supply disruptions are adding uncertainty, but the policy bias is clear—RBNZ is prepared to tighten again if price pressures build. Read More.
USD/CHF Daily Outlook
Daily Pivots: (S1) 0.7855; (P) 0.7927; (R1) 0.7985; More….
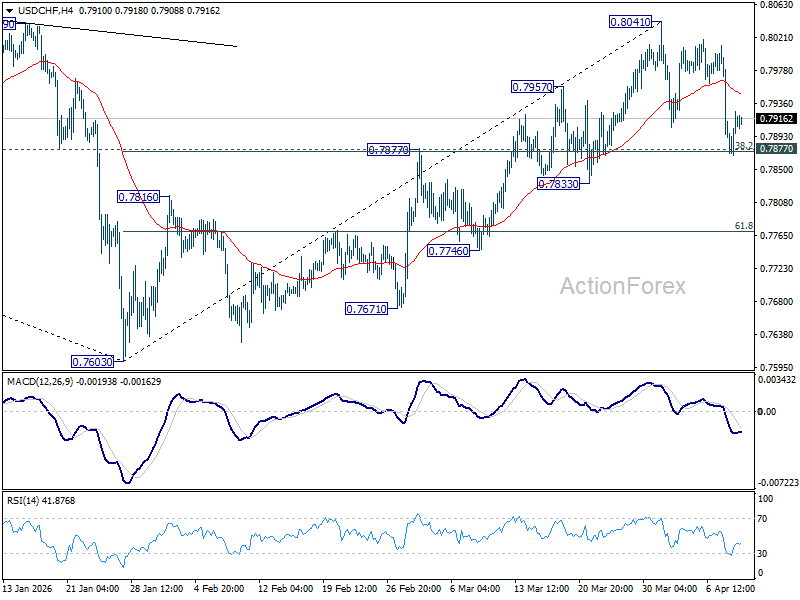
USD/CHF recovered after drawing support from 0.7877 cluster support (38.2% retracement of 0.7603 to 0.8041 at 0.7874). Intraday bias stays neutral first with price actions from 0.8041 seen as a consolidation pattern. With 0.7874/7 intact, rally from 0.7603 is expected to resume through 0.8041 later. However, decisive break of 0.7874/7 will argue that the rise has completed, and bring deeper fall to 61.8% retracement at 0.7770 and below.
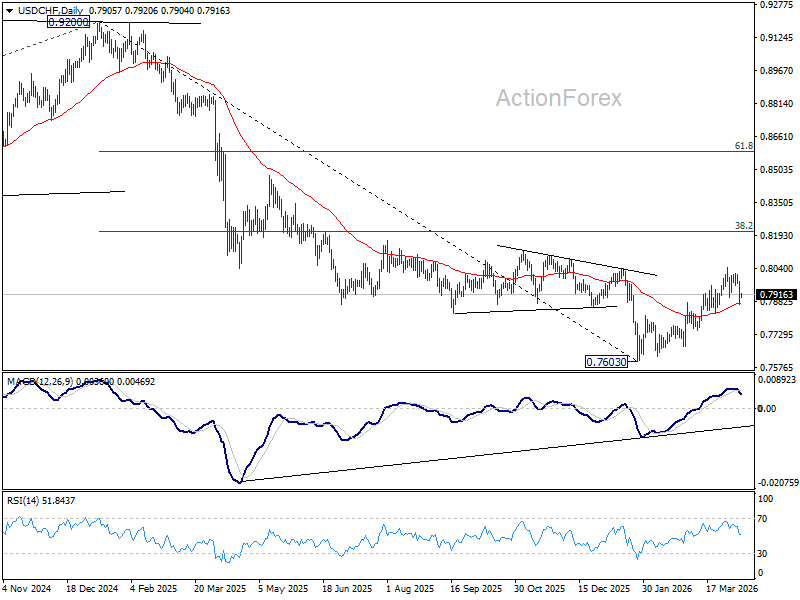
In the bigger picture, rebound from 0.7603 medium term bottom is seen as correcting the fall from 0.9200 only. rejection by 55 W EMA (now at 0.8081) will affirm this case, and setup down trend resumption to 100% projection of 1.0146 (2022 high) to 0.8332 from 0.9200 at 0.7382 at a later stage. Though, sustained break of 55 W EMA will suggest that it’s probably correcting the larger scale down trend from 1.0146 (2022 high).


