
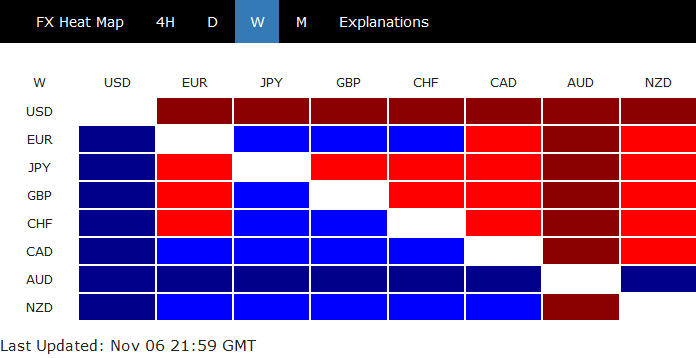
Politics aside, stock investors were the biggest winners of US presidential elections, while Dollar holders were the losers. The greenback ended as the worst performing one, followed by Yen by a wide margin. Australian Dollar shrugged of RBA easing and ended as the strongest, leading other commodity currencies. European majors were mixed, with Sterling as the weaker one after larger than expected BoE QE expansion.
For now, an upside breakout in US indices and downside breakout in Dollar index for the near term, probably within a few days, is our base case. Yet, this view is not totally unquestionable. Treasury traders seemed to be not too excited by the overall market sentiments so far. More importantly, we’re not seeing equally committed rally in Yen crosses comparing to stocks. Probably, the instruments would take a bit more time to align themselves.
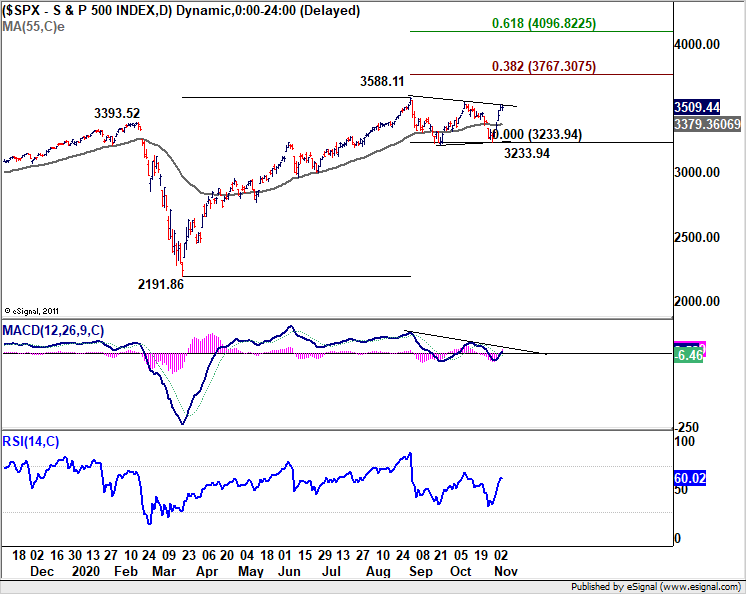
S&P 500 ready to make new record high
US stocks rebounded very positively to election results last week. S&P 500’s strong rally suggests that consolidation from 3588.11 has completed with three waves to 3233.94. An upside break out to resume the larger up trend is now the base case, that might happen within a few days. First target is 38.2% projection of 2191.86 to 3588.11 from 3233.94 at 3767.30. Decisive break there should further solidify medium term bullish outlook for 61.8% projection at 4096.82.
While we don’t expect that to happen, rejection by 3588.11 high, followed by touching (or breaking) or 55 day EMA (now at 3379.36), will mix up the outlook. We’ll need to see what’s happening in this case.
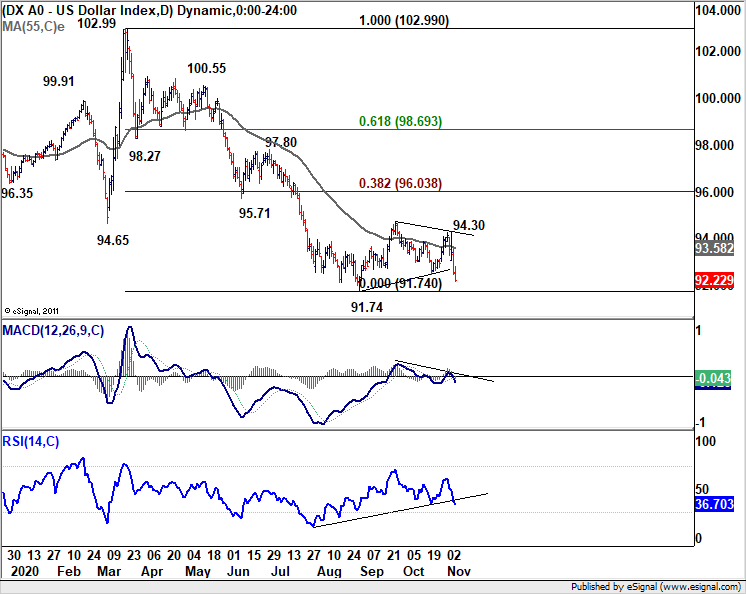
Dollar index also ready to resume down trend
Dollar index’s sharp decline also argues that consolidation from 91.74 has completed at 94.30. Larger fall from 102.99 could be ready to resume through 91.74 low. This will remain the favored case as long as 55 day EMA (now at 93.58) holds. Ideally, downside breakout in DXY should happen within a few days to upside breakout in SPX mentioned above.
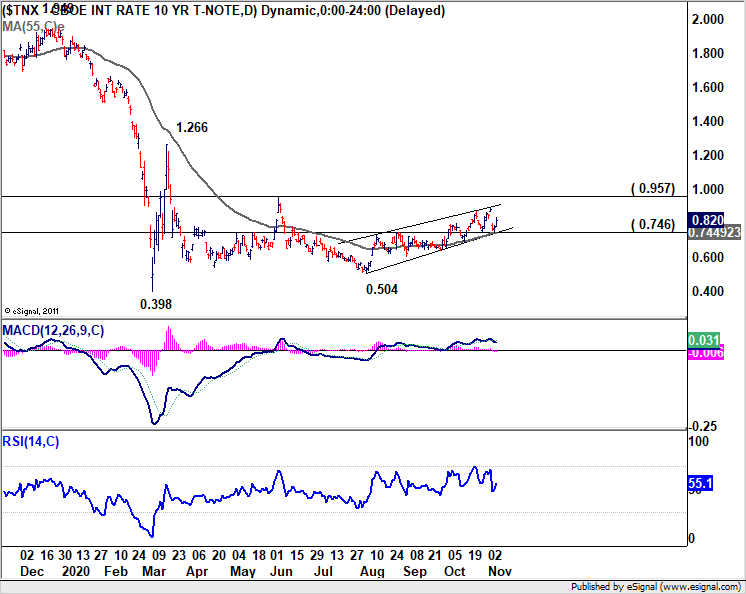
10-year yield suggests investor could still be cautious
However, the above outlook is not without risks. A misalignment is the development in 10-year yield, which was barely supported by 0.746 support and 55 day EMA. The subsequent rebound was also weak. Admittedly, we’d expect loss of upside momentum even in case of another rise, as strong resistance should be seen from 0.957 to cap upside. But another rally in treasury, which pushes TNX through 0.746 support, could be a sign that investors were not totally optimistic at all.
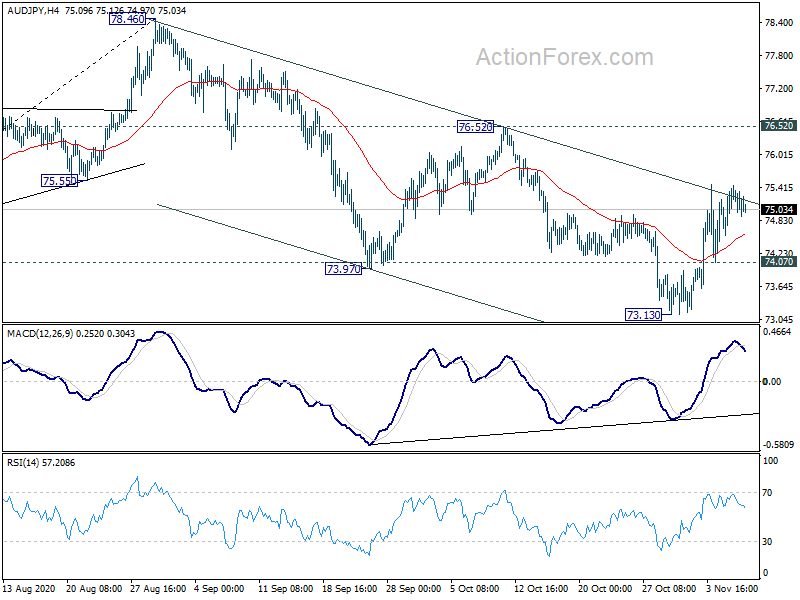
Yen crosses not agreeing to strong risk-on sentiment
The bigger counter argument to risk-on markets was indeed the lack of committed selling in Yen. In particular, AUD/JPY struggled to maintain upside momentum after hitting near term trend line resistance. It’s still far from 76.52 resistance for confirming completion of correction from 78.46. A break back below 74.07 support could be a strong hint that the risk markets are reversing.
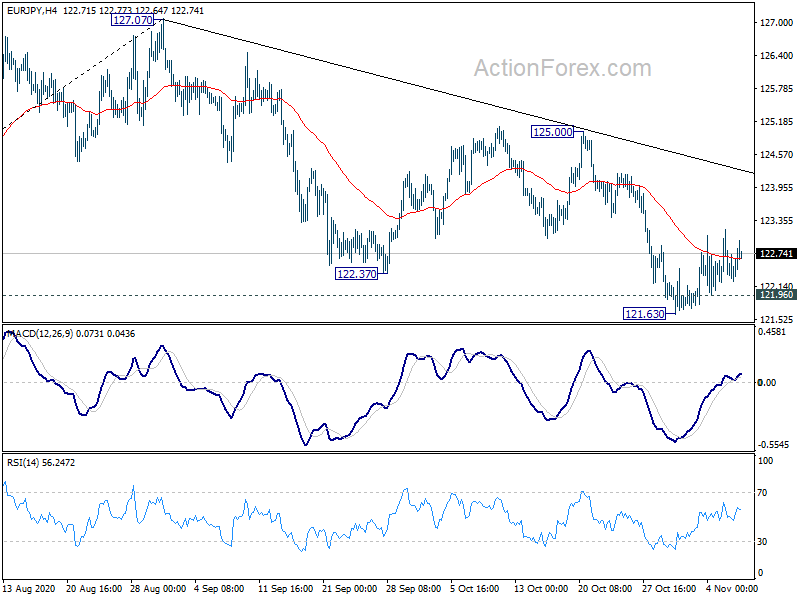
Similarly, EUR/JPY’s recovery was also very disappointing, considering the strong rise in stocks. A break below 121.96 minor support should extend the correction from 127.07 through 121.63 temporary low. We’d hope to see which way the markets are heading to very soon.
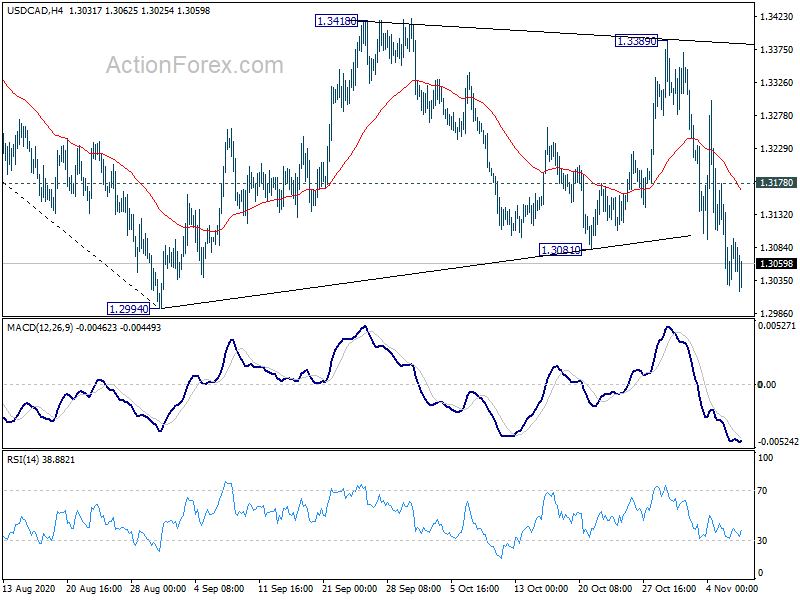
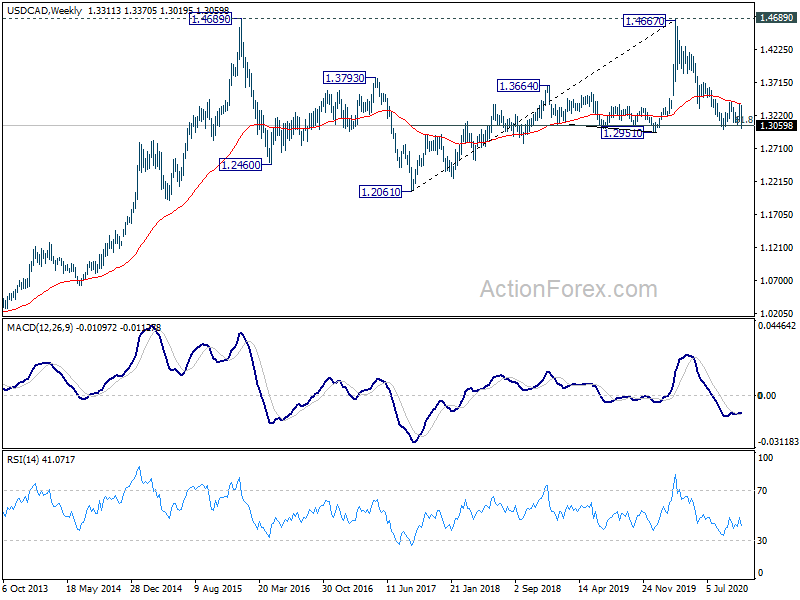
USD/CAD Weekly Outlook
USD/CAD’s sharp fall last week and break of 1.3081 support argues that consolidation pattern from 1.2994 might have completed at 1.3389 already. Initial bias stays on the downside this week for retesting 1.2994 first. Firm break there will resume larger down trend from 1.4667. On the upside, however, break of 1.3178 resistance will mix up the near term outlook again and turn intraday bias neutral first.
In the bigger picture, fall from 1.4667 is seen as the third leg of the corrective pattern from 1.4689 (2016 high). Rejection by 55 week EMA is keeping outlook bearish. Sustained break of 61.8% retracement of 1.2061 to 1.4667 at 1.3056 will target a test on 1.2061 (2017 low). But we’d expect loss of downside momentum as it approaches this key support. On the upside, firm break of 1.3715 resistance will argue that this falling leg has completed and turn focus back to 1.4667/89 resistance zone.
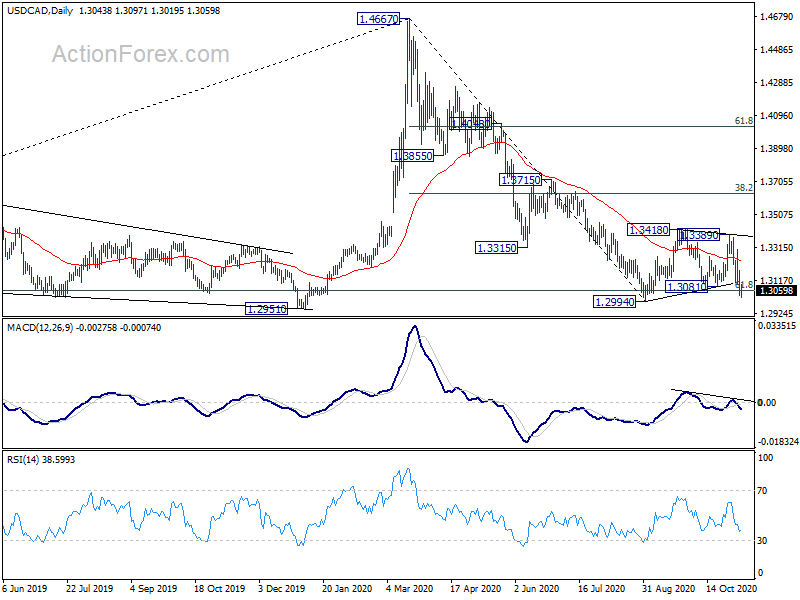
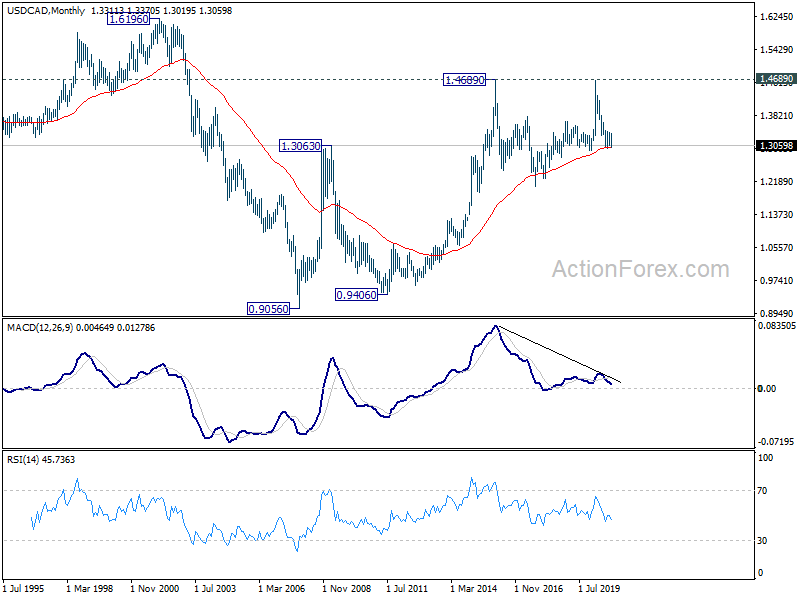
In the longer term picture, the bullish case of resuming the up trend from 0.9506 (2007 low) is delayed. Consolidation from 1.4689 is extending for another medium term fall. As long as 1.2061 support holds, such up trend should still resume through 1.4689 at a later stage.


