
Last week, investors were caught off guard by a series of surprises. However, the largest bank failure in the US since 2008 proved to be the most overwhelming for them. The risks of contagion from Silicon Valley Bank appeared to outweigh concerns about higher interest rates, inflation, and recession. Consequently, traders sought safety, resulting in the biggest rally in US treasuries in a decade, and steepest selloff in stocks in months.
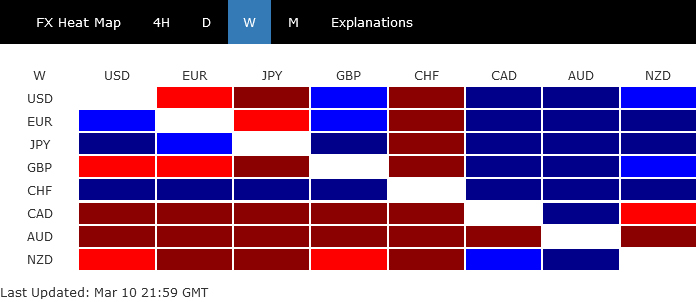
Swiss Franc and Yen emerged as the strongest currencies for the week, propelled by risk aversion and additional by falling treasury yields. Euro finished in third place, while Dollar had mixed results, responding more to falling yields than risk aversion. Commodity currencies finished notably lower, led by Australian Dollar, while Sterling was also weaker.
Going forward, the news on SVB will be the primary market driver in the near term. If the situation in the banking sector deteriorates, risk-off sentiment may intensify. However, if the situation stabilizes, attention will return to inflation and central bank policies.
Sudden collapse of Silicon Valley Bank shakes markets, overshadows Fed tightening talks
Last week was a tumultuous one for the markets, with concerns about tighter monetary policy by Fed dominating the first half. However, investors were then primarily focused on the sudden collapse of Silicon Valley Bank, the biggest bank failure in the US since the global financial crisis. DOW fell almost -1,500 points, or over -4%, during the week, marking the worst one-week selloff since June. Safe-haven flows even triggered the biggest two-day decline in Treasury yields since 2008.
At one point during the week, the probability of a 50bps rate hike by Fed in March exceeded 70%, following unusually hawkish comments by Fed Chair Jerome Powell during the semi-annual testimony to Congress. By the end of the week, the chance had dropped to around 40%. While the mixed non-farm payroll report may have played a role in shifting expectations, the risk of contagion from Silicon Valley Bank in the banking system could curtail Fed’s willingness to accelerate tightening. If negative effects emerge, they could eventually force Fed to cut back interest rates earlier.
Uncertainties will persist until the Fed’s next decision on March 22, with new economic projections to be published by then. On March 14, the release of CPI data will provide another important piece of information. With various paths that developments in Silicon Valley Bank could take, sentiment is likely to remain volatile.
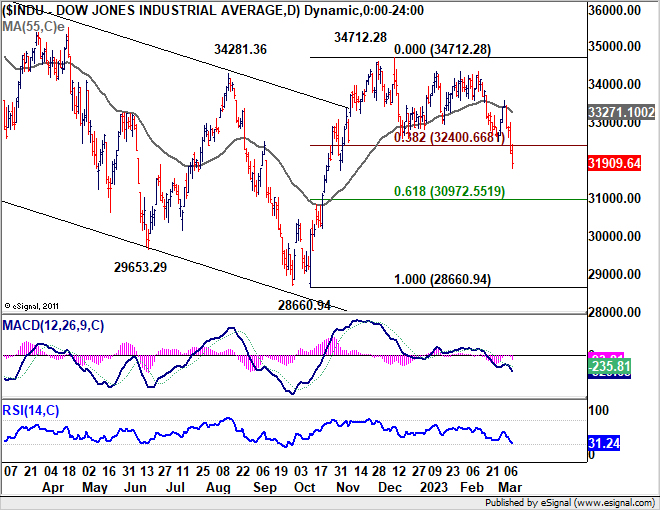
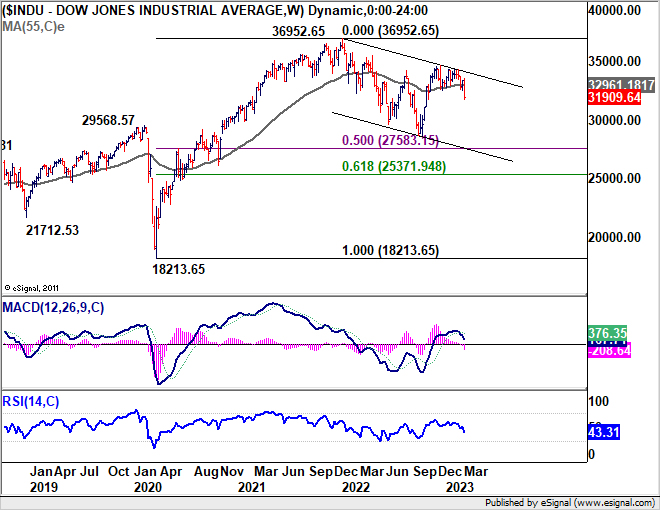
DOW broke key support level, heading to 30972 next
DOW break through an important support of 38.2% retracement of 28660.94 to 34712.28 at 32400.66 decisively with last week’s selloff. 55 week EMA (now at 32961.18) was also taken out firmly. The development raises the chance that the rebound from 28660.94 has already completed. Whether that’s the case or not, deeper fall is now expected as long as 55 day EMA (now at 33271.10) hold, to 61.8% retracement at 30972.55.
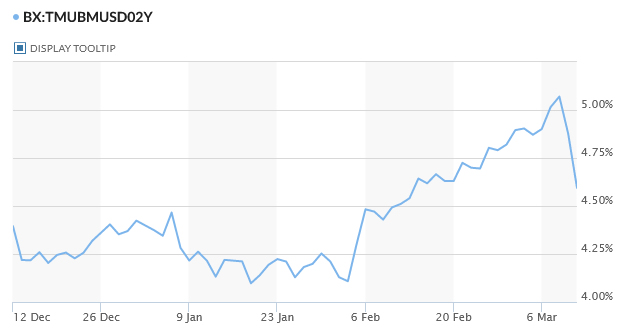
Treasury yields tumbled as investors seek safety
Massive flight-to-safety flows drove US treasury yields sharply lower last week. Yield of 2-year Treasury note hit as high as 5.096 before reversing to close at 4.58. That’s two-day decline for 2-year yield since September 2008.
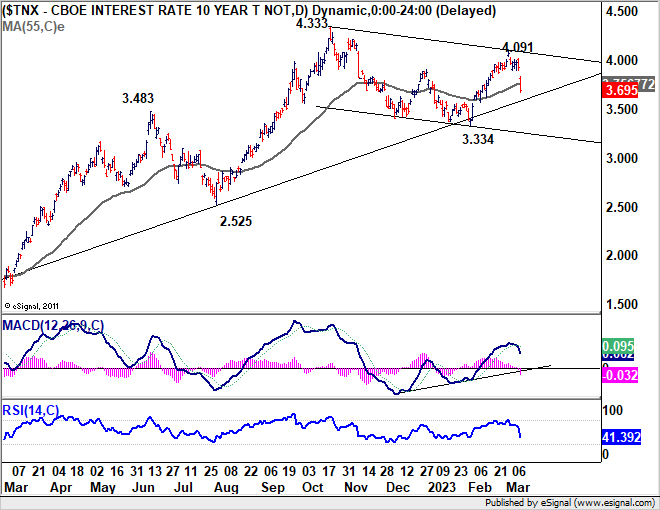
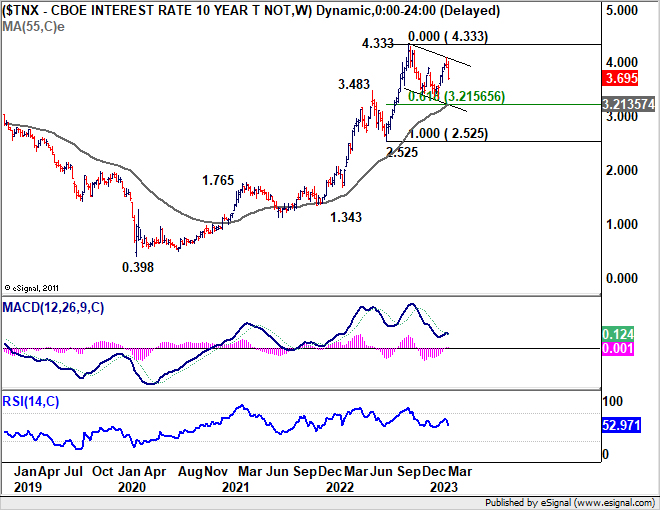
10-year yield gapped down on Friday and extended the fall to close at 3.695. The strong break of 55 day EMA suggests that rebound from 3.334 has completed at 4.091. More importantly, fall from 4.091 is now potentially another falling leg inside the corrective pattern from 4.333. Risk will stay heavily on the downside unless the gap at 3.832/3.894 is closed. Further fall is in favor back to 3.334, or even to 55 week EMA (now at 3.213).
Dollar index to defend 55 day EMA, or could it?
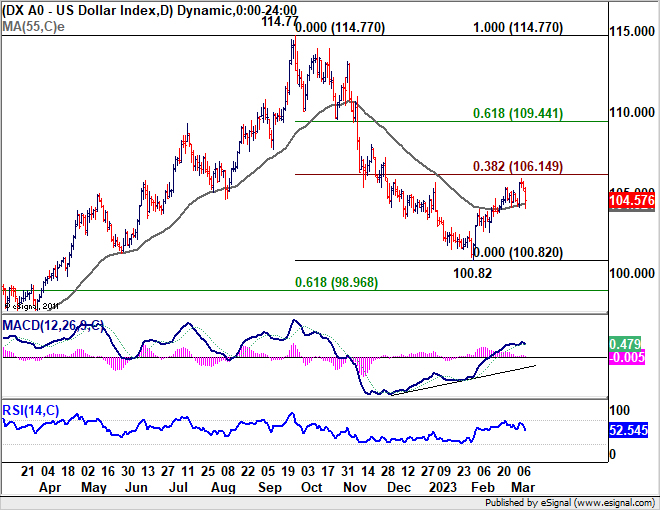
Dollar index initially jumped to 105.88 but was rejected by 38.2% retracement of 144.77 to 100.82 at 106.14, and reversed from there. Rise from 100.82 still perfectly fits into a corrective move category. But strong risk appetite was not the reason capping Dollar’s advance as envisaged. Instead, it was the sharp decline in Treasury yields that overshadowed the support to the greenback from risk-aversion.
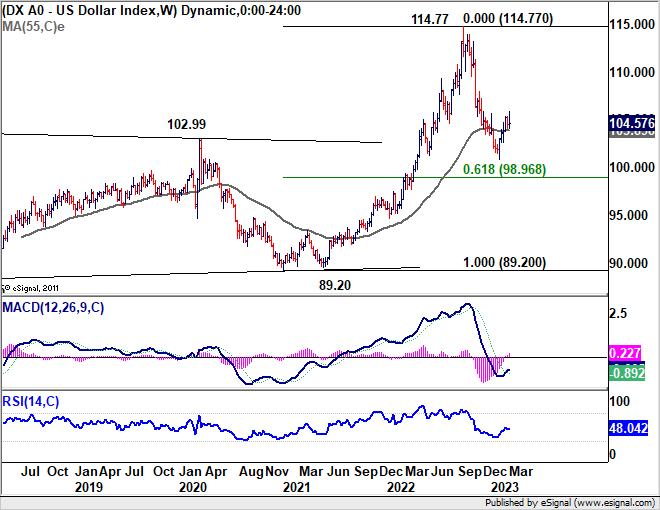
With a close about 55 day EMA (now at 104.32), it’s not the end of the world for DXY yet. Another rally attempt could still be seen. But even so, firm break of 106.14 fibonacci level is not expected. Sustained trading below the 55 day EMA will argue that the corrective rise from 100.82 has completed, and open the door to retest this low.
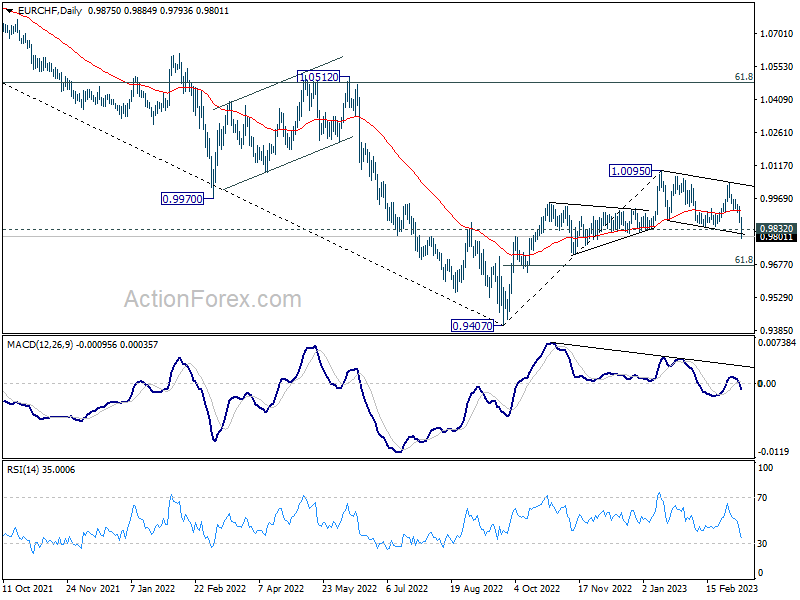
EUR/CHF broke key support as Franc flexes muscles
Swiss Franc ended as the biggest winner of the week as smart money could have started jump into this safe harbor on Thursday. In the background, the Franc is also supported by expectation of further tightening by SNB after stronger than expected February CPI reading.
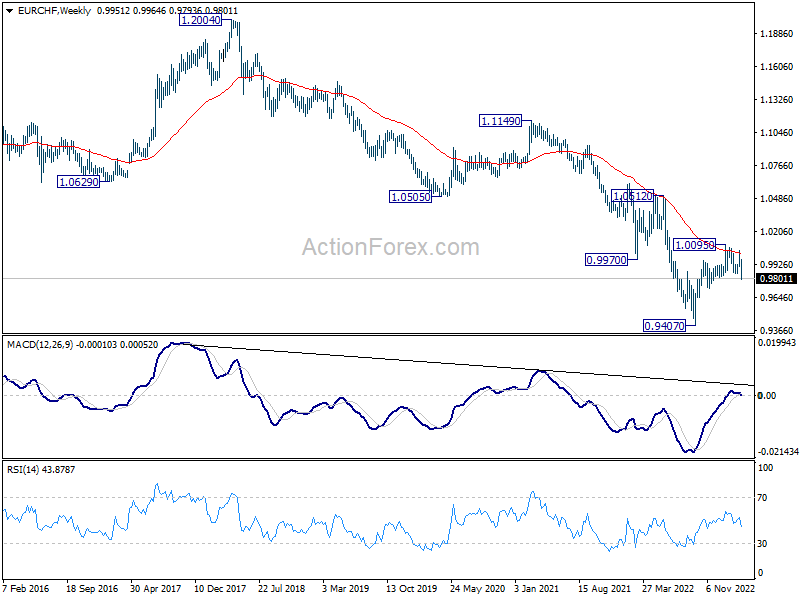
Taking a look at EUR/CHF (while Euro wasn’t really the worst performer already), the development was rather bearish. The break of 0.9832 support suggests that rebound from 0.9407 has completed at 1.0095 already, on bearish divergence condition in daily MACD. That came after rejection by 55 week EMA. Break of near term channel support suggests downside acceleration, as backed by the dip in daily MACD too.
So further decline is now expected as long as 55 day EMA (now at 0.9915) holds. Next target is 61.8% retracement of 0.9407 to 1.0095 at 0.9670. Sustained break there will bring deeper fall to retest 0.9407 low, or even below to resume larger down trend from 1.2004 (2018 high).
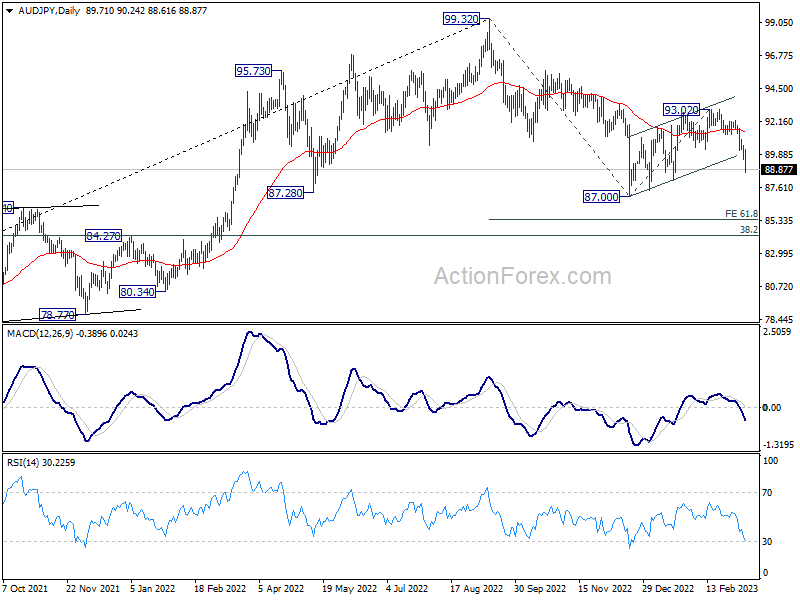
AUD/JPY ready for decline resumption after RBA signals pause is coming
Australian Dollar was staying in pressure in risk-averse environment. RBA delivered the 25bps rate hike as expected. The indication of a potential pause was a surprise, but that shouldn’t be delivered after at least one more hike in April.
Meanwhile, BoJ stood pat and Governor Haruhiko Kuroda indicated his last meeting that the bank was in no hurry to exit ultra-loose monetary policy. Yen was originally pressured during the week but rebounded strongly on falling treasury yields.
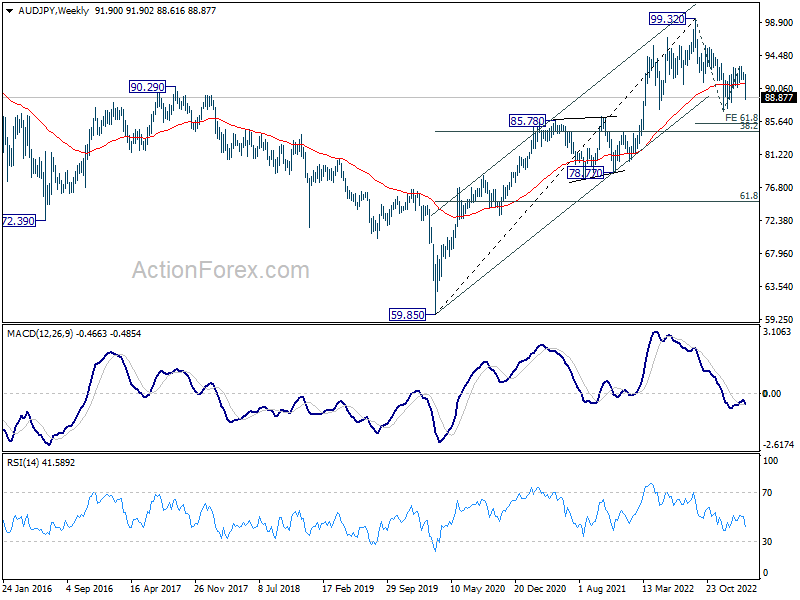
AUD/JPY’s steep decline and the strong break of the near term falling channel indicates that corrective rebound from 87.00 has completed at 93.02 already. Deeper fall should be seen next. Firm break of 93.02 will resume the whole decline from 99.32, as a correction to the up trend from 59.85 (2020 low). Next target will be 61.8% projection of 99.32 to 87.00 from 93.02 at 85.40.
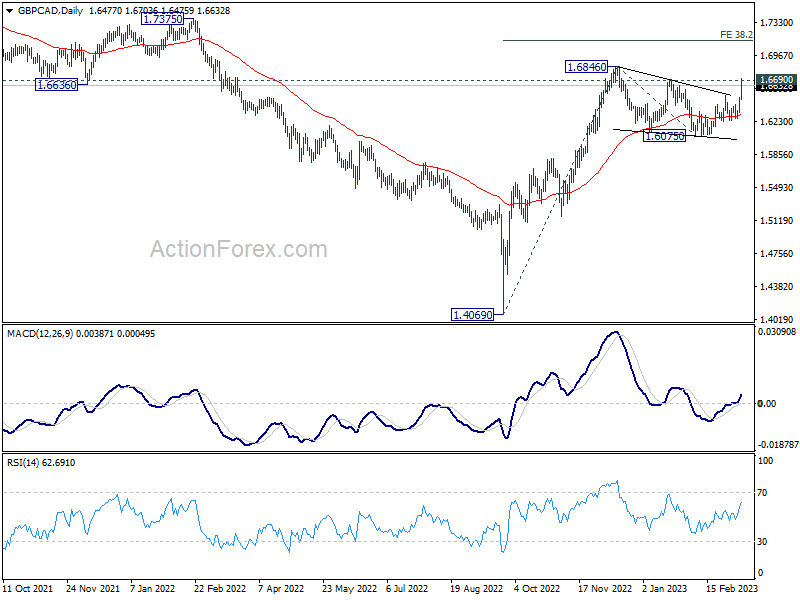
GBP/CAD eyeing upside breakout after BoC started conditional pause
Another commodity currency Canadian Dollar was also weak. BoC formally started its conditional pause and it’s unlikely to alter course any time soon. Meanwhile, recent economic data from the UK indicated that even if there is another GDP contraction in Q1, it would be a shallow one. While opinions among BoE MPC members are split, tightening is still set to continue.
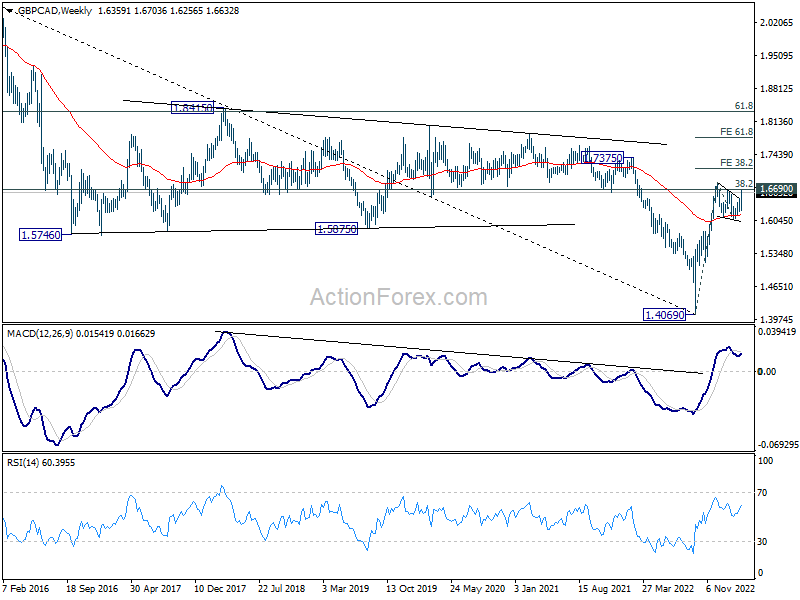
GBP/CAD’s strong rally and breach of 1.6690 resistance argues that corrective pattern from 1.6846 has completed at 1.6075 already. That dame after drawing support from 55 week EMA, which is a medium term bullish signal.
Further rise is in favor to retest 1.6846 high first. Sustained break there will resume whole up trend from 1.4069 to 38.2% projection of 1.4069 to 1.6846 from 1.6075 at 1.7136 next.
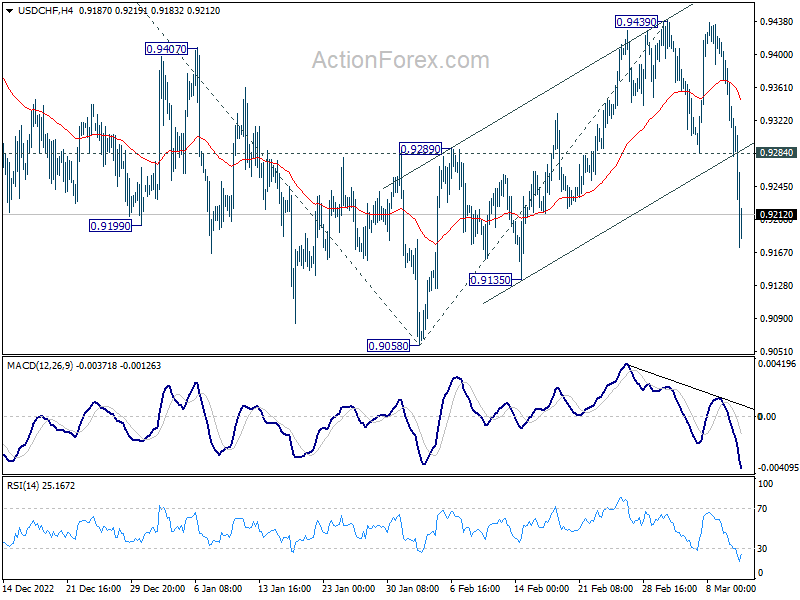
USD/CHF Weekly Outlook
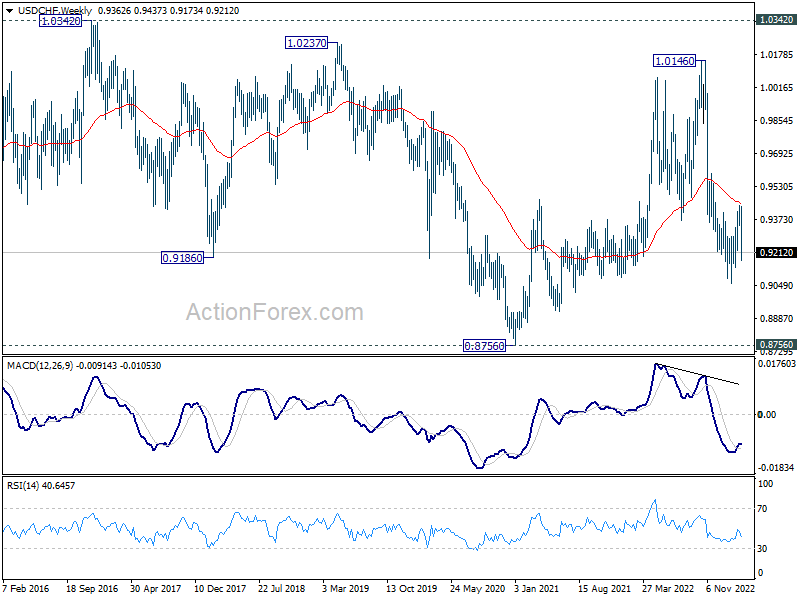
USD/CHF’s sharp decline last week suggests that corrective rebound from 0.9058 has completed at 0.9439 already, ahead of 38.2% retracement of 1.0146 to 0.9058 at 0.9474. Initial bias stays on the downside this week for retesting 0.9058 low. Decisive break there will resume larger down trend from 1.0146. Next target is 61.8% projection of 1.0146 to 0.9058 from 0.9439 at 0.8767. On the upside, above 0.9284 minor resistance will turn intraday bias neutral first. But risk will now stay on the downside as long as 0.9439 resistance holds.
In the bigger picture, fall from 1.1046 (2022 high) is should still be in progress with 38.2% retracement of 1.0146 to 0.9058 at 0.9474 intact. Rejection by 55 week EMA is also a medium term bearish sign. Break of 0.9058 will resume such decline towards 0.8756 support (2021 low). But overall, such fall is still as a leg in the long term range pattern from 1.0342 (2016 high). So, downside should be contained by 0.8756 to bring reversal. For now, this will remain the favored cas as long as 0.9439 resistance holds.
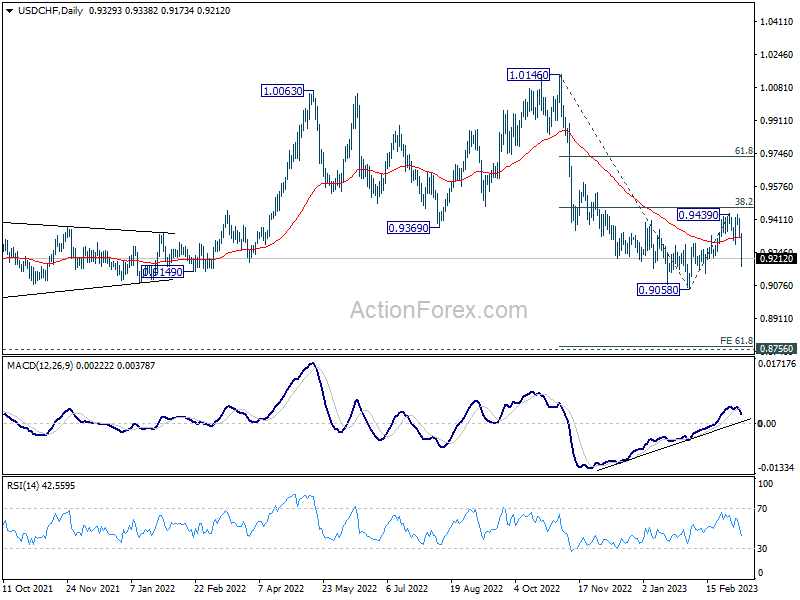
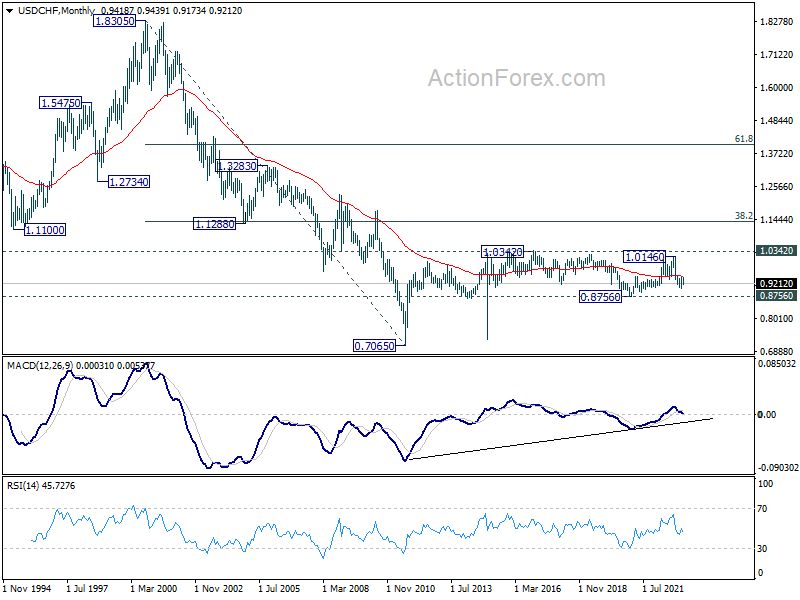
In the long term picture, long term sideway pattern from 1.0342 (2016 high) is extending. Overall, range trading should continue until further development.


