Week beginning 4 June 2018
- RBA on hold next week; balance of rate risks not so skewed to the upside.
- Australia: RBA policy decision, GDP, retail sales, current account, trade balance.
- NZ: building work, Queen’s Birthday.
- China: trade balance, foreign direct investment.
- Euro Area: GDP 3rd estimate.
- US: trade balance.
- Key economic & financial forecasts.
Information contained in this report current as at 1 June 2018.
RBA on Hold Next Week; Balance of Rate Risks Not So Skewed to the Upside
The Reserve Bank Board next meets on June 5. It is certain to leave the cash rate unchanged at 1.50%.
As usual the Governor’s Statement will be of interest. However there were a number of developments in the Bank’s communications that we saw last month in the Statement on Monetary Policy and the Board Minutes that did not appear in the much briefer Statement.
Of most interest to me was the comment in the minutes that “it was more likely that the next move in the cash rate would be up, rather than down”. That comment also appeared in the April minutes and is now going to somewhat restrict the Bank’s flexibility. If it leaves that comment out of future minutes the implication is likely to be that the Bank’s forecasts have changed such that the balance of risks may have moved.
Recall that the RBNZ Governor on May 10 surprised markets by altering the previous rhetoric to, “The direction of our next move is equally balanced, up or down. Only time and events will tell”.
The other interesting communication from the minutes was “members assessed that while this progress was unfolding it would be appropriate to hold the cash rate steady and for the Reserve Bank to be a source of stability and confidence”.
This sounds as if the Bank now sees steady rates as a ‘badge of honour’ rather than having to defend steady rates in a world where central banks in other developed economies (US; Canada; UK) are raising rates.
Of course there was an interesting change in the Bank’s forecasts which were released three days after the May 1 Board meeting. While the 2018; 2019; and 2020 (H1) forecasts for growth and inflation were unchanged from the February forecasts the Bank did push back the outlook for the labour market with the unemployment rate not reaching 5.25% until June 2019 rather than June 2018. It retained the view that the unemployment rate would stay at 5.25% until June 2020.
This is interesting given that on May 15 the Deputy Governor Debelle gave a speech where he identified a possible risk being that “it may take a lower unemployment rate than we currently expect to generate a sustained move higher than the 2% focal point evident in many wage outcomes today”.
But the Bank’s own forecast for the unemployment rate by mid-2020 is 5.25%. Most economists who analyse the Australian economy have assessed that Australia’s full employment rate is around 5%. Evidence from labour markets such as the US and UK point to the full employment rate being lower in this global cycle than in previous cycles because of structural changes around low productivity growth; insecurity around technology; limited pricing power of employers; low inflationary expectations; globalisation and so on. So that supports the prospect that the RBA is overly optimistic around the wages outlook which then raises doubts about their confident rhetoric around eventually raising rates.
The Deputy Governor further links higher rates to wages by noting that “it is important to think about the environment in which interest rates would be rising. That environment is highly likely to be one where wages and household incomes are also growing faster than currently, improving the ability of households to afford higher mortgage payments”.
Risks around household balance sheets cannot be under estimated. We understand that the Reserve Bank does not expect any negative wealth effects from falls in house prices. (On a six month annualised basis using CoreLogic data, Sydney is -6.3%; Melbourne -3.2%; Perth -1.1%). That is because the impact on consumption during the upswing period for house prices was considered to be muted. However that consumption weakness was at a time of weak income growth and we did see some fall in the savings rate in NSW and Victoria – the two states at the centre of the housing boom that were less exposed to income weakness. Consequently it is too soon to assume that a period of weakening house prices will not be associated with somewhat softer consumption than would normally be associated with the pace of income growth.
These negative prospects for the housing market are not only manifesting in price weakness but credit is also softening. In particular investors are responding to a number of headwinds – prospects for falling prices; likely tax changes if there is a change of government next year; tightening credit availability as banks are focussing on expenses and incomes of borrowers as well as controls on verifying existing debt; and shrinking rental yields, particularly in Sydney as rising land taxes bite on houses.
The chart below shows that new lending to investors has fallen by around 30% from the recent peak. We had a similar fall in 2016 but that reversed in the wake of the RBA’s rate cuts in both May and August 2016. The Governor is clearly signalling that the next rate move has to be up. Consequently, we cannot be sure of the size and duration of this current correction to both prices and credit.
It is the accepted view that the evidence of the housing market’s response to the 2016 rate cuts (a very strong revival of both prices and credit) sits as a lesson to the RBA that housing will always be highly responsive to lower rates. While never publicly stated, that really precludes any possibility that the RBA could move on rates if wages remain benign; a negative wealth effect emerges; residential construction slows; and the global environment disappoints, (we know the RBA is cautious about China; markets are signalling real concerns about emerging markets; and Europe has turned with the recent developments in Italy coupled with a clear slowing in the data).
However, the current conditions might be different. House prices are higher than in 2016; the banks’ credit policies and procedures are tighter; political uncertainty is more acute; and global confidence may be easing.
Westpac’s core view is rock solid that the cash rate will remain on hold in 2018 and 2019. However, the balance of risks seems less skewed to the upside than is currently indicated by the official view that the next move in rates is going to be up.
The week that was
‘Economic developments have been overrun by political malaise’ has become a familiar refrain this year. Before we discuss the implications, first we turn to the Australian data.
The big release was the Q1 CAPEX (capital expenditure) survey. Here we saw investment activity in the quarter come in between our and the market’s expectations, with a 0.4% gain recorded. That the upside surprise came through in equipment spending (+2.5% against a flat expectation) meant that we revised up our forecast for Q1 GDP from 0.8% to 0.9%, leaving annual growth at 2.8%yr – broadly in line with trend/ potential growth. The survey also receives a lot of attention because it offers a view on investment over both the current and coming financial years. Estimate 6 for the current financial year to June 2018 now indicates that investment will be 3.8% higher than a year ago, slightly higher than estimate 5’s projection of 2.5% three months ago. However, estimate 2 for the coming 2019 financial year was revised down a touch, from a gain of 3.5% three months ago to 1.4% now. We must caution that estimate 1 and 2 are typically inaccurate indicators of the final outcome, with services investment (in particular) often revised up through the year.
The other key Australian data release this week was April dwelling approvals. This outcome came in below expectations of a 3% fall at –5%, and the detail was also soft. As has been the case through this cycle, the headline result was determined by the pipeline of private unit approvals, which in the month fell 11.5%. The particularly volatile high rise sub category was down 20% in the month. By state, compared to a year ago, unit approvals are still up materially in Victoria (despite a sharp drop in April) but are down in NSW and Qld. Site purchase data implies that this downtrend will continue. Outside the unit market, medium-density approvals also fell 6% in April, and the trend for renovation approvals has also turned down. On housing, also note that the latest edition of Westpac Economic’s Housing Pulse was released this week, covering the effect of macro and microprudential reforms on the market and the array of conditions across the states.
Then to China. This week saw the release of the official May PMI report. In contrast to many other major nations across the globe, this survey highlighted that manufacturing conditions improved in the month in China to the strongest level since September 2017, and before that July 2011. Though global momentum looks to have slowed marginally, external demand for Chinese manufactured goods strengthened in the month, as did domestic demand. It is likely that this is a peak for momentum overall; however, China will probably be able to sustain momentum better than most. So far in 2018, we have seen fixed asset investment recover from its 2017 lows, while growth in the consumer sector sustained a robust pace. This combination is not enough to stop aggregate growth slowing, but it will form a strong foundation for growth to remain near the level authorities are targeting for 2018 (“around 6.5%”). We are forecasting growth of 6.3% and 6.1% for China in 2018 and 2019, down from 6.9% in 2017.
Finally to Europe and the US. This week saw Italian bond yields surge (very briefly) to crisis levels on anxiety over whether the anti-establishment parties could form a coalition government. This ‘crisis’ had a lifespan of a day as a rearranging of ministerial duties within the coalition did enough to gain the President’s approval. Whether this coalition proves capable of working together and being productive are entirely different matters for which only time will tell. As we end the week, tensions are now growing in Spain after reports Prime Minister Rajoy will lose a ‘no confidence’ motion against him, due Friday. This would see a caretaker government take over, led by the leader of an opposition party that only holds a quarter of the seats in parliament. This week’s outcome in Italy and the likely result in Spain speak to the real concern for Europe: the continued absence of governments capable of reform. As the support to growth from surging consumer credit recedes, the absence of productivity and income growth will be felt all the more.
We now need to add another layer of uncertainty to the outlook. This is because, as their latest temporary exemption ran out, President Trump announced that the steel and aluminium tariffs already levied on countries like China will now also apply to Europe; Canada and Mexico. Europe will retaliate and this will likely see the US introduce yet more measures to ‘assert its strength’. In addition to the aforementioned importance of productivity and income, the significance of external demand to the Euro Area growth story also cannot be understated. This is yet another cause to for caution over the Euro Area’s prospects.
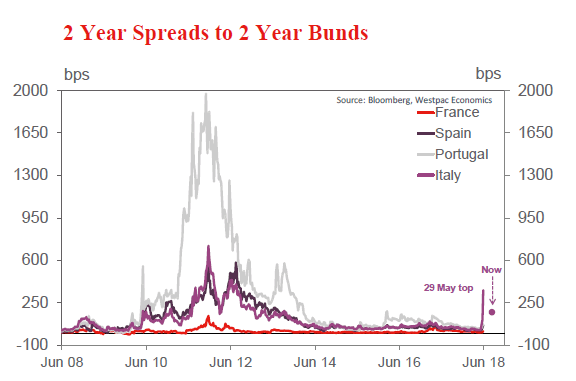
Chart of the week: European politics
Yields on Italian 2 year bonds surged 190bps on Tuesday sparked by escalated political uncertainty.
After President Mattarella rejected the appointment of the 5-star and League party coalition’s nomination of Savona as finance minister, concerns mounted that a government may not be formed and Italy would be heading for another general election.
By the next day, caution eased on prospects of the coalition being saved and on the following day, a new coalition was put forth and then approved by the President. Yields have moved back lower but remain higher than before.
As we go to press, attention turns to the vote of no-confidence in Spain scheduled to take place on Friday. The confirmation of the Basque National Party’s position against Rajoy has incrementally tipped the scales against the incumbent Prime Minister.
New Zealand: week ahead & data wrap
Wait for it
The Reserve Bank has held fire for now on any changes to its restrictions on bank mortgage lending. We still think that the case for an easing of the restrictions will be made by the end of this year, as a range of government policies weigh on house prices. A softer housing market will also have a bearing on the wider economy, where confidence in the outlook is already fragile.
This week the Reserve Bank released its six-monthly Financial Stability Report, a wide-ranging review of New Zealand’s financial system. The overall conclusion was that the risks to the system were little changed from six months ago, with the main areas of concern being household debt, dairy sector debt and exposure to international shocks.
The main area of interest for us was whether there would be any further changes to the macro-prudential restrictions on housing lending. In the last review in November, the RBNZ loosened the loanto- value ratio (LVR) restrictions slightly, allowing investors to borrow up to 65% of the value of a house, and increasing the share of loans to owner-occupiers that can be made at an LVR above 80%.
The RBNZ also indicated that it would ease the restrictions further if it was satisfied that house price and credit growth had slowed to around the rate of household income growth, and that there was a low risk of the housing market taking off again. It’s a close call as to whether those conditions have been met. House prices are up 3.8% in the last year, while credit growth is running at 5.7%yr. Comparable figures for household income growth aren’t yet available, but last year it was running just above 5%.
In the event, the RBNZ decided against any changes to the LVR restrictions for now. However, it appeared more conservative than before on the prospect of an easing, noting concerns about the high level of household debt (rather than just the rate of growth). It was also notably less specific about the conditions for easing: “if housing market risks decline and banks maintain prudent mortgage lending standards”.
Despite the imprecision of these criteria, we still think that the conditions for an easing of the LVR restrictions will be met before the end of this year. The Government is introducing a series of new policies aimed at cooling investor demand for housing, one of which is already in play: the extension of the ‘bright line’ test for taxation of capital gains came into effect at the end of March. Later this year a ban on foreign purchases of residential property will come into force, and the Government has signalled that the use of negative gearing by property investors will start to be phased out from next year.
Together, we think that these policies will have a significant impact on housing demand over the coming years. We expect annual house price growth to slow to zero by the end of this year, in contrast to the RBNZ’s assumption of low but positive house price growth. The April house price and sales figures already showed some signs of softening, and we expect that the accumulated evidence over the next six months will satisfy the RBNZ’s concerns.
We should note that we don’t expect the LVR restrictions to be removed altogether. The RBNZ, under successive Governors, has made it clear that lending restrictions are likely to be part of the landscape. Instead, the RBNZ will look to move from the current ‘tight’ settings to something closer to neutral. ‘Neutral’ in this instance is hard to define, but it implies a set of lending restrictions that are not particularly binding at the time, but would guard against a future loosening of bank lending standards.
The consequences of the LVR restrictions extend beyond the stability of the financial sector. Housing makes up a significant part of household wealth in New Zealand, and consumer spending tends to wax and wane in line with house price inflation. The cooling in the housing market over the last year and a half has also seen a slowdown in the rate of growth in consumer spending, and we expect both house prices and spending to remain subdued in coming years.
The latest business confidence survey suggests that retailers are already feeling the pinch. Confidence has been weak since last year’s election, and has taken another step lower in the last two months, with retailers feeling particularly downbeat in May. And as we’ve noted previously, card spending and car sales were markedly weaker in April.
House price inflation also has a bearing on the incentives to build. Confidence in the construction sector has been particularly weak in recent months, although it picked up a little in the May survey. There is clearly a need for an extended period of strong homebuilding activity, and the Government’s KiwiBuild programme provides an additional source of demand for affordable homes. But skill shortages, thin profit margins, rising costs and difficulties in accessing finance present significant constraints on growth.
That said, the latest data suggests that the homebuilding industry has made some progress. Building consents held up surprisingly well in April, down by just 3.7% after a 13% rise in March. Consents for multiples (apartments and townhouses) in Auckland have been particularly strong in the last two months.
Multiple consents are lumpy by nature, and two months of gains are not enough to establish whether the trend has changed. Nevertheless, the recent numbers are impressive given that the aforementioned constraints would seem to be most pressing for large developments in Auckland. For now, we’re sticking with our forecast that actual building work will pick up only gradually this year (March quarter figures are released next week; we expect a 0.5% rise).
Data Previews
Aus Apr retail trade
- Jun 4, Last: flat, WBC f/c: 0.2%
- Mkt f/c: 0.3%, Range: -0.1% to 0.7%
After a positive start to 2018 retailers have struggled again in recent months with sales stalling flat in March and the wash-up from Q1 showing more of the gains have been due to firmer prices with volume growth disappointing, especially for non food retail.
The softer tone is set to carry into April judging by weak retail responses to private sector business surveys. We expect sales to post an insipid 0.2% gain in the month, likely taking trend growth to a sub-2% annual pace.
Note that the wider consumer spending estimates to be published in the March quarter national accounts will be firmer than recent retail reads. Business surveys show much stronger conditions in other consumer related sectors (i.e. services) and consumer sentiment has held in slight positive territory. However, exactly how much of the weakness in retail is a sector specific issue remains an open question.
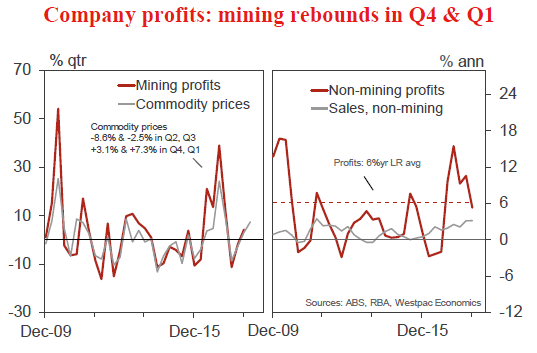
Aus Q1 company profits
- Jun 4, Last: 2.2%, WBC f/c: 3.0%
- Mkt f/c: 3.0%, Range: 1.5% to 4.0%
Commodity price fluctuations remain a key profit driver, a dynamic evident over late 2017 and early in 2018.
In Q4 company profits grew by 2.2%, including a 4.2% increase for the mining sector on higher commodity prices and a 1.2% increase in profits across the broader economy.
For Q1, we anticipate a 3% rise in profits.
Mining profits likely posted a strong gain, up a forecast 8%, on higher prices and a lift in export shipments.
Non-mining profits are expected to continue their uptrend, +0.5%, on increased turnover, as well as positive spill-over effects from the mining sector.
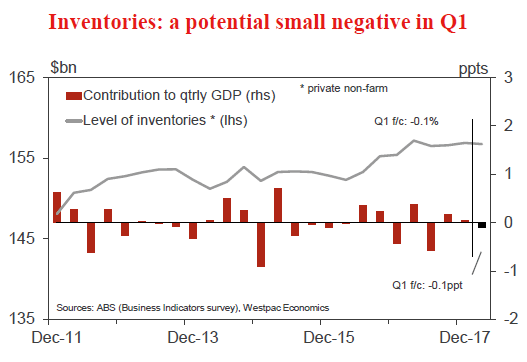
Aus Q1 inventories
- Jun 4, Last: 0.2%, WBC f/c: -0.1% (-0.1ppts)
- Mkt f/c: 0.0%, Range: -1.0% to 0.5%
Inventories, after a period of rebuilding in 2016, increased only modestly in 2017, up 0.5% (on an ex mining basis).
In Q4, total inventories expanded by 0.2%, driven entirely by a jump in mining, while ex-mining declined by 0.2%.
For Q1, we expect total inventories to edge lower, declining by 0.1% centred on a reversal in the mining sector. This would see inventories subtract 0.1ppts from activity in Q1.
Recently, mining inventories have tended to alternate between a period of unintended build-up, due to temporary delays, (as in Q4) and a period of draw-down, to meet export shipments, (as in Q1).
Non-mining inventories are expected to increase gradually to meet rising demand, up a forecast 0.2%qtr.
As always with inventories, we note the elevated uncertainty.
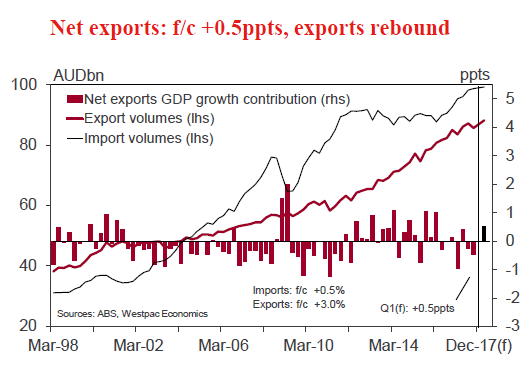
Aus Q1 net exports, ppts cont’n
- Jun 5, Last: -0.5, WBC f/c: +0.5
- Mkt f/c: 0.5, Range: 0.2 to 0.7
Net exports, as with inventories, have been volatile of late largely due to a choppy export profile as supply disruptions impact shipments (notably for coal).
In Q4, export shipments recorded a surprise decline, at odds with the current uptrend, declining by 1.8%. This, along with a 0.5% rise in imports, saw net exports subtract a hefty 0.5ppts from activity in the period.
A reversal is evident in Q1, with net exports forecast to add 0.5ppts to activity.
Exports advanced in Q1, increasing by a forecast 3%qtr, 5.6%yr, with a strong lift in resources (across coal, LNG, gold, as well as metals and iron ore) and gains in manufactured goods and services.
Imports are forecast to rise by around 0.5%, 4%yr in Q1, with a rebound in both capital goods and gold.
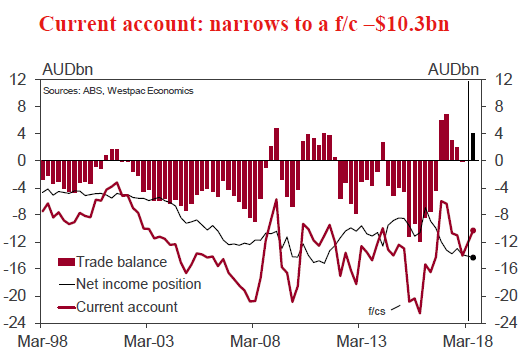
Aus Q1 current account, AUDbn
- Jun 5, Last: -14.0, WBC f/c: -10.3
- Mkt f/c: -9.9, Range: -12.7 to -7.4
Australia’s current account deficit widened in the December quarter, to $14.0bn from $11.0bn. This was largely as the trade surplus evaporated (from +$2.0bn to -$0.1bn).
In the March quarter, the current account position improved, fully reversing the Q1 deterioration, with the deficit narrowing to a forecast $10.3bn.
The trade position returned to surplus in Q1, to the tune of $4.0bn, a turnaround from a revised deficit of $1.0bn for Q4.
Export earnings rose by around 7½%, boosted by higher commodity prices. The import bill grew by a more modest 2%, including a lift in prices. The terms of trade lifted by an estimated 2.6%, after a 1% decline in Q4.
The net income deficit is expected to widen a little, to $14.3bn from $13.9bn, on rising returns to foreign investors.
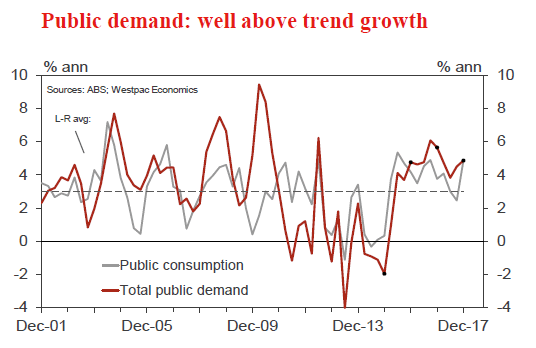
Aus Q1 public demand
- Jun 5, Last: 1.1%, WBC f/c: 1.0%
Public demand is a key growth driver, expanding at a well above trend pace in 2015, 2016 and 2017, with annual growth at 4.8%, 5.6% and 4.9%, respectively. Momentum is set to extend in to 2018 and beyond.
An upswing in public investment is underway, lifting from recent lows, as governments commit to additional projects (particularly transport infrastructure) now that earlier fiscal pressures have receded. In addition, spending on health is increasing at a robust pace, including on the NDIS.
In Q4, public demand increased by 1.1%, led by a sharp rise in consumption (which accounts for 80% of total public demand), up 1.7%, only partially offset by a modest pullback in the often volatile investment segment, -1.3%.
For Q1, we expect public demand to expand by 1.0% on higher investment, +3%, as well as a modest gain in consumption, +0.5%.
Aus Jun RBA decision
- Jun 5, Last: 1.50% WBC f/c: 1.50%
- Mkt f/c: 1.50%, Range: 1.50% to 1.50%
The RBA will hold rates unchanged at their June meeting, as they have since they last cut rates in August 2016.
The Governor has stated that: “further progress in reducing unemployment and having inflation return to target is expected, although this progress is likely to be gradual”.
The case for patience has been reinforced by recent labour market updates, with unemployment stuck around 5.5%, and wages, which remain sluggish thereby constraining consumer spending.
Moreover, tighter lending standards have been helpful in containing the build-up of risk in household balance sheets. This has seen a cooling of the housing sector, which is a headwind for the economy.
We continue to expect the RBA to leave the cash rate unchanged at 1.50% throughout 2018 and 2019.
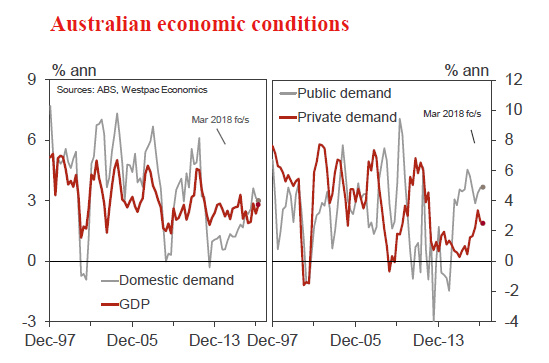
Aus Q1 GDP
- Jun 6, Last: 0.4%qtr, 2.4%yr; WBC f/c: 0.9%qtr, 2.8%yr
- Mkt f/c: 0.8%, Range: 0.2% to 1.2%
Real GDP grew by a forecast 0.9%qtr, 2.8%yr in Q1, an improvement on a Q4 result of 0.4%qtr, 2.4%yr.
The key swing factor is net exports, which add a forecast 0.5ppts, a turnaround from a -0.5ppts impact. Exports resumed their uptrend, f/c +3%, after a temporary dip, -1.8%.
Domestic demand grew by a forecast 0.6%, matching the Q4 result, while inventories are expected to subtract 0.1ppts from activity in Q1.
Consumer spend likely slowed (0.6% after a 1.0%) on a softer wage income result. More supportive are home building (+1.0% after a -1.3%) and business investment (+0.5% following a -1.0%). Public demand growth most likely remained above trend, at a forecast 1.0%, with investment in an upswing and health spending on the rise.
See our preview bulletin for further details.
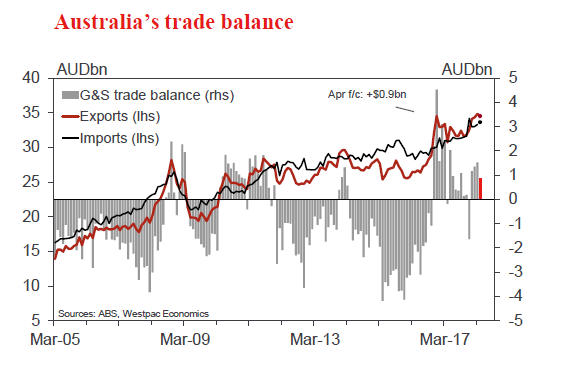
Aus Apr trade balance, AUDbn
- Jun 7, Last: 1.5, WBC f/c: 0.9
- Mkt f/c: 1.0, Range: 0.4 to 1.8
Australia’s trade account was in surplus in the opening quarter of 2018, supported by a lift in commodity prices and rising export shipments.
For April, we anticipate another trade surplus, albeit narrowing from $1.5bn to $0.9bn.
The import bill is expected to increase by 1%, +$0.3bn, on higher prices (notably for oil) and a lift in volumes.
Export earnings are expected to moderate in the month, down a forecast 0.9%, -$0.3bn. LNG is a likely plus, on higher prices and volumes, but we expect this to be more than offset by falls across coal (price and volumes), iron ore (prices), as well as gold and rural (coming off a high base).
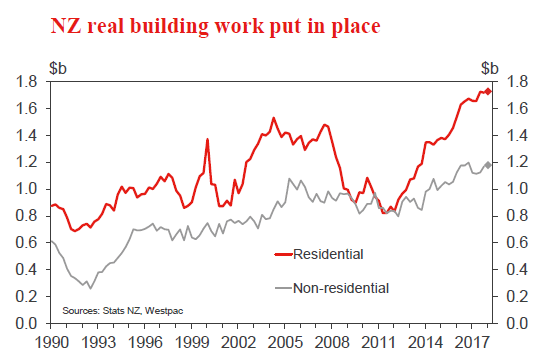
NZ Q1 building work put in place
- Jun 6, Last: +1.4%, Westpac f/c: +0.5%
Construction activity continued to trend higher in late 2017, with gains in both residential and non-residential building activity. Looking forward, we expect that the level of activity will remain elevated for an extended period, with a large amount of residential and infrastructure work planned over the coming years. However, after an extended period of strong activity, capacity in the building sector has become stretched. In addition, difficulties accessing finance and nervousness about policies that will dampen house price growth are providing a brake on building activity. As a result, we expect only a 0.5% rise in construction through the March quarter, with only modest gains in both residential and non-residential work expected.