
Week beginning 3 September 2018
- Q2 GDP, preview: overall activity conditions robust, but wages remain weak.
- RBA: policy decision, Governor Lowe speaks at RBA Board Dinner.
- Australia: Q2 GDP and Q2 partials, current account, trade balance, retail sales, CoreLogic home prices, housing finance.
- NZ: terms of trade, building work.
- China: Caixin PMI’s, foreign reserves.
- Europe: GDP 3rd estimate.
- US: nonfarm payrolls, NY Fed President Williams speaks, ISM’s, Labor Day.
- Central banks: BoC and BNM policy decisions.
- Key economic & financial forecasts.
Information contained in this report current as at 31 August 2018.
Q2 GDP Preview: Overall Activity Conditions Robust, But Wages Remain Weak
Reserve Bank in focus
The Reserve Bank Board meets this Tuesday and is certain to leave rates on hold at 1.50%. Rates have been unchanged since a 25bps cut in August 2016, with the most recent hike in November 2010.
The decision statement by RBA Governor Lowe is likely to be little changed from that in August. The key line in the closing paragraph will be repeated, namely: “Further progress in reducing unemployment and having inflation return to target is expected, although this progress is likely to be gradual”.
As we have highlighted previously, despite this stability in the RBA cash rate, lending conditions in the housing market have tightened. The authorities have actively used macro-prudential measures, largely focused on investors, while short-term rates have moved higher, evidence of increased funding costs. New lending for housing is declining and established property prices are easing, modestly to date, following strong gains – developments which will likely weigh on the economic outlook.
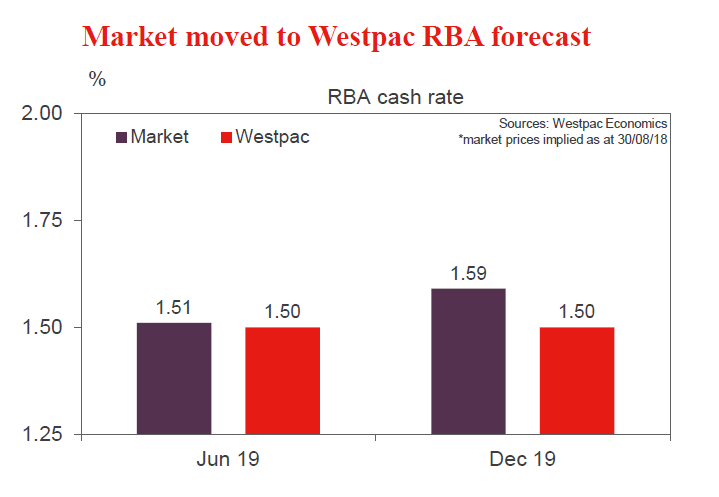
Westpac Economics continues to expect the RBA cash rate to remain on hold throughout 2018 and 2019, as well as in 2020, as set out in the recent update by Chief Economist Bill Evans.
On Tuesday evening, the Governor will speak at the dinner of the Reserve Bank Board. His remarks are likely to be both reflective and broad ranging as they were at corresponding events in other capital cities. Dr Lowe is of the view that: “the next move in the cash rate would more likely be an increase than a decrease”, a line he may well repeat. The Governor will reflect on key challenges and uncertainties, notably, around the consumer, weak wages, high household debt and housing.
This is also an opportunity for the Governor to emphasise current positives: economic growth over the past year was above trend, at 3.1%; inflation is in the target band, at 2.1%; and unemployment has declined to a six year low, 5.3%.
The most significant achievement of the Australian economy over recent years is the successful rotation through the growth drivers, from the mining investment boom, to a strong upswing in home building, and now to strength in construction activity across the rest of the economy. We are investing in our cities to meet the needs of a rapidly growing population, particularly in Melbourne and Sydney. Notably, we are investing in: much needed transport infrastructure; energy, with a focus on renewables; and offices (with vacancy rates at a decade low), as well as hotels and student accommodation, in response to strong demand from international visitors and foreign students.
We would emphasise the divergence in output trends from that of incomes. National income growth has generally been sub-par since late 2011, when the terms of trade and commodity prices for some of our exports were at their peak, at the height of the mining boom. Importantly, wages growth is weak, constraining consumers, and is likely to remain so given arguably still considerable slack in the labour market.
Q2 National Accounts
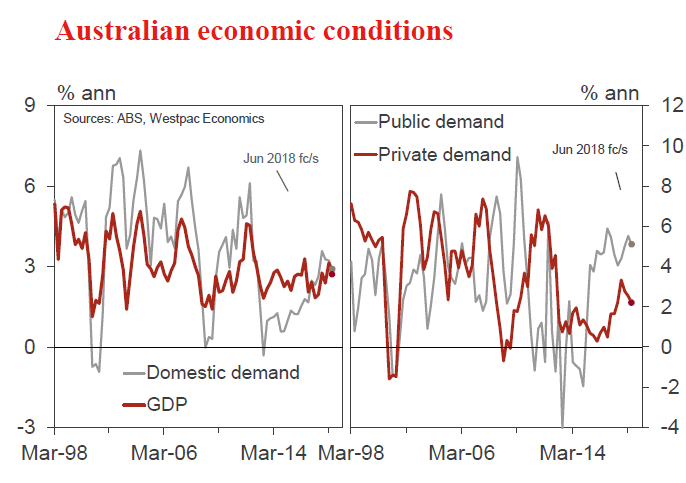
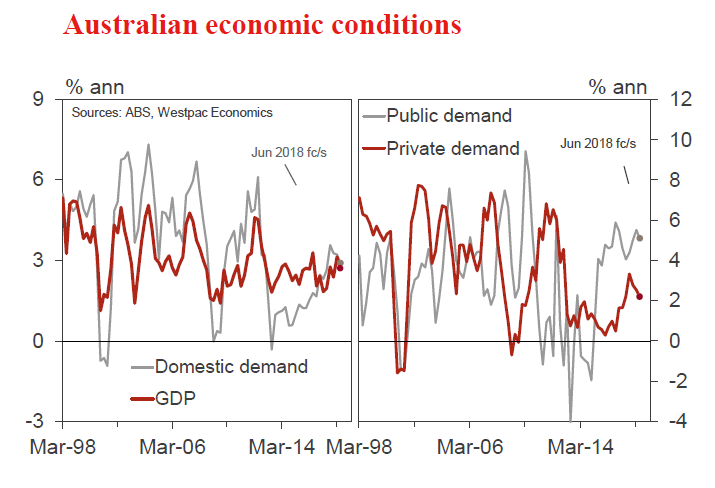
On Wednesday, the National Accounts will provide an estimate of economic activity for the period April to June. For the June quarter, we expect output growth of 0.6%, trimming annual growth to 2.7%, a trend pace.
By way of context, the March quarter was a strong one, with a 1.0% quarter and annual growth of 3.1%. The quarterly result included a sizeable positive contribution from inventories and net exports, with a combined impact of 0.5ppts. A repeat of this appears unlikely, which suggests that overall output growth in Q2 will fall short of the 1% mark. The annual result to March of 3.1% benefited from a hiring burst in 2017. Jobs growth was an unsustainably brisk 3.4% in 2017, in part a catch-up after a hiring pause around the July 2016 Federal election. In 2018, jobs growth has throttled back, to be running at a still robust 1.7% annualised pace for the year to date.
The arithmetic of Q1 GDP was: domestic demand, 0.6%; inventories, +0.2ppts; net exports, +0.3ppts; and statistical discrepancy, -0.1ppt (i.e. the expenditure estimate of GDP was a little stronger than the income and production measures).
For our Q2 GDP forecast of 0.6%, the arithmetic is: domestic demand, 0.6%; inventories, -0.2ppts; and net exports, +0.1ppt. Domestic demand is likely to show gains across the consumer, home building and public demand, but be constrained by flat business investment – as discussed in more detail below.
Labour market developments were mixed in the June quarter, adding to uncertainty around wage incomes and GDP. Hours worked increased by a brisk 1.0%, to be 2.8% above the level of a year ago, while employment (on a mid-month of quarter basis) grew by only 0.2%, to be 2.7% higher over the year.
On the consumer, accounting for 57% of domestic demand, the national accounts provide us with a detailed update on spending, saving and incomes. As noted above, a key ongoing headwind is weakness in wages growth, in part due to compositional shifts in the labour market, at a time of high debt levels. More recently, property prices have eased and jobs growth has moderated, while the household savings rate has declined to relatively low levels. In this environment, consumer spending lifting to an above trend pace appears unlikely.
On national income, the June quarter was a less favourable one, with the terms of trade declining by an estimated 1.3% in the period, albeit still leaving it some 2% above the level of a year ago. For nominal GDP, we expect a Q2 outcome of 0.8%qtr, 4.6%yr, a sub-par annual pace.
The Business Indicators survey, on Monday, will provide some partial information on official estimates of incomes for the quarter, including an update on wage incomes and profits, key inputs into our GDP(I) view. The mixed labour market signals for the quarter add to uncertainty around wage incomes for the period.
Q2 GDP, detail
Household consumption (0.7%qtr, 2.7%yr): Consumer spending remains choppy, with a modest start to 2018, +0.3% in Q1, following a strong end to 2017, +1.0% in Q4. Annual growth is 2.9% currently, which is a little below par. Spending on a per capita basis is less impressive and is arguably lacklustre. For the June quarter, we expect a solid 0.7% increase, centred on a burst of retail spending, +1.2%. Car sales appear to have eased in the quarter and spending on services has been mixed of late.
Dwelling investment (+1.6%qtr): Home building activity added to growth over the first half of 2018, in contrast to the 5% decline for 2017. This profile for activity is consistent with that of dwelling approvals. Going forward, approvals are expected to moderate from current record highs, to bring them more into line with underlying requirements.
New business investment (flat qtr, 2.7%yr): Investment turned the corner in 2017, after four years of decline, with a diminished drag from mining and an uptrend in non-mining investment. Over the first half of 2018, investment consolidated, with a flat Q1 result and a likely flat Q2 result. Mining capex fell as work on the remaining gas projects under construction is now largely complete. Non-residential building rose, so too spending on computer software and systems, while equipment spending dipped.
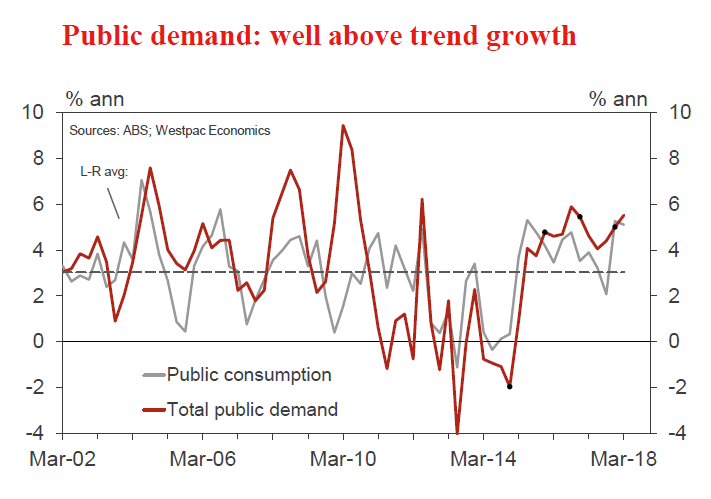
Public spending (1.0%qtr, 5%yr): Government spending, in the form of public demand, is expanding at a brisk 5% annual pace. Public demand directly added 1.3ppts to activity over the past year, with additional significant positive spill-over effects. This dynamic is key to what are currently relatively robust conditions for the economy as a whole. We expect a further 1% increase in public demand in the June quarter.
Public investment is expected to increase by around 2.5%qtr, 9.4%yr in Q2, with a focus on transport infrastructure, as well as investment across social infrastructure. Public consumption (including spending on health and education) is also increasing at a well above trend pace, with a Q2 forecast of 0.6%qtr, 4.2%yr.
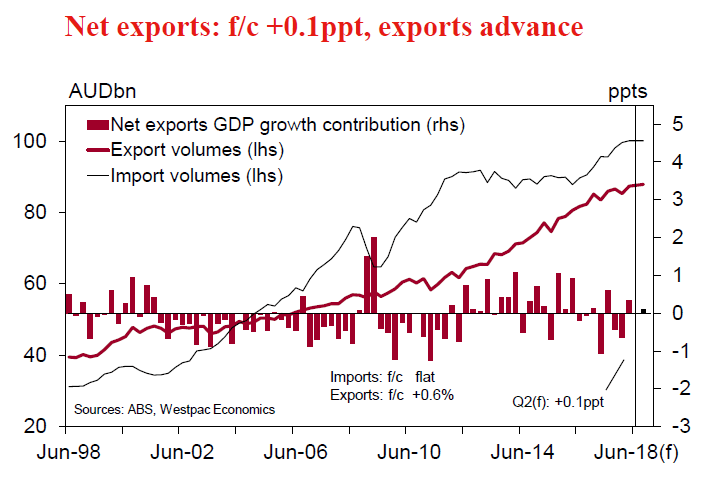
Net exports (+0.1ppt, -0.6ppts yr): Net exports are expected to be a positive, albeit making a smaller contribution than in Q1, at a forecast 0.1ppt. Export volumes advanced by an estimated 0.6%, including gains across services, rural goods and resources, partially offset by a dip in manufactured items. By contrast, exports rebounded in Q1, after a weak end to 2017. Imports were broadly flat in Q2, we estimate, with weaker services (associated with rising prices) offsetting a rise in goods.
Private non-farm inventories (+0.3%, -0.2ppts contribution): For the June quarter, we anticipate a two-fold correction: (1) for wholesale and retail, a draw-down of inventories after the sharp run-up; and (2) across the rest of the economy, a return to a more typical inventory increase in response to growing demand. On balance, we expect inventories to increase by 0.3%, implying a slight drag on growth in the quarter, of around -0.1ppt (potentially rounding to -0.2ppts).
Outlook
Turning the focus to the outlook, in particular to 2019, the RBA and Westpac views diverge.
The RBA is expecting growth of 3.25%, including consumer spending at around 3%, an environment which would likely see the unemployment rate move lower.
Westpac Economics is instead forecasting GDP growth to slip to a below trend pace of 2.5%. Current challenges and uncertainties are likely to persist in our view, notably weak wages growth, with consumer spending expected to slow to 2.5%.
Home building activity, rising over the first half of 2018, is likely to moderate during 2019, down from historic highs. At the same time, house prices are likely to remain under pressure given tighter lending standards. Uncertainty ahead of the upcoming Federal election, due by May 2019, is another risk. In addition, the global backdrop is expected to be less favourable, as world growth moderates and with commodity prices forecast to ease from current elevated levels.
The week that was
This week, investment has been in the spotlight for Australia ahead of next Wednesday’s June quarter GDP report.
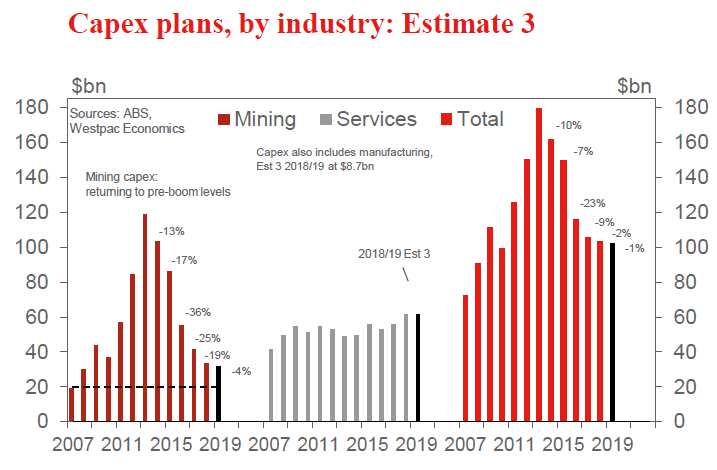
Following on from last week’s construction work done release (which focused on non-residential construction), the release of this week was the CAPEX survey. Importantly, the CAPEX survey not only provides guidance on equipment investment for the current quarter ahead of GDP but also investment intentions for the mining, manufacturing and services industry for the 2018/19 financial year – across both equipment and construction activity.
On the current quarter, this release was disappointing. While a 1.0% rise in equipment spending was expected, a 0.9% fall was instead reported. For June quarter GDP, this result offset upside risks we had seen to our 0.6% GDP forecast for the June quarter (see our Australia & NZ Weekly later today for a full preview). Taking a longer-term view however, it should be emphasised that the disappointing June quarter outcome follows strength over the past 12 months. The trend therefore remains positive. By industry, in the June quarter, total capital expenditure (for equipment and construction) fell 7% for mining; pulled back 0.9% in the service sector – after 18 months of gains; but rose 2.8% in manufacturing.
Looking ahead, estimate 3 for 2018/19 CAPEX expectations was a broadly neutral outcome, being consistent with a 1% decline on the comparable estimate for the 2017/18 financial year. That said, the industry detail was on the soft side, with the allimportant service sector expectation now flat (previously +5%) and the projected gain for manufacturing having halved, from +6% three months ago to +3% currently. Mining was a partial offset however, now -4% versus -6% three months ago. If we are to see above-trend growth in Australia, we must see an improvement in non-mining business investment. The problem is that this is will prove difficult if growth in consumer spending remains subdued.
The other key outcome for Australia this week was dwelling approvals. July was another volatile read, with total approvals down 5% as high-rise approvals plunged 20%. Volatility on this scale is typical of approvals, making short-term assessments of momentum difficult. As such, while the high-rise outcome is in keeping with our expectation of a further move lower in construction activity in this sub-sector, it will take time to confirm the trend. Lending standards have been materially tightened by regulators, and this looks set to remain a material headwind for the sector through this year and next, particularly in Sydney and Melbourne.
Turning then to the US, it has been a quiet week for data, with July personal income and spending the highlight. In that report, we saw no real surprises, as income and spending remained robust in the first month of the September quarter, rising 0.3% and 0.4% respectively. For spending however, it is important to highlight two things: higher interest rates are weighing on durables spending; and secondly, while robust, the pace of spending growth in the second half of 2018 will be materially below that of the June quarter, which benefitted from delayed activity from a weather-affected March quarter.
Taking a longer-term view, we expect tighter financial conditions to progressively weigh on the US economy over the coming year. FOMC Chair Powell highlighted at the Jackson Hole Symposium last weekend that the Committee are intent on at least taking policy back to a neutral setting, albeit while being mindful not to overreact to or pre-empt inflation. If we are correct in our belief that neutral equates to a fed funds rate of around 2.5%, then the three hikes to March 2019 we are forecasting will take policy there (a mid-point of 2.625%), and that of June 2019 beyond that benchmark. Along with the end of fiscal stimulus in September 2019, financial conditions will slow US growth back to trend (1.7%) from nearer 3% to March 2019. Given trade tensions, it will also be important to continue assessing the US’ investment pulse as we move into and then through 2019.
On trade tensions, preliminary agreement between the US and Mexico to replace or amend NAFTA (depending on if Canada joins negotiations or not) gave support to financial markets this week. However, overnight there has been reports that President Trump will push ahead with the next wave of tariffs on China as early as next week after the consultation process ends. This round of tariffs (10% to 25% on $200bn of imports from China) would dwarf prior actions, and also see China retaliate with new tariffs on $60bn of imports from the US. We continue to emphasise that the initial trade shock of these tariffs on both nations is unlikely to be material. Our focus is instead on the potential impact on investment from 2019 on. The rise of protectionism has the potential to hold businesses back from investing in new capacity not only in the US and China, but also across the world given we live in the era of globally integrated production.
Chart of the week: capex plans
2018/19 capex plans Estimate 3 printed at $102bn, which is -1% vs Est 3 a year ago. The $102bn figure is a relatively neutral update (in terms of the headline figure), broadly in line with Estimate 2, $88bn.
Using calculations based on average realisation ratios (RRs), we estimated that Est 3 implies capex spending in 2018/19 will be 2.7% lower than in 2017/18. This is in line with the -2.3% implied by Est 2, hence our interpretation of a relatively neutral headline. By industry, we estimate: mining -12% (vs -19% 3 months ago); services +1% (vs +6%) and manufacturing -1% (vs +0.5%).
In terms of key themes, mining investment will move lower in 2018/19, while non-mining investment is in an uptrend.
New Zealand: week ahead & data wrap
Elephant in the room
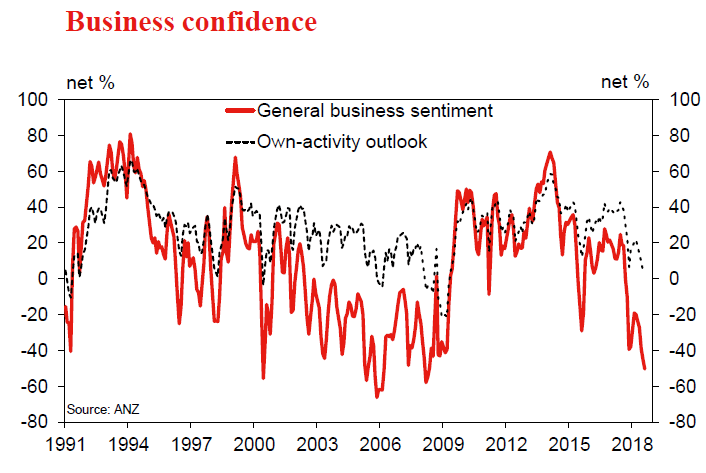
Business confidence has fallen sharply in recent months, despite an economy that appears to be mixed rather than catastrophic. We suspect that some of this reflects firms’ concerns about the planned changes to industrial relations policies, and the Government has started to move towards addressing those concerns.
The ANZ Business Outlook survey for August saw general business sentiment fall further to a net -50, setting a fresh tenyear low. Firms’ own-activity expectations, which correspond more closely with GDP growth, were unchanged for the month. But they remain at their lowest level since 2009, when the economy was just starting to pull out of the Global Financial Crisis.
There is an open question as to how to interpret business confidence surveys. On the one hand, they can provide timely warnings of a genuine downturn (or an upturn) in the economy. On the other hand, respondents are not obliged to give an unbiased assessment. As we’ve noted before, the ANZ survey is particular tends to be biased downwards under Labour-led governments, after accounting for economic conditions at the time. However, even if opinion surveys are politically slanted, there is still cause for concern if firms act on those views by cutting back on investment and hiring.
Economic growth has clearly slowed from its 2016 peak, as some of the previous drivers of growth – population growth, earthquake reconstruction, and rising house values – have faded. But the weight of evidence points to a shift to more modest growth rather than the recessionary levels that the business confidence survey implies.
Indeed, the next GDP report is likely to be quite upbeat – we expect a 1% rise for the June quarter. Some of that simply reflects the volatility of quarterly data, but there have been some genuine signs of improvement as well. And looking a bit further ahead, we expect increased government spending and transfers to give the economy a temporary fillip over the coming year. We are forecasting 3.1% growth over 2019, up from 2.9% in 2018.
So what is driving this steep fall in business confidence? We see parallels with mid-2000, dubbed the “winter of discontent”. Then, a newly minted Labour-led Government was attempting to pass the Employment Relations Act, which among other things, placed a greater emphasis on collective bargaining between employers and unions. Business confidence was little changed in the first few months of the new Government, but then plunged in May. The legislation was passed in August, and by November confidence had recovered to its previous level.
The current Labour-led Government is also aiming to shift the bargaining power further towards workers (though the changes will not be as substantial as the 2000 legislation, which largely remains in place today). The planned changes include increasing unions’ access to workplaces, “fair pay” agreements in some industries, and multi-employer collective agreements. Not surprisingly, these changes are not proving popular with employers or business organisations.
The speech by Prime Minister Ardern this week came closer to acknowledging this issue as a source of the negativity expressed in business confidence surveys. Part of the problem is that the ongoing work to develop these policies has left something of an information vacuum as to how they will work.
In an attempt to soften these concerns, the Prime Minister has committed to no more than one or two industry-level fair pay agreements within the Government’s current three-year term. She also reaffirmed that the legislation will not allow for strike action by workers as part of fair-pay negotiations.
That still leaves unresolved the framework for these agreements, including the extent of political involvement. In Australia this is handled by the Fair Work Commission (FWC), an independent tribunal that handles a range of industrial relations functions. The FWC determines industry ‘awards’, which in most cases are effectively a hierarchy of minimum wage rates by job level. It also sets the national minimum wage each year – a decision that is made by the central government in New Zealand (and has already been more or less decided for the next three years, as part of the Government’s coalition agreement).
Despite these lingering uncertainties, it will be interesting to see if the Government’s willingness to address concerns about labour relations will lead to an improvement in future confidence surveys. In the meantime, we’ll be watching the near-term data closely for any signs that confidence is having a real impact on activity. Recent indicators of retail spending, job advertisements and capital imports have remained positive, and building consents show a rapidly growing pipeline of homebuilding work in Auckland, where a housing shortage has been most apparent.
Data Previews
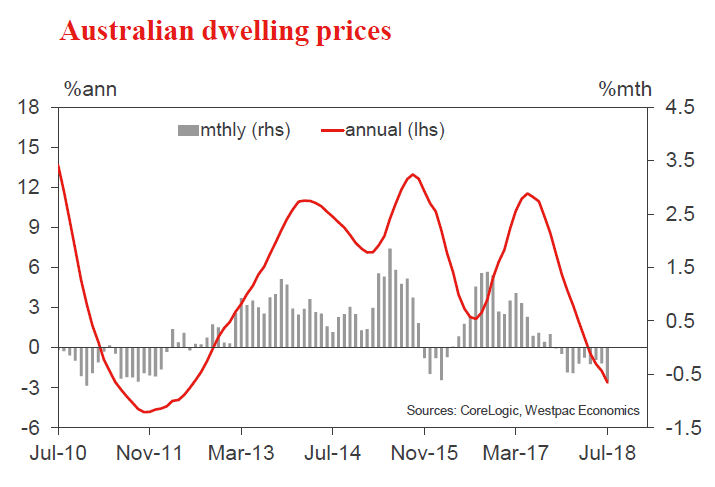
Aus Aug CoreLogic home value index
- Sep 3, Last: -0.6%, WBC f/c: -0.4%
Australia’s housing market continues to correct. The CoreLogic home value index, covering the eight major capital cities, fell 0.6% in July to be down 2.4%yr and 2.8% from its peak in September last year.
The correction continues to be concentrated in the previously strong Sydney and Melbourne markets with Perth’s longer running period of price declines also continuing. All major capital cities except Brisbane recorded price falls in July with notable weakness in Melbourne (-0.9%mth) and Perth (-0.8%mth).
The daily index suggests slippage continued in August, but at a milder pace, prices nationally down about 0.4% taking the annual pace of decline to -3%yr.
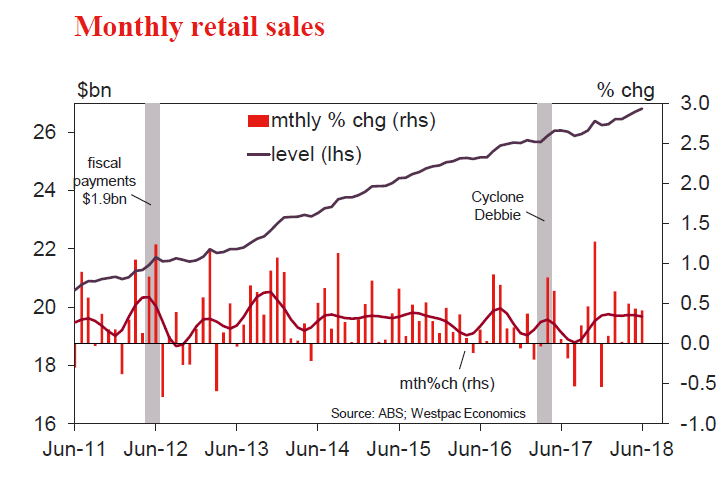
Aus Jul retail trade
- Sep 3, Last: 0.4%, WBC f/c: 0.3%
- Mkt f/c: 0.3%, Range: -0.1% to 0.6%
Retail sales posted a third consecutive 0.4% gain in June, the run of reasonably solid gains following a difficult March quarter that saw nominal sales up just 0.6%qtr. The store-type detail showed reasonably solid gains for most categories in the June month with some give back for department stores more than offset by gains for food; household goods and clothing retail.
Indicators were uneven in July. Consumer sentiment posted a surprise rally to a 5yr high boosted by the government’s tax package passing into legislation. Private business surveys were mixed, retail responses to the NAB survey suggesting conditions dipped back into negative in the month but the AIG PSI suggesting some improvement. On balance, we expect July to show a 0.3% gain. Note that price discounting pressures look to have eased a touch and may ease further with GST changes on July 1 that mean low value imported goods will now be taxed.
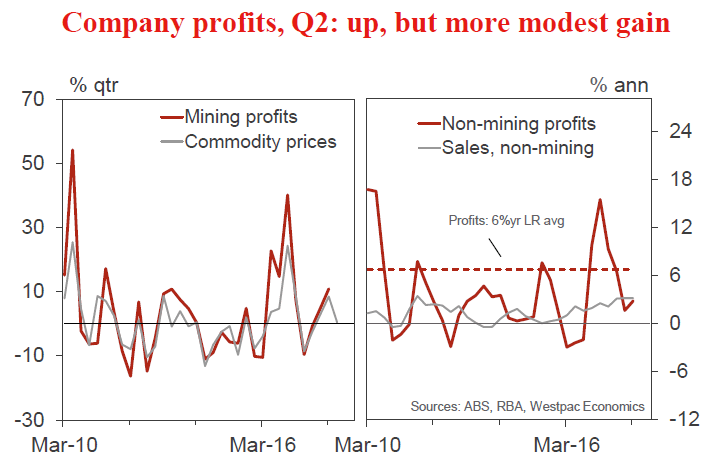
Aus Q2 company profits
- Sep 3, Last: 3.4%, WBC f/c: 1.0%
- Mkt f/c: 1.3%, Range: -1.0% to 3.0%
Companies have been enjoying rising profits as the Australian economy expands at an above trend pace, thereby encouraging firms to boost investment.
In the March quarter, profits jumped by 5.9% to be 48% above the level of two years earlier. Mining profits surged 122% over the two years, on higher commodity prices, and non-mining profits climbed by 25%, the strongest two year performance since the GFC.
The uptrend in profits likely extended into the June quarter, increasing by a forecast 1%, including a 0.5% rise in mining profits and a 1.2% gain in non-mining profits. That would see total profits 10% above the level of a year ago.
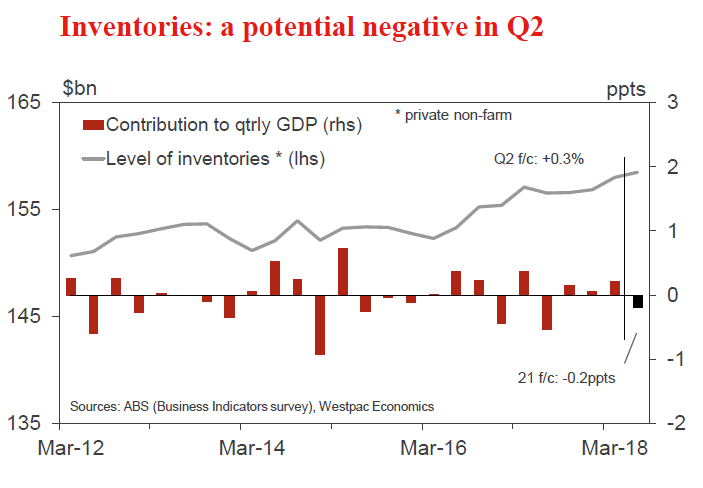
Aus Q2 inventories
- Sep 3, Last: 0.7%, WBC f/c: 0.3% (-0.1ppt)
- Mkt f/c: 0.2%, Range: -0.2% to 0.9%
Over the past year, inventories increased by a relatively modest 0.6% with a choppy quarterly profile.
The March quarter outcome was an oversized 0.7% increase in total inventories, inflated by a near $1.4bn run-up in inventories for wholesale and retail. Across other sectors, inventories had a soft result, down 0.3% to still be 2.6% above the level of a year ago.
For the June quarter, we anticipate a two-fold correction: (1) for wholesale and retail, a draw-down of inventories after the sharp run-up; and (2) across the rest of the economy, a return to a more typical inventory increase in response to growing demand.
On balance, we expect inventories to increase by 0.3%, implying a slight drag on growth in the quarter, of around -0.1ppt (potentially rounding to -0.2ppts).
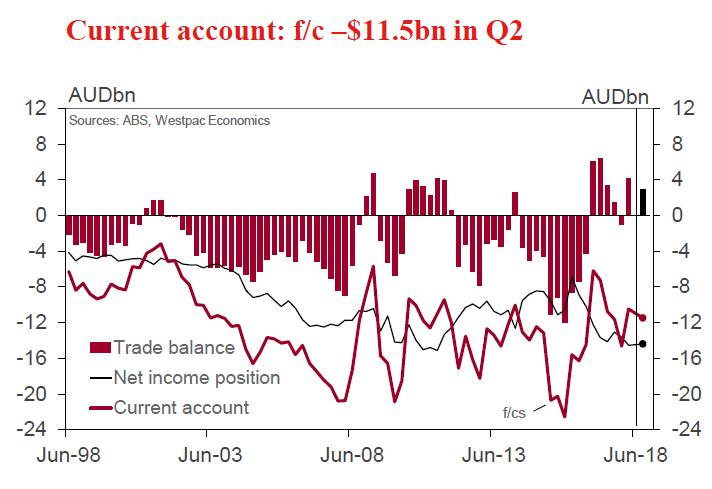
Aus Q2 current account, AUDbn
- Sep 4, Last: -10.5, WBC f/c: -11.5
- Mkt f/c: -11.0, Range: -13.0 to -9.0
Australia’s current account deficit fluctuated over the past year, buffeted by the impact of commodity price volatility on export earnings. The quarterly deficit widened from $11.7bn last September to $14.7bn in December, reversing to $10.5bn in March.
For the June quarter, the deficit is expected to be $11.5bn.
A $2.9bn trade surplus was recorded in Q2, down from $4.1bn in Q1 (subsequently revised lower to $3.35bn). Export earnings rose by 2%, eclipsed by a 2½% increase in the import bill, boosted by higher energy prices. Notably, the terms of trade declined by an estimated 1¼%.
The net income deficit is expected to consolidate at $14.4bn, after widening by $1bn to $14.6bn in Q1. Over the past couple of years, the income deficit has increased on rising returns to foreign investors in the mining sector.
Aus Q2 net exports, ppts cont’n
- Sep 4, Last: +0.3, WBC f/c: 0.1
- Mkt f/c: 0.1, Range: 0.0 to 0.3
Net exports have been volatile of late largely because of a choppy export profile, in part reflecting supply disruptions to shipments (notably for coal).
In the March quarter, net exports added 0.35ppts to activity as export volumes rebounded, up 2.4%, following a soft end to 2017, down 1.5% in Q4.
For the June quarter, net exports are expected to be a positive, albeit making a smaller contribution than in Q1, at a forecast 0.1ppt.
Export volumes advanced by an estimated 0.6%, including gains across services, rural goods and resources, partially offset by a dip in manufactured items.
Imports were broadly flat, we estimate, with weaker services (associated with rising prices) offsetting a rise in goods.
Aus Q2 public demand
- Sep 4, Last: 1.5%, WBC f/c: 1.0%
The public sector – directly accounting for almost a quarter of the economy – is a key growth driver, expanding at a well above trend pace in 2015, 2016 and 2017, with annual growth at 4.8%, 5.5% and 5.0%, respectively. This brisk momentum has extended into 2018.
Public investment is trending sharply higher, off low levels, with a focus on long overdue transport projects. Health spending (included in ‘consumption’) is also moving higher.
Total public demand grew by 1.5%qtr, 5.5%yr in Q1, with investment 7.4% higher over the year and consumption 5.1% up on a year earlier.
For the June quarter, we anticipate a robust 1.0% rise in public demand, including a further 2.5% increase in investment spending.
Aus RBA policy decision
- Sep 4, Last: 1.50%, WBC f/c: 1.50%
- Mkt f/c: 1.50%, Range: 1.50% to 1.50%
The RBA will hold rates unchanged at their September meeting, as they have since they last cut rates in August 2016. The Governor’s decision statement will repeat the line that: “further progress in reducing unemployment and having inflation return to target is expected, although this progress is likely to be gradual”.
Economic growth over the past year was above trend, at 3.1%; inflation is in the target band, at 2.1%; and unemployment has declined to a six year low, 5.3%.
However, uncertainties and challenges remain, notably around the consumer, weak wages growth, high household debt levels and housing, as prices ease a little following strong gains and as lending conditions tighten.
We expect the RBA cash rate to remain unchanged at 1.50% throughout 2018 and 2019, and now as well during 2020.
Aus Q2 GDP
- Sep 5, Last: 1.1%qtr, 3.1%yr; WBC f/c: 0.6%qtr, 2.7%yr
- Mkt f/c: 0.7%, Range: 0.5% to 1.0%
The economy expanded by an above trend 3.1% in the year to March 2018, with domestic demand increasing by 3.2% and net exports subtracting 0.2ppts from activity.
The March quarter was a strong outcome, with output up by 1.0%. Half of this growth was accounted for by inventories (0.2ppts) and net exports (0.3ppts).
For the June quarter, we expect GDP of 0.6%qtr, 2.7%yr.
The arithmetic is: domestic demand, 0.6%; inventories, -0.2ppts and net exports, +0.1ppt.
Consumer spending, f/c 0.7%; home building activity, f/c 1.6%; and brisk public demand, f/c 1.0%qtr, 5.0%yr; all likely advanced in the period. Business investment is expected to be flat, dented by a decline in mining capex, but is still up on levels of a year ago.
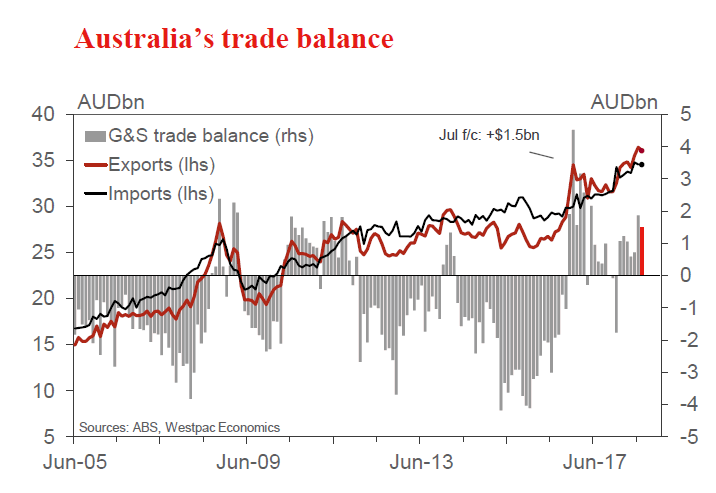
Aus Jul trade balance, AUDbn
- Sep 6, Last: 1.9, WBC f/c: 1.5
- Mkt f/c: 1.5, Range: 0.9 to 1.9
Australia’s trade account has been in surplus each month so far in 2018.
In June, the surplus jumped by a little in excess of $1.1bn to $1.9bn. Export earnings increased by 2.6%, with relatively broad based gains.
For July, we expect a modest reversal, with the surplus narrowing to a forecast $1.5bn.
Export earnings are expected to edge 1% lower. Weaker iron ore shipments in the month outweigh increased volumes for coal and LNG.
The import bill is expected to be broadly unchanged. The currency was mixed in the month (down 1.2% against the US dollar but up 0.6% on a TWI basis), suggesting no material impact on import prices.
Aus Jul housing finance (no.)
- Sep 7, Last: -1.1%, WBC f/c: -0.5%
- Mkt f/c: -0.1%, Range: -1.5% to 1.0%
Australian housing finance approvals softened notably in June, with the number of owner occupier loans declining 1.1% vs and the value of investor loans down 2.7%. The decline is consistent with other market indicators showing a material slowdown in activity through May-July.
Industry data covering the major banks suggests July was more settled. However, other indicators tracking wider mortgage activity suggest flows continued to soften in the month. Overall we expect owner occupier finance approvals to be down 0.5%. The value of investor loans will again be of interest given the wider market has continued to slow materially through July-Aug.
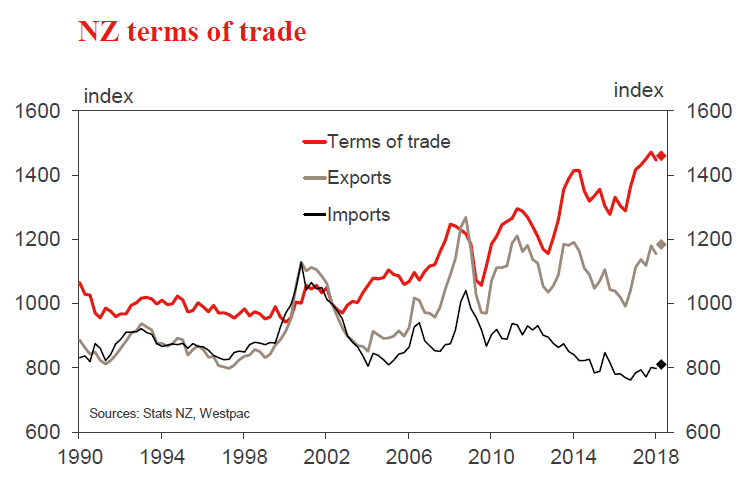
NZ Q2 terms of trade
- Sep 3, Last: -1.9%, WBC f/c: +1.0%, Mkt f/c: +1.0%
We estimate that New Zealand’s terms of trade improved by 1% in the June quarter. This would leave the index just shy of the all-time high that was reached at the end of 2017.
Export commodity prices rose across the board in the June quarter, largely reversing their falls in the March quarter. This volatility appears to have more to do with the timing of export shipments than with changes in world market prices.
There was a further sharp rise in oil import prices over the quarter, but prices for New Zealand’s other imports (mainly manufactured goods) are likely to have remained subdued.
We expect the terms of trade to soften over the second half of this year, given the recent falls in some export prices and the still-high price of oil.
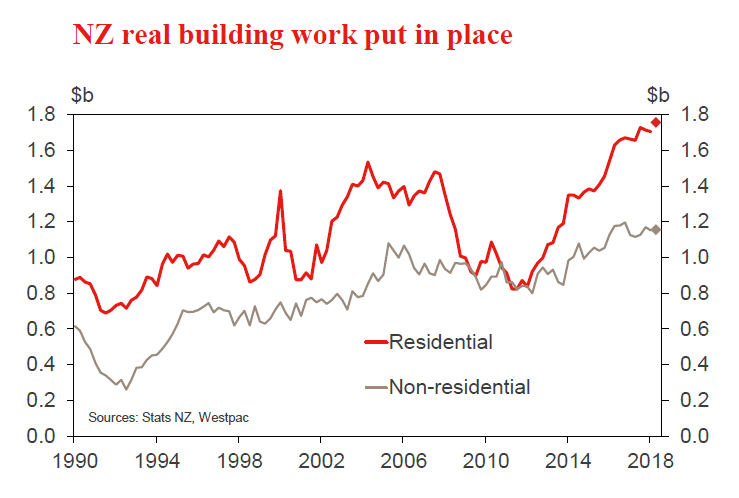
NZ Q2 building work put in place
- Sep 5, Last -0.9%, Westpac f/c: +2.0%, Mkt f/c: +2.0%
Construction activity fell 0.9% in the March quarter. That fall was mainly due to a 1.5% drop in non-residential construction, which followed a solid rise in the previous quarter. Residential building activity also fell modestly, weighed down by the ongoing wind-back in earthquake reconstruction in Canterbury.
We’re expecting a 3% increase in residential building activity in June, along with a modest 0.2% increase in the more volatile non-residential category. Underlying this are signs of a reacceleration in Auckland, with regulatory changes supporting a rise in medium-density home building.
Construction activity is expected to remain elevated for an extended period. However, factors such as stretched capacity, rising costs, and difficulties accessing finance are providing a brake on how quickly building activity can ramp up to meet demand.
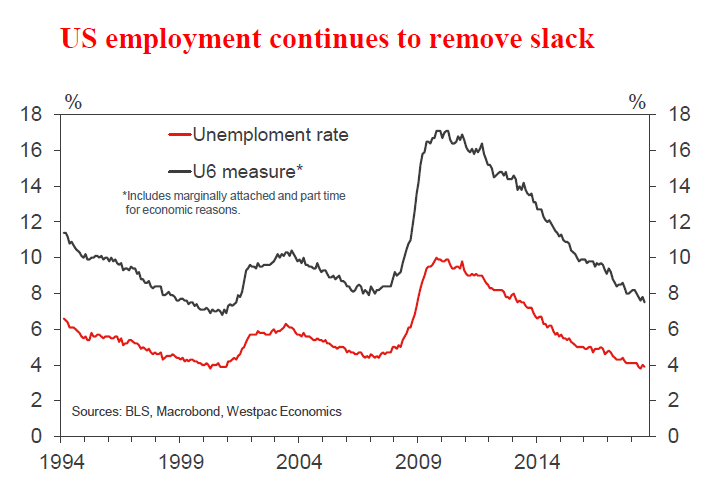
US Aug employment report
- Sep 7, last 157k, WBC 185k
To date, employment growth has run well ahead of population growth in 2018, averaging 215k jobs per month against 182k in 2017.
Come August, we see employment growth remaining strong at 185k. To this forecast, risks are skewed to the upside. As we progress through the remainder of the year, owing to where we are in the economic cycle and amid uncertainty over trade and financial conditions, jobs growth should slow. But the deceleration is likely to be small in scale and, at all points, risks will remain skewed upward.
Strong emphasis also needs to be placed on income growth. We remain of the view that hourly earnings growth will continue to tend towards 3.0%, but is unlikely to move materially above that benchmark until mid-to-late 2019. This will keep inflation expectations in check.


