
U.S. Highlights
- There was no summer vacation from financial market volatility this week as investors were increasingly worried that the global economy is about to slip into recession.
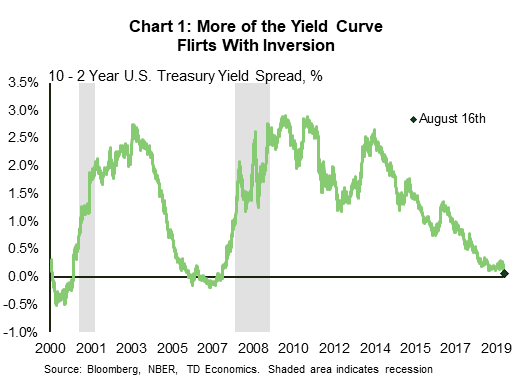
- The difference between the 10 and 2-Year Treasury yields turned briefly negative this week, sending a signal that bond investors expect the economy to get worse before it gets better. While the risks of a recession have risen, we are not there yet.
- The U.S. data was mixed this week, with evidence that tariffs are impacting prices and the factory sector. Consumers continue to be the bright spot, and there were signs that housing may be firming too.
Canadian Highlights
- Growing gloom internationally raises the risk of external weakness seeping into domestic activity.
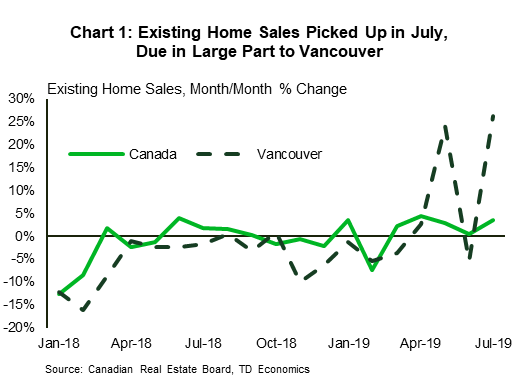
- Meanwhile, existing home sales came in stronger than expected in July, pointing to an increasingly healthy Canadian housing market.
- The Bank of Canada faces a tough road ahead as it weighs a stronger domestic economy against weaker global conditions. The Bank will keep a close eye on upcoming data as it assesses the balance of risks to its inflation and growth forecasts.
U.S. – Markets on Edge as Recession Risks Rise
There was no summer vacation from financial market volatility this week as investors worried that the global economy is about to slip into recession. An inverted yield curve, as measured by the difference between longer and shorter-term bond yields, is one of the more reliable recession predictors. The difference between the 10-Year Treasury and the 3-Month T-bill has been negative for a couple of months now, but the difference with the 2-Year Treasury turned negative briefly this week (Chart 1).
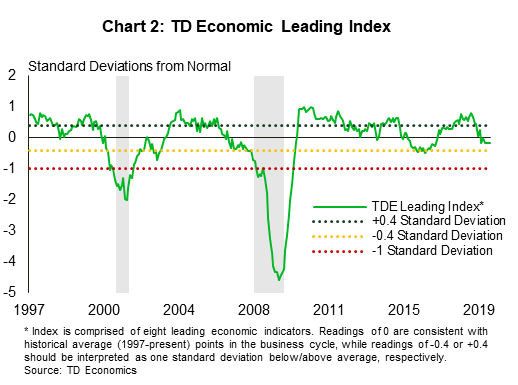
Notably, there is a long and variable lead time on the signal coming from the yield curve. Anywhere from one to two years in the case of the 1990, 2001 and 2008 experiences. The yield curve signals that bond investors expect the economy to get worse before it gets better, but it is not a definitive signal that a recession is imminent. As we discussed late last year (see Perspective) we look at a suite of indicators to see whether we are close to a recession. Our TD Leading Economic Index has deteriorated, but is not yet flashing recession (Chart 2). It is similar to the 2015-16 slowdown, when the Fed paused on its new tightening cycle due to global weakness.
All told, the risks of a recession have increased since the White House ratcheted up trade tensions with China. That said, we still expect the Fed to continue its risk management approach and cut rates another 25 basis points in September. The negative yield curve raises the probability that they take further action in the months ahead.
The Fed is right to be wary of the risks from trade tensions, as evidence that tariffs are hitting the U.S. economy continued to mount this week. The July CPI indicated that tariffs on Chinese imports are likely lifting prices at the consumer level (likely in the neighborhood of 0.2 to 0.4 percentage points). Core goods prices have picked up in recent months. The Fed will look through one-time price increases due to tariffs, since they are a tax which ultimately crimps growth.
The manufacturing sector also continued to struggle in July. Factory production fell 0.4% in July and has been trending lower in 2019. Weaker foreign demand and elevated trade uncertainty is taking a toll on the sector (see report). Housing starts weren’t looking too hot either in July, although an increase in single-family starts, and in building permits were silver linings. This is in line with homebuilder confidence, which continued to improve in August after weakening at the end of 2018.
The bright light in an otherwise crummy week was the consumer. Retail sales were up more than expected in July, setting up consumer spending to be an impressive 3% in the third quarter, stronger than we had expected. If the global backdrop weakens more sharply than we expect, the consumer at least seems to be in a decent position to weather it.
Canada – Tough Road Ahead For The Bank of Canada
Global economic tremors arising from Europe and China shook markets this week. In Canada, the TSX was down almost 1.5% at the time of writing. The price for WTI oil, although bouncing within the $54/barrel to $57/barrel range, settled at roughly the same price ($54) as the beginning of the week.
Amid the turmoil, it was a relatively quiet week for Canada. The only data on the docket this week was on existing home sales, which like other recent housing data came in hotter-than-expected. National existing home sales rose by 3.5% month-on-month in July (Chart 1). Sales grew at a blistering pace in Vancouver, surging by 26.4% and bringing the market back towards balanced territory. It also suggests that the worst of the price declines in this depressed market might finally be behind us.
Overall, the Canadian housing market seems to be on solid footing. Fundamental drivers – strong population growth, healthy job growth and lower mortgage rates – are working together to support Canadian housing demand.
Despite housing data and other indicators, such as stronger wage growth, indicating a healthy domestic economy, there is growing unease on the international stage. Germany may be entering a recession while growth in China could be slowing more than expected. Meanwhile, the U.S.-China trade war has intensified further and doesn’t appear to have any end in sight. These developments were reflected in a brief but telling inversion of the U.S. 10 to 2-year yield curve this week. Among all this external gloom, the only reprieve is a robust U.S. consumer, which should provide some lift to Canadian exports.
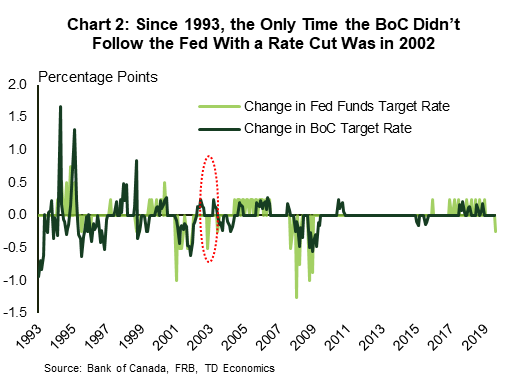
Against this backdrop, the Bank of Canada faces a tough road ahead. While the Canadian economy is likely growing at a pace above the forecast laid out in the July Monetary Policy Report, weaker global growth and continuing trade uncertainty may seep into domestic economic activity. Should the Federal Reserve have to go further than just one more insurance cut in in September in response to these risks, the Bank of Canada may have to follow suit. Indeed, since 1993, except for a brief stint in 2002, the Bank of Canada has always followed the Fed in cutting rates (Chart 2).
To further assess the balance of risks to its inflation and growth forecasts, the Bank of Canada will be keeping a close eye on upcoming data. For next week, July CPI and June retail sales data will give an indication on the underlying strength in the Canadian economy. Core inflation is currently sitting right at the 2% target, but with domestic economic activity stronger, we may see firmer inflation. The fundamentals for retail sales are also solid – strong labor market conditions and accelerating wage gains. But we may see some weakening in the near-term as consumption growth normalizes from a strong first quarter showing. In the event the data disappoints, the Bank of Canada will be more likely to move off the sidelines this year.
Canada: Upcoming Key Economic Releases
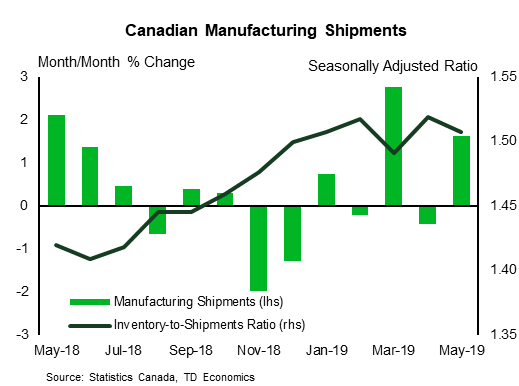
Canada Manufacturing Sales – June
Release Date: August 20, 2019
Previous: 1.6%
TD Forecast: -1.9%
Consensus: 1.8%
Manufacturing activity is poised to contract 1.9% in June owing to a pullback in transportation equipment and lower prices for industrial goods. Motor vehicle shipments have been unusually volatile over the last few months owing to the transitory impact of plant shutdowns, but preliminary production figures and exports both point to partial giveback of last month’s 13% gain. Aerospace exports also point towards a pullback, while fabricated metals will benefit from the removal of steel and aluminum tariffs on US-bound shipments. Elsewhere, a sharp pullback in gasoline prices will weigh heavily on nominal sales of refined petroleum products, while a 0.5% decline in ex-petroleum prices will weigh on nominal sales for the whole manufacturing sector. As a result, real manufacturing sales should see a more modest decline of 1%, leaving them up roughly 6% q/q (ann.) in Q2.
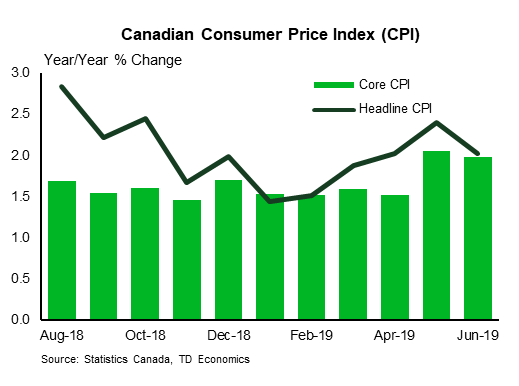
Canada Consumer Price Index – July
Release Date: August 21, 2019
Previous: -0.2% m/m, 2.0% y/y
TD Forecast: 0.2% m/m, 1.7% y/y
Consensus: 0.1% m/m, 1.6% y/y
Inflation is set to fall below target in July with headline CPI forecast to decelerate to 1.7% y/y from 2.0% in June, as a 0.2% m/m increase is overwhelmed by base-effects after last July saw the largest seasonally adjusted increase in ex-food & energy prices since 2008. Gasoline will provide a significant driver on a 3.4% m/m increase in the price at the pump, contributing roughly 0.1pp to the headline print, while food prices should see more modest gains following the 0.7% increase last month.
Our forecast includes a solid 0.1% increase in the ex. food & energy basket which would see this measure of core inflation edge lower to 1.9% y/y from 2.4% in June. We also look for further deceleration in the Bank of Canada’s core measures, with CPI-trim and CPI-median projected to edge lower by 0.1pp. However, this would leave the average of the three unchanged at 2.0% y/y after rounding.
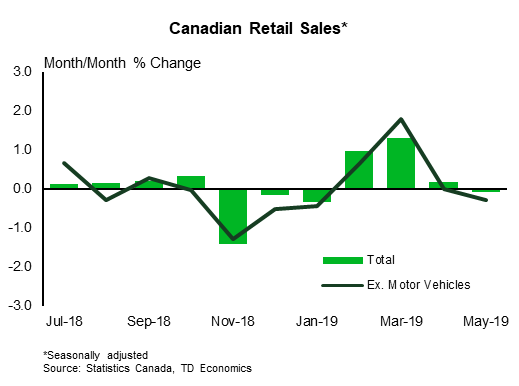
Canada Retail Sales – June
Release Date: August 23, 2019
Previous: -0.1%, ex-auto: -0.3%
TD Forecast: -0.1%, ex-auto: 0.1%
Consensus:-0.3%, ex-auto: -0.1%:
Retail sales are forecast to decline by 0.1% in June as a drag from motor vehicle sales offsets strength in core measures. Auto sales are forecast to edge lower on further weakness in passenger car sales, while nominal gasoline sales will be weighed down by softer gasoline prices. These two components are forecast to offset a rebound in the ex-autos and gas measure which in May registered its largest one-month decline since 2017, despite sales rising in 5 of 9 “core” product groups. Weaker sales activity was largely contained to three groups (clothing, food and beverage, general merchandise) in May, all of which should rebound this month.
Real retail sales should see a more significant decline, leaving them slightly lower for Q2 as a whole, which indicates a moderation in household consumption from the 3.5% annualized pace in Q1.


