
U.S. Review
An Unprecedented Time
- Data this week began to show just how large the coronavirusrelated impact on the economy will be. Efforts to contain the virus are leading to millions of job losses and it’s likely only a matter of time before a majority of economic data reveal unprecedented declines.
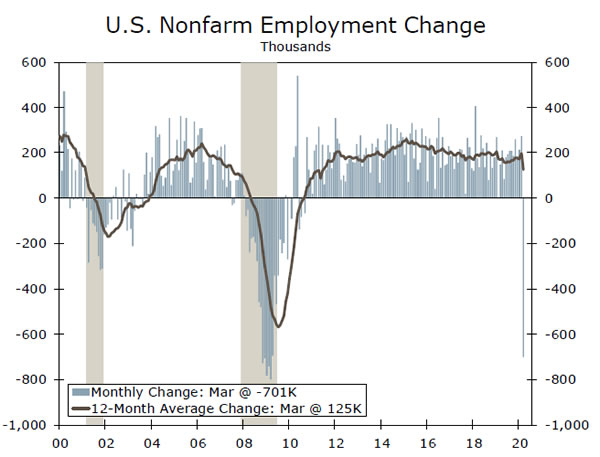
- Employers reported payrolls declined by 701K workers in March. This decline comes before the worst of the coronavirusrelated impacts on the once-strong labor market and only hints at what’s in store. Job losses will be in the millions in April.
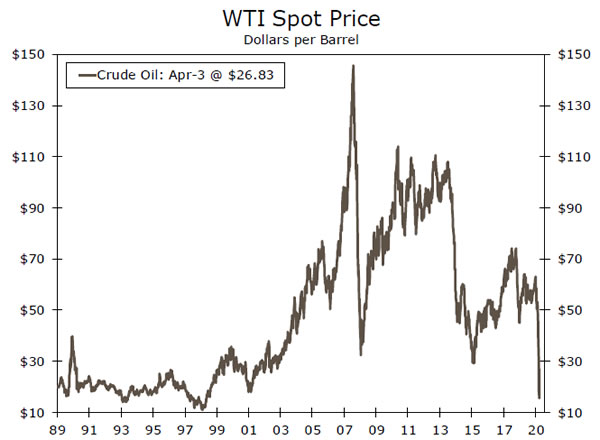
- President Trump tweeted favorable comments of Russia and Saudi Arabia’s relationship, but it’s unclear if coordinated production cuts will occur. Oil prices remain exceptionally low.
An Unprecedented Time
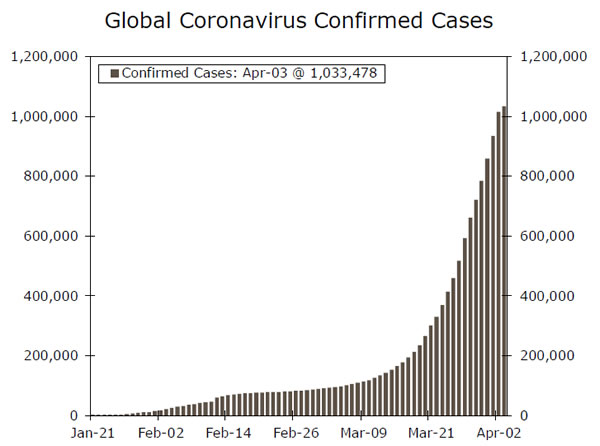
The number of reported coronavirus cases surpassed one million this week, as the human toll of the pandemic continues to mount (chart on first page). At over 245,000, the United States has roughly a quarter of the world’s confirmed cases. Dr. Fauci, the director of the National Institute of Allergy and Infectious Diseases and face of the Coronavirus Task Force, encouraged more aggressive social-distancing measures to curtail the virus’ spread. If there was good news this week, it was that the Task Force sees case counts coming down sharply in the spring, which should help the U.S. economy begin to recover in the second half of the year.
In the name of social distancing, additional states issued stay-athome orders this week, with thirty-eight states currently limiting activity to ‘essential business,’ which varies by state but consists of occupations like healthcare and law enforcement. Increased physical separation will continue to drastically weigh on activity as the economic decline rapidly mounts.
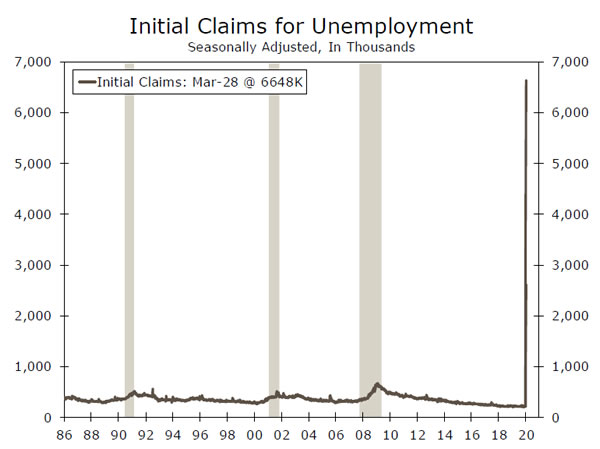
Employers reported payrolls declined by 701K workers in March (top chart). This was much worse than expected, yet it only hints at what’s to come. The report “predated many coronavirus-related business and school closures that occurred in the second half of the month,” due to the timing of the Bureau of Labor Statistics (BLS) survey (March 8-14). The March report, therefore does not include the roughly 10 million people who have filed for unemployment insurance in the past two weeks. From this we can conclude employers’ confidence faltered earlier than expected, and they likely stopped hiring before they started making layoffs.
The BLS report said survey response rates were significantly below typical levels, which may suggest revisions will eventually be in store. As many firms have temporarily closed their doors, however, response rates will likely remained subdued over the next couple of months, which may weigh on the data reliability. Regardless we are set for devastating and unprecedented declines.
The March employment decline is only the tip of the ice berg. For perspective, the 701K decline is already close to the worst monthly declines seen during the 2008 recession, but with more job losses in store, we expect the April payroll decline to be in the millions.
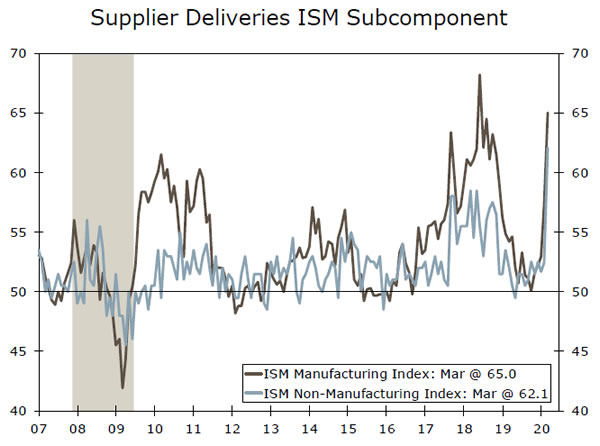
Survey evidence showed some initial strain in March activity, but the ISM manufacturing and non-manufacturing surveys both did not decline as much as expected. That was largely thanks to a jump in the supplier deliveries components (middle chart); typically a measure of increased demand but in this case an indication of supply bottlenecks. We expect both to plunge in April.
Lastly, oil prices bounced when President Trump tweeted that the major oil production countries (U.S., Russia and Saudi Arabia) are back on speaking terms. Despite these favorable comments, it is unclear if coordinated production cuts will occur. Oil prices have recently tested lows they haven’t seen in two decades as supply deluge meets unprecedented levels of low demand (bottom chart).
U.S. Outlook
Initial Jobless Claims • Thursday
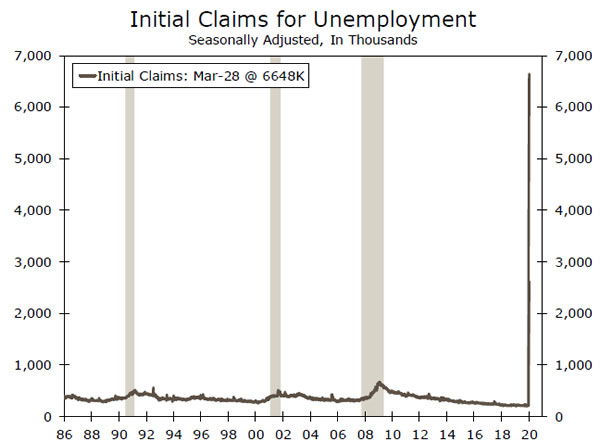
Unprecedented does not even begin to do justice to the record initial jobless claims that have been reported over the past two weeks. Initial jobless claims were 3.3 million for the week ended March 21, shattering the previous record of 695,000 in 1982. One week later, the Department of Labor reported an even more stunning 6.6 million new jobless claims for the week ended March 28.
As dramatic as the past two weeks’ increase has been, unfortunately we doubt we are anywhere near the peak. But while these numbers are abysmal by any measure, if there is a silver lining to them, it is that these are new jobless claims. Thus, it is not necessarily that the total number of unemployed persons is (yet) at unprecedented levels, but rather than the pace of increase over the past two weeks is record setting. That said, if the current trend were to hold up next week, the unemployment rate could end up easily exceeding the 10% high it recorded during the Great Recession.
Previous: 6.6M Consensus: 5.0M
Consumer Sentiment • Thursday
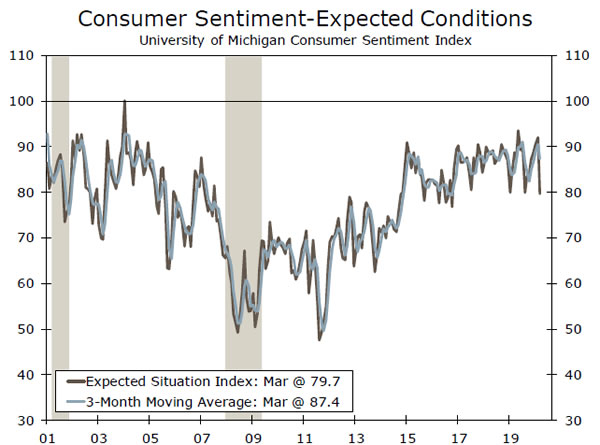
Consumer sentiment declined in March, according to the University of Michigan’s sentiment index. The softer sentiment was relatively limited, however, as the index “only” declined to its lowest level since October 2016. Another leg down is likely in the preliminary April reading, with the Bloomberg consensus looking for a reading of 77.5.
It will be interesting to see how the two key subcomponents, the current and expected conditions indices, behave in the coming months. Given the unusual catalyst for the current recession, there could be a sharp divergence between the current and expected conditions indices if consumers expect tough times in the near term but at least a partial return to normalcy in a few months. If the expected conditions index were to deteriorate rapidly over the next several weeks, and particularly if it breaks below the 50 level that was the low for the Great Recession, it might not bode well for a strong rebound in the economy later this year.
Previous: 89.1 Consensus: 77.5
CPI • Friday
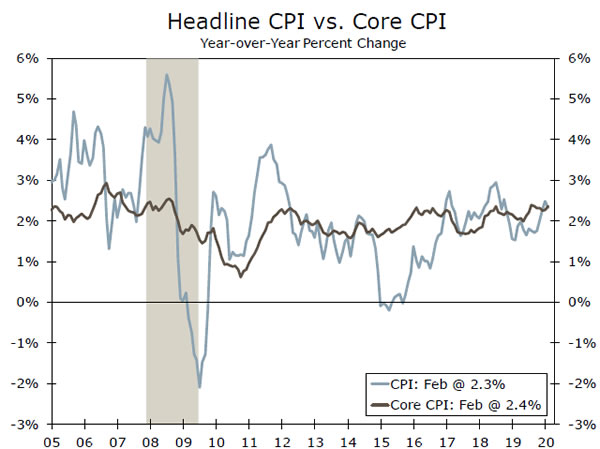
Headline consumer price inflation likely slowed in March, led by a decline in energy prices. Oil prices fell a stunning 50% over the course of March and are likely to weigh on headline inflation for an extended period of time. One area that will likely generate some inflationary pressure is food at home. Food at home prices rose just 0.8% year-over-year in February but will likely start to accelerate.
We also expect core inflation to slow in the months ahead, as a weaker economy and the near total shutdown of some parts of the economy lead to disinflation. Inflation for hotels, food away from home and airfare, for example, will likely see sharp declines. Of course, the actual inflation experienced by consumers in the near term may vary sharply from the CPI data, as they may be unable or unwilling to take advantage of the sharp declines in prices in some areas. Actual U.S. consumption is likely to look much different in March and April than the basket of goods that comprises the CPI.
Previous: 2.3% Wells Fargo: 1.6% Consensus: 1.6% (Year-over-Year)
Global Review
Sentiment Indicators Still Point Down in Many Countries
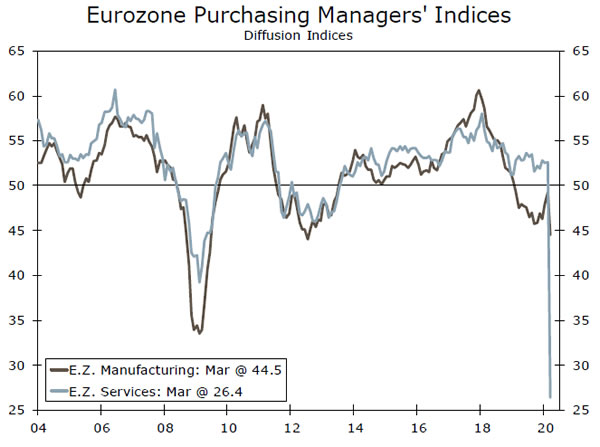
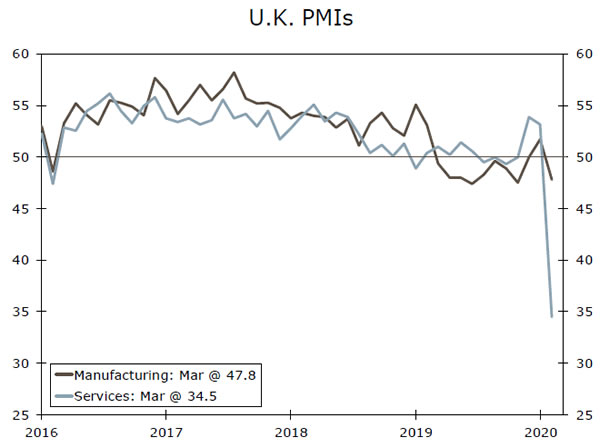
- This week, we received a bit more detail on the economic impact many international economies face following the outbreak of the coronavirus. Initial market sentiment indicators still pointed down in most countries with the Markit manufacturing and services PMIs revised lower in the Eurozone and United Kingdom.
- China’s PMIs returned to expansion in March, with the manufacturing PMI climbing 16.3 points. Meanwhile the nonmanufacturing index also rose, and the index for small firms surged the most since 2017.
Sentiment Indicators Still Point Down in Many Countries
At the end of last week, credit downgrades attracted some attention with the United Kingdom’s bond rating downgraded by Fitch to AA- from AA due in part to the coronavirus impact and Brexit uncertainty. Meanwhile, S&P downgraded Mexico bonds to BBB and Moody’s downgraded South Africa to Ba1, losing its last investment grade rating. The credit downgrades continued into this week, with Fitch downgrading Colombia’s bond rating to BBB-, leaving it on the edge of junk. Fitch noted that the predictability and credibility of fiscal policy, lower oil prices and weaker economic performance all contributed to its decision.
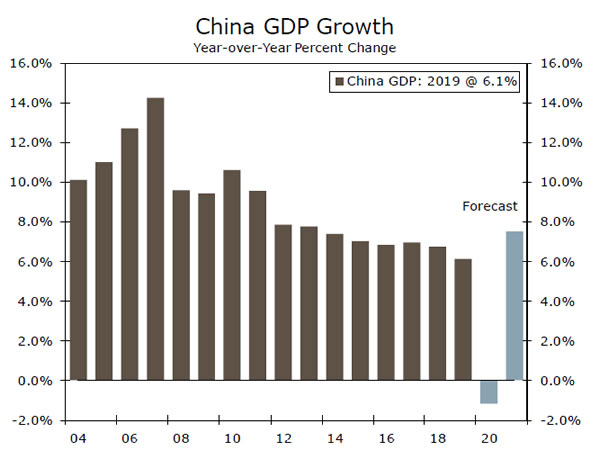
Meanwhile, on a data front this week, we received a bit more detail on the economic impact from the coronavirus outbreak. One of the most notable data releases was China’s March PMIs, which showed to what extent the economy is recovering after the collapse in activity last month. The manufacturing PMI returned to expansionary territory in March from February’s record lows, climbing 16.3 points to 52.0. The index for small firms surged 16.8 points to 50.9, the highest reading since 2017, while the nonmanufacturing PMI also rebounded into expansion, jumping to 52.3 from 29.6. While the better-than-expected data are encouraging, we still expect Chinese GDP to fall about 1% in 2020, given the nationwide lockdowns earlier this year (top chart).
Elsewhere, market sentiment indicators still pointed down. The Eurozone Markit manufacturing and services PMI were revised lower to 44.5 and 26.4 in March, respectively, well below the 50 mark that indicates expansion (middle chart). Meanwhile, Italian manufacturing suffered a steep decline. The Markit manufacturing PMI for Italy printed much lower than expected, falling to 40.3 from 48.7, while the services PMI slumped to 17.4 from 52.1. Italy was one of the first countries following China to be hit hard by the coronavirus outbreak. The disease spread rapidly through the country, promoting the government to impose strict lockdown procedures and close businesses across Italy. Providing further indication that the Eurozone economy will likely suffer as a result of the coronavirus, Spain’s Markit manufacturing PMI also slid in March to 45.7, while the services PMI dropped to 23.0. Given that many countries across the Eurozone have essentially locked down and many parts of those economies have nearly stalled, we look for real GDP to contract 4.2% in 2020.
In the United Kingdom, manufacturing also shrank in March. The final Markit manufacturing and services PMI were revised slightly lower to 47.8 from 48.0 and 34.5 from 35.7, respectively (bottom chart). The employment component declined the most since July 2009, while purchase activity was also reduced over the month linked to the virus outbreak. Meanwhile, housing data released this week showed house prices were rising at the fasting pace in more than two years prior to the coronavirus pandemic. Values jumped 3% year-over-year in March, but that trend is likely to be disrupted in the near term.

Global Outlook
RBA Policy Decision • Tuesday
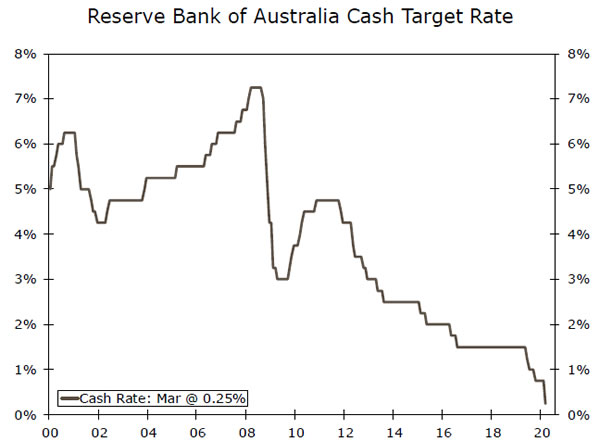
Australia’s economic situation has deteriorated significantly in recent months amid the coronavirus outbreak and plunge in oil prices. In response to the pandemic, the Australian government announced massive fiscal stimulus measures aimed at supporting businesses and households, as well as balance-sheet support to ensure the flow of credit in the economy. In addition, the Reserve Bank of Australia (RBA) reduced its cash rate a cumulative 50 bps over the month of March to 0.25%, which Governor Lowe described as the effective lower bound. The RBA also announced various other measures, including government bond purchases in the form of quantitative easing and established a US$60B swap line to provide U.S. dollar liquidity. Despite these efforts from the RBA, there is little that policymakers can do to avoid a deep slump in growth. We suspect the RBA will likely hold its cash rate at 0.25% for an extended period of time, but if the virus continues to spread, the RBA may have to implement additional unconventional stimulus measures.
Previous: 0.25% Wells Fargo: 0.25% Consensus: 0.25%
Norway CPI • Wednesday
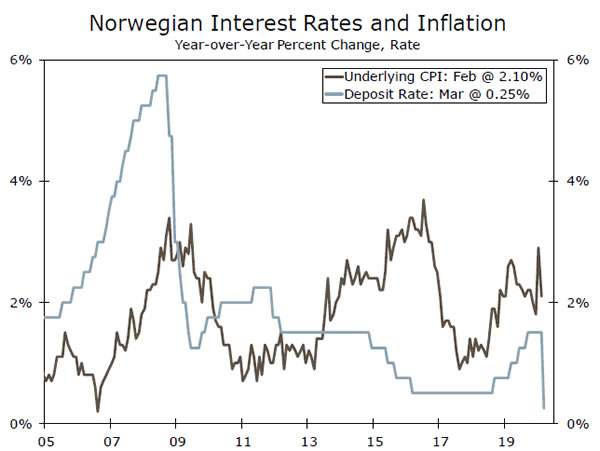
Like the rest of the global economy, the Norwegian economy has also been hit hard by the coronavirus outbreak and plunge in oil prices. Given the substantial uncertainty surrounding the impact of the shocks, the Norges Bank reduced its cash rate 50 bps to 1.00% in March and has since announced additional measures aimed at supporting its economy. That said, we see potential for further monetary easing from the central bank in the coming quarters.
Next week’s March inflation report will be of particular interest and could provide additional rationale for further Norges Bank easing. We expect inflation to slow further, given the rapid decline in oil prices and lower travel demand amid to slow the spread of the coronavirus. On the other hand, a persistently weaker Norwegian krone poses an upside risk to our inflation view, as it could help boost prices.
Previous: 0.9% Consensus: 0.8% (Year-over-Year)
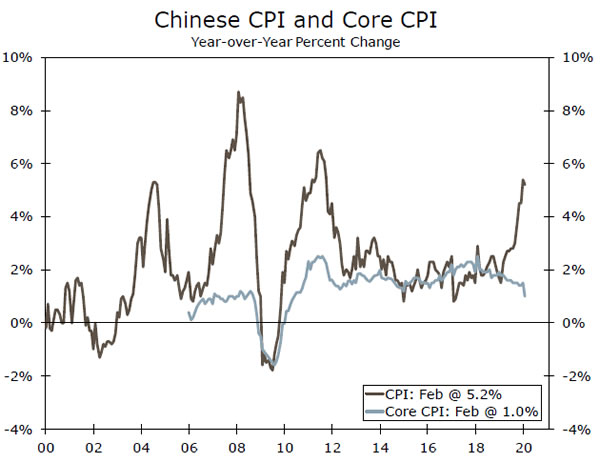
China CPI • Thursday
Chinese headline consumer price inflation remained elevated in February, rising 5.2% year-over-year, with food prices increasing 21.9%. Services prices, however, slowed significantly. Notably, transport and communication prices plunged 1.6% in February. Meanwhile, producer prices declined more than expected to 0.4% in February from a 0.1% gain the previous month.
Next week’s March inflation report will provide a bit more detail on the health of the Chinese economy following the virus shock, but is unlikely to have a significant impact on any stimulus measures from the PBoC. Like Norway, China’s price data may be negatively affected by the spread of the coronavirus and accompanying countrywide lockdown, but stronger sentiment data could push inflation higher or at least result in more stable inflation.
Previous: 5.2% Consensus: 4.9% (Year-over-Year)
Point of View
Interest Rate Watch
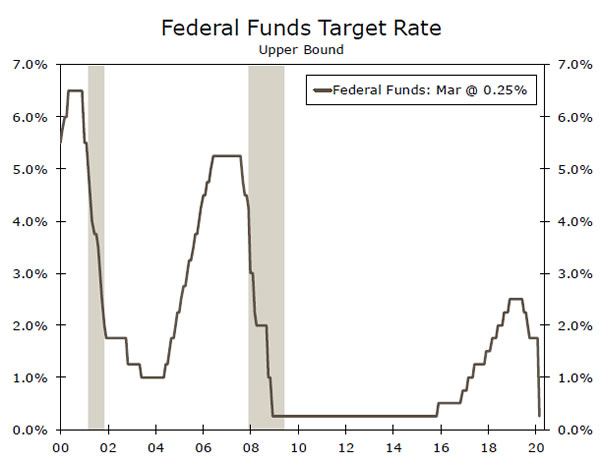
Will the Fed Go Negative?
The FOMC eased monetary policy this year with extraordinary speed. As recently as March 2, the target range for the fed funds rate stood at 1.50% to 1.75%. Within two weeks, the FOMC had slashed it all the way back to 0.00% to 0.25% (top chart).
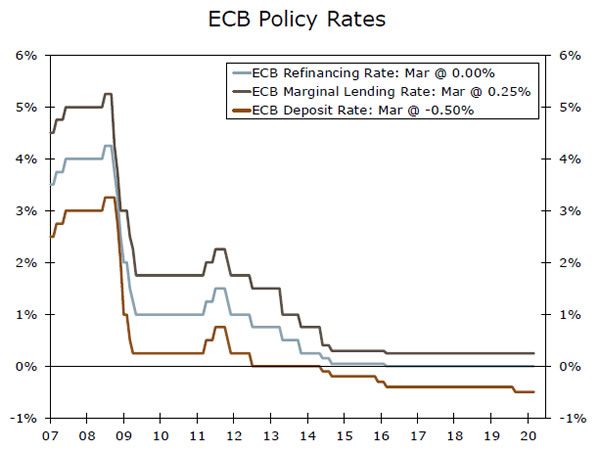
But with economic activity in the United States in freefall due to steps to contain the COVID-19 pandemic, the question of negative interest rates naturally arises. After all, many major central banks have been negative for years. For example, the European Central Bank (ECB) took its deposit rate into negative territory in June 2014 (middle chart), and central banks in Switzerland and Japan have also been negative for a number of years. Could the Fed follow suit?
The FOMC has been undertaking a strategy review over the past year or so, and the topic of negative interest rates was discussed at the October 30 FOMC meeting. Minutes from that meeting reveal that “ALL (emphasis ours) participants judged that negative interest rates currently did not appear to be an attractive monetary policy tool in the United States.” Although there was some acknowledgement that negative rates may have some benefits in foreign economies, there was widespread belief that negative policy rates could have adverse effects on the U.S. financial system due to its structural difference relative to foreign financial systems.
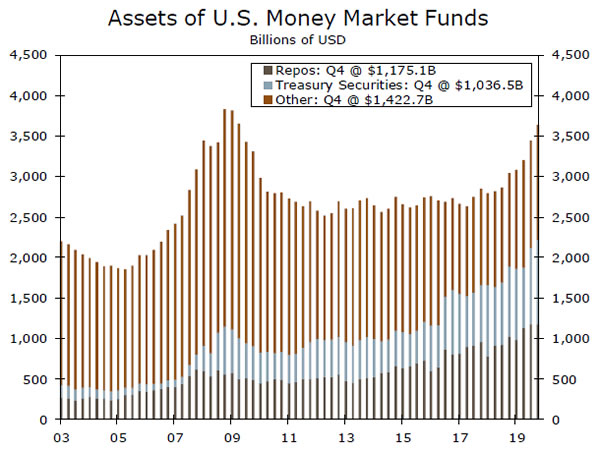
Specifically, money market funds play an important role in the U.S. financial system. As shown in the bottom chart, the assets held by money market funds total more than $3.6 trillion. Money market funds are significant players in the market for repurchase agreements (repos), which are an important source of liquidity for other parts of the financial system. So if shortterm interest rates were to go into negative territory, money market funds could experience significant redemptions. Consequently, their ability to provide liquidity to other parts of the financial system could be adversely affected. Although the probability of the Fed going negative is clearly not zero, we do not expect the FOMC to pursue that option anytime soon.
Credit Market Insights
Tumultuous Time for Treasuries
The tumult in the U.S. government bond market stood out in March, even amid historic volatility across financial markets. The beginning of the month saw the traditional flight to quality as investors took a risk-off stance in the face of the rapidly deteriorating economic outlook. The velocity of this move pushed down the yield on many Treasury futures contracts faster than the yield on the corresponding cash bond. While this can often happen during periods of volatility, changes in the Treasury market over the past several years amplified this dislocation. For one, the increasing adoption of relative value trades in which funds often buy cash Treasuries and sell the corresponding futures contract. Normally, the strategy offers a relatively steady return and can be cheaply levered, given the safety and liquidity of Treasuries. In mid-March, however, the steep decline in futures yields led to mark-to-market losses, which, on top of difficulties funding these positions, led many to start selling their Treasuries. This beget more selling by those in similar positions, as falling prices increased paper losses. Moreover, large Treasury issuance over the past couple years left dealers, who normally step in as buyers, with less room to absorb these unwinding positions. These factors limited liquidity and pushed Treasury yields considerably higher. To prevent these frictions from rippling through the financial system, the Fed expanded its Treasury purchases first to $500 billion then to the “amounts needed to support smooth market functioning.”
Topic of the Week
Jobless Claims Point to Sharp Contraction
Every Thursday at 8:30 a.m. ET, the U.S. Department of Labor reports the number of people who filed for unemployment benefits the prior week. This number is the most timely hard data point regarding the health of the U.S. labor market, meaning every Thursday for the foreseeable future will give us greater insight into the depth—and potentially the duration—of the incipient recession. The evidence so far is horrific—9.9 million people filed for unemployment benefits in the weeks ended March 21 and 28. In short, there has already been an entire recession’s worth of job losses in the span of just two weeks. This is perhaps not surprising, given the extent to which the economy has shut down, but it is shocking nonetheless, and emphasizes the downside risks to any forecast or hope of a “V-shaped” recovery.
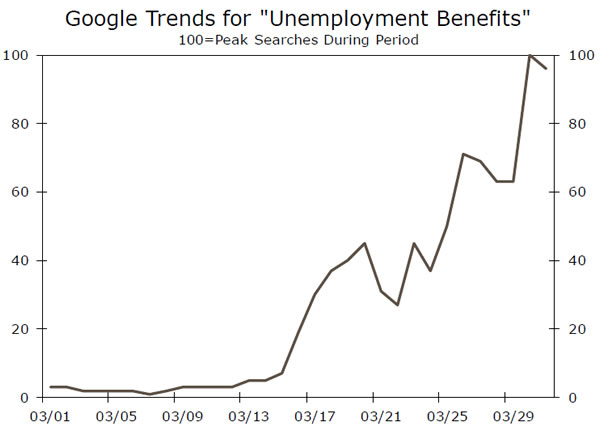
Moreover, prior to any recovery the economy still has much further to fall. Nearly every state has reported that it is simply unable to process everyone who wants to file a claim. For example, New York reported that it received more than 7.8 million calls about unemployment benefits during the week ended March 28, compared to around 50,000 in a usual week. From this, we can only conclude that the 366,000 claims officially reported for the state severely underestimate the number of people who recently lost their job. Nationwide, the 9.9 million initial unemployment claims that have already been filed would push the unemployment rate up to 9%, if the labor force remained at its average for the past 12 months. But, we expect millions more claims to be filed. Which Thursday they show up in the official data is hard to say, but they are certainly coming, as states work their way through the backlogs and firms, which initially tried to retain staff, slowly but surely succumb to the reality of plunging demand. The bottom chart shows the single highest day of Google searches for “unemployment benefits” was March 30—a day which has not yet been included in any jobless claims report. It is more likely than not that the unemployment rate will reach double digits, and soon.


