
U.S. Review
Waves of Data Headed into Independence Day Weekend
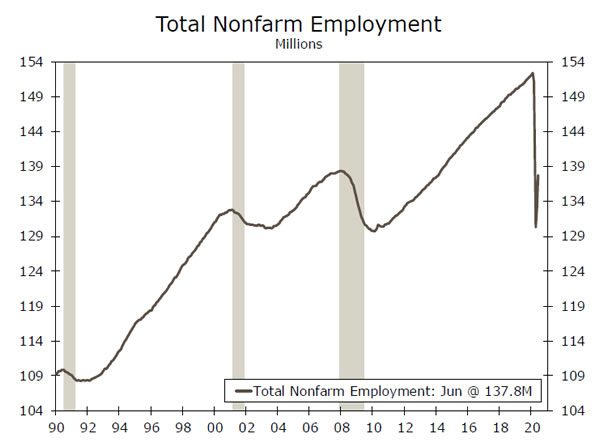
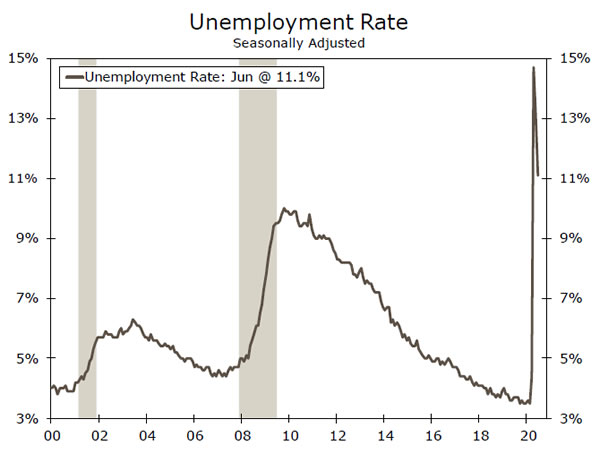
- Total payrolls rose by 4.8 million and the unemployment rate fell to 11.1%. Another step in the right direction, but employment remains nearly 10% below the February peak.
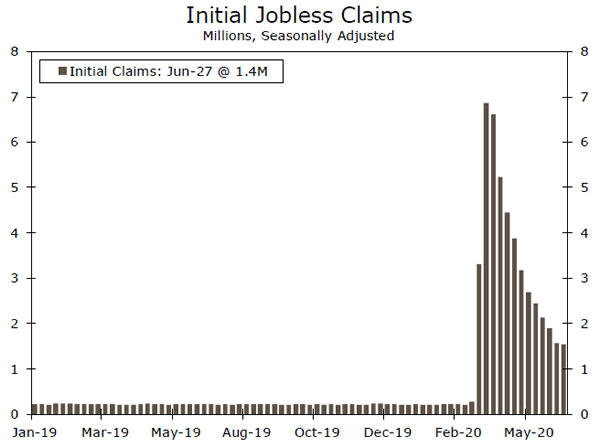
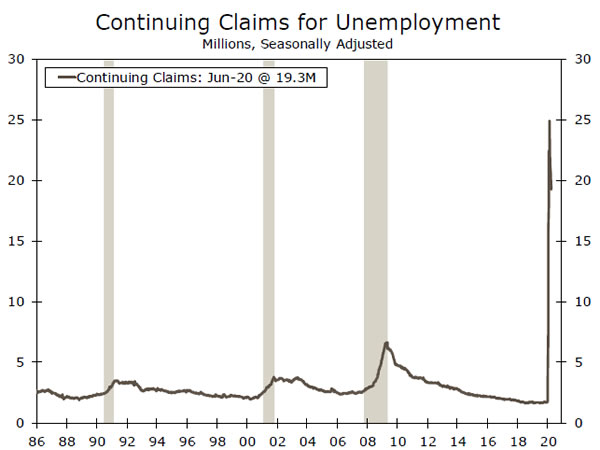
- Initial jobless claims slightly fell to 1.4 million for the week ending June 27. Continuing claims came in at 19.3 million for the week ending June 20. Processing issues may be overstating the numbers, but claims remain highly elevated nevertheless.
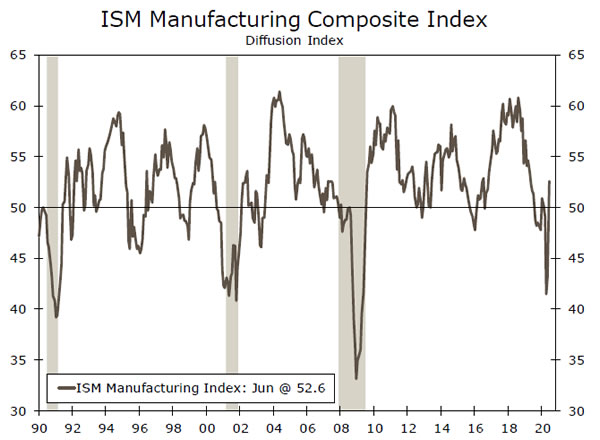
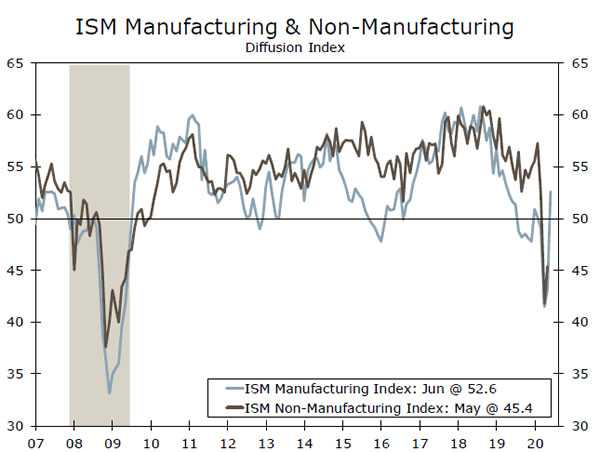
- The ISM manufacturing index blew past expectations during June, rising to a 14-month high of 52.6. The surge likely reflects relief about reopening rather than a full rebound in activity.
Waves of Data Headed into Independence Day Weekend
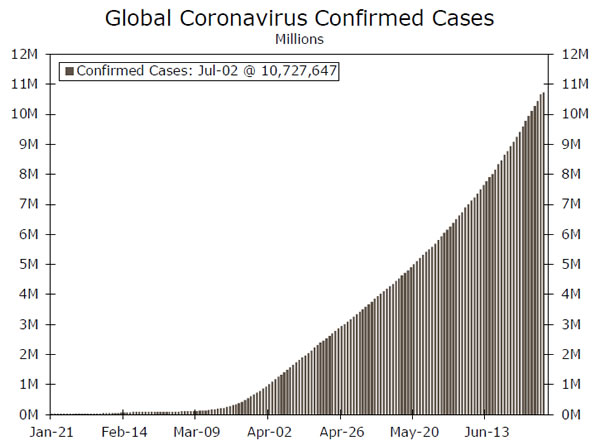
It was a busy week for economic data headed in the Fourth of July weekend. The resurgence of the coronavirus in the South and West once again dominated headlines, as new infections reached a single-day record and passed 50,000 cases. In response, many state and local officials around the country are now implementing mask-wearing mandates, delaying reopening plans and even reinstituting new restrictions on some businesses. Economic activity in these areas appears to be slowing, at least according to high frequency data which track mobility and restaurant reservations. Overall, a smooth climb back towards prior peak levels looks increasingly less likely.
In terms of the more traditional economic indicators, the labor market was front and center this week. During June, nonfarm payrolls rose by 4.8 million jobs, while the unemployment rate fell to 11.1%. Both were surprises to the upside. While this is certainly another step in the right direction, employment levels remain almost 10% below February peak. Most major industries added back to payrolls, but gains were led by the leisure & hospitality, retail and healthcare industries. Separately reported earlier in the week, the ADP reported a smaller gain for the month (about 2.4 million).
Initial jobless claims slightly fell to just over 1.4 million for the week ending June 27, a bit higher than expectations. Claims have trended lower recently, but remain frustratingly elevated. Processing issues at the state level, which have led applicants to apply multiple times before actually receiving benefits, may be overstating the numbers. Continuing claims came in at almost 19.3 million. In short, labor market conditions continue to show an improving trend, yet remain well-below pre-pandemic levels.
Conditions in the manufacturing industry also appear to be improving. The ISM manufacturing index blew past expectations during June, rising to a 14-month high of 52.6. New orders also sharply rebounded, which bodes well for the near-term outlook for the factory sector. While this is clearly welcome news, the surge in the ISM likely reflects the relief about re-opening rather than a full rebound in activity for the sector.
Fed Chair Powell and Secretary Mnuchin both appeared before the House Financial Services Committee on Tuesday. While few specifics on additional monetary or fiscal aid were discussed, the committee was reminded that the expanded unemployment benefits would expire at the end of July and additional measures would likely be needed to be taken to support the recovery. Minutes for the June 9-10 FOMC meeting were also released this week. Officials stressed the need for monetary policy to remain highly accommodative until the economy gets fully back on its feet. Members also commented on the extraordinary amount of uncertainty the economy is currently facing, particularly surrounding the risk of an increase in coronavirus cases as many areas of the country start to re-open. Those comments now seem prescient considering many areas of the country are now rolling back or delaying re-opening plans to contend with the recent rise in infections.
U.S. Outlook
ISM Non-Manufacturing • Monday
The ISM manufacturing index for June, released this past Wednesday, crossed back above the 50 demarcation line for the first time since February. The details were mostly encouraging, with the new orders component at its highest level since January 2019. But, it is important to keep in mind that the PMI are diffusion indices, meaning they are useful for capturing turning points, but not great for determining the actual level of activity.
If the ISM non-manufacturing index for June is also above 50, this would be yet another sign that economic activity bottomed out in April and has been on a steady upward ascent since. That said, it would not be a sign that activity is back to “normal” levels, as it will likely take several months, if not years, of steady expansion to recoup the March/April decline. The key concern at this point, in our view, is that the May/June momentum could be halted in July amid a resurgence of the virus in some parts of the United States.
Previous: 45.4 Wells Fargo: 51.2 Consensus: 50.0
JOLTS • Tuesday
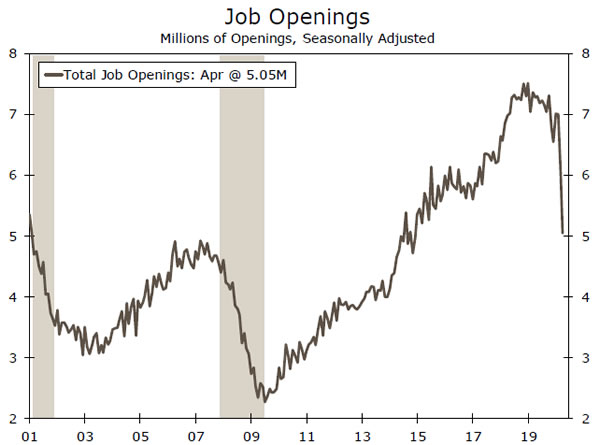
Qualitatively, the JOLTS report for April showed what you would expect: a collapse in openings and hiring and a surge in layoffs. While some industries like leisure & hospitality unsurprisingly saw large declines in openings, the pain was widespread, as not a single major industry had more job openings in April than there were in February. But all things considered, the report could have been worse.
Openings “only” declined to 2014 levels, and based off of the May employment report as well as other economic data, it seems likely that openings and hiring bottomed out in April. If additional data continue to come out in a way that signals April was the bottom in economic activity, this should cement the view that fears of an unemployment rate north of 20% were overblown. The question now shifts to how long of a road it will be back to February levels for job openings, unemployment and other labor market data. A good first sign would be a jump in openings in May for hard hit industries.
Previous: 5.05M
Jobless Claims • Thursday
While initial jobless claims remain historically high at more than 1 million per week, this is a gross rather than net number. The actual number of people collecting unemployment continues to steadily decline, as shown by the move down in continuing claims. Of course, at 19.3 million, continuing claims still remains much, much higher than they were in the Great Recession, let alone where they were in February.
The extra $600 per week in unemployment benefits provided under the CARES Act is set to expire on July 31. This policy change has been a clear success in terms of keeping personal income from collapsing over the past few months. But, benefits that exceed regular wage rates for many workers create a labor supply disincentive that can create challenges over time. Striking a balance between these two economic realities will be key to sustaining the recovery in the second half of 2020 and into 2021.
Previous: 19.3M
Global Review
Q2 Set to Be a Tough Quarter for Most Global Economies
- It was a mildly busy week for foreign economic data and events, while global COVID-19 cases continued to rise.
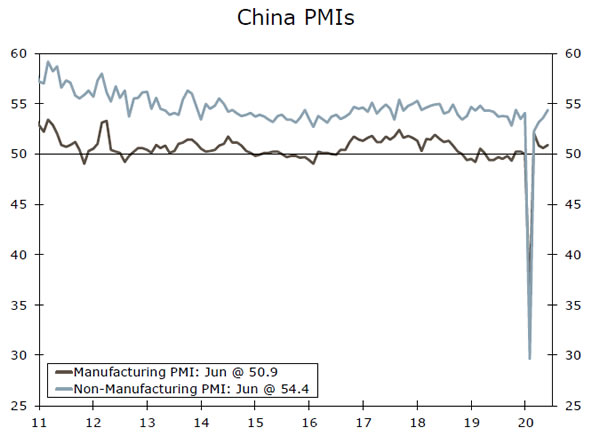
- China’s PMIs beat market expectations in June as the manufacturing and services PMIs as well as the Caixin manufacturing PMI strengthened and remained above the breakeven 50 level.
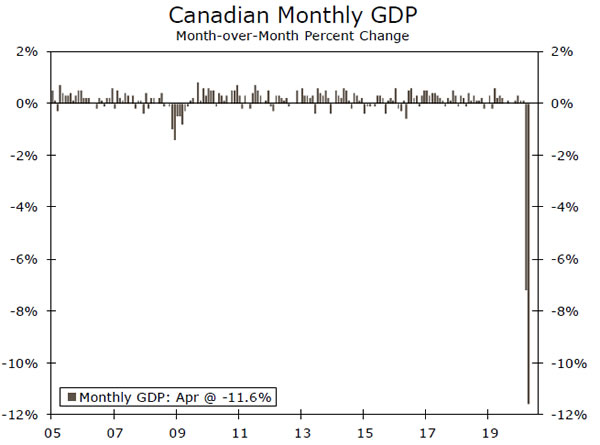
- Data out of Canada were less encouraging, however. Economic activity fell sharply in April as strict COVID-19 lockdown measures weighed on growth.
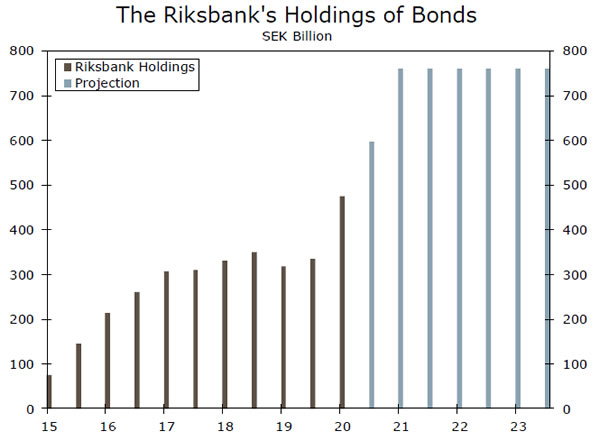
- Finally, the Riksbank caught market participants off guard by delivering a SEK200B increase in its QE program.
Chinese Data Point to Economic Rebound
The recovery in China from the COVID-19 pandemic appears to be continuing, with data this week showing the PMI indices for manufacturing and services climbed in June. The manufacturing PMI unexpectedly edged up to 50.9, remaining above the breakeven 50 level for four consecutive months. The report details indicate nine of the 13 sub-indices were higher than last month’s levels, with new orders increasing 0.5 points to 51.4, while new export orders jumped 7.3 points to 42.6. Meanwhile, the services PMI jumped to 54.4, also beating consensus expectations. Nonmanufacturing new orders edged up slightly to 52.7, while the subindex of employment rose to 48.7. The data appear to be consistent with a solid economic rebound in Q2 after a large slump in Q1 GDP. Meanwhile, the June Caixin survey rose in line with the other official PMI data, rising to 51.2 from 50.7 in May.
Canada Set for Historically Large Fall in Q2-2020
Canada’s economic activity fell sharply in April, recording its biggest monthly drop on record as strict COVID-19 lockdown measures weighed on growth. Real Canadian GDP shrank 11.6% month-over-month, following a 7.5% decline in March, which will likely set up the economy for a historically large fall in Q2-2020. April marked the first full month of lockdown measures, which weighed on all 20 industrial sectors. Notably, the accommodation and food services sector dropped 42.4%, after a 37.1% decline in March, bringing the sector down roughly 64% from its February 2020 level. The report also showed continuing declines in the manufacturing and construction sectors. The manufacturing sector fell 22.5% as all subsectors contracted and many factories were either fully shut down or operated at a lower capacity. Meanwhile, the construction sector declined 22.9% with all types of construction activity down. Overall, we expect the Canadian economy to contract sharply in the first half of this year; however, we look for a rebound in H2-2020 as more recent data, such as the May employment report, offer hope for a strong recovery.
Riksbank Surprises Market Participants with QE Boost
At its July monetary policy meeting, the Riksbank caught many market participants off guard by unveiling an expansion of its asset purchase program to help alleviate the economic consequences from the COVID-19 pandemic. The central bank opted to extend its asset purchases to SEK500B from SEK300B up to the end of June 2021, and will begin purchasing corporate bonds in September 2020. Nevertheless, the Riksbank held the door open to further easing, and said it is prepared to continue to use the tools at its disposal to provide support to the economy and inflation such as supplying further liquidity or cutting the repo rate if assessed to be a useful measure.
Despite the substantial stimulus measures, the Swedish economy is still likely to be negatively affected by the COVID-19 pandemic. Sweden’s GDP growth in the first quarter was not hit as hard as other foreign economies, but data point to a sharp decline in the second quarter. The central bank now looks for the economy to decline 4.5% in 2020, followed by a rebound in 2021 to 3.6%.
Global Outlook
RBA Rate Decision • Tuesday
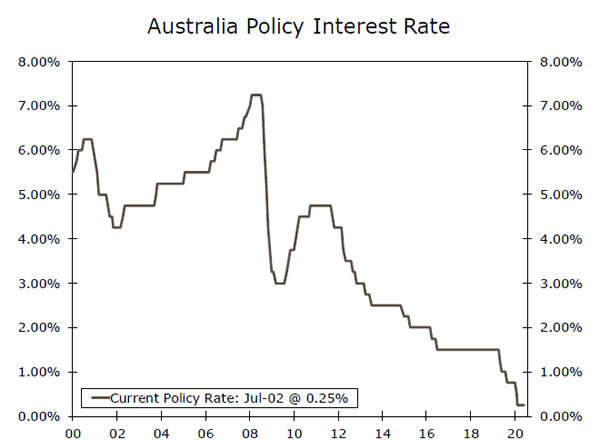
The Reserve Bank of Australia (RBA) held its Cash Rate and threeyear yield targets at 0.25% at its last policy meeting in June. Since the May meeting, the central bank has sharply slowed the pace of its bond buying, as fixed income markets began to stabilize, only purchasing government bonds on one occasion. In the June announcement and subsequent minutes, policymakers were more upbeat on the Australian economic outlook, suggesting the depth of the downturn could be less than previously anticipated. In addition, members noted the number of new COVID-19 cases has decreased significantly and some restrictions on activity were being eased earlier than expected, while there have also been signs that hours worked stabilized in early May and some forms of consumer spending picked up. At its meeting next week, we look for the RBA to maintain a steady policy and expect the current cash target rate of 0.25% to remain at its current level for the foreseeable future.
Previous: 0.25% Wells Fargo: 0.25% Consensus: 0.25%
Norway GDP • Wednesday
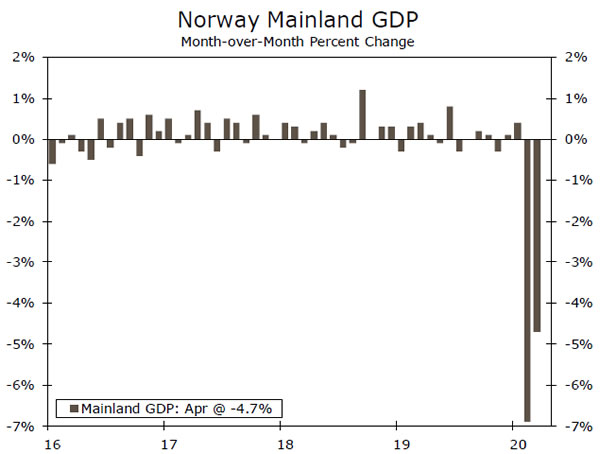
Recent data out of Norway have continued to provide some encouragement with leading indicators such as the manufacturing PMI edging higher to 48.9 in June. In addition, May retail sales were strong, rising 2.8% month-over-month after a solid 4.8% jump the previous month. Next week’s GDP release will provide the latest look at the impact of the COVID-19 outbreak on Q2. Mainland GDP contracted 4.7% month-over-month in April, but the underlying data suggest some increased activity toward the end of the month as lockdown measures were eased. We now look for the Norwegian economy to contract 4.6% for full-year 2020.
Next week also sees the release of the June inflation report. Headline CPI inflation and underlying inflation have shown a marked rise in recent months, likely in part by higher costs and lower productivity resulting from COVID-19 disruptions. Despite the recent abovetarget inflation readings, the Norges Bank is likely to overlook the moves and maintain a steady policy rate for the foreseeable future.
Previous: -4.7% (Mainland, Month-over-Month)
Canadian Employment • Friday
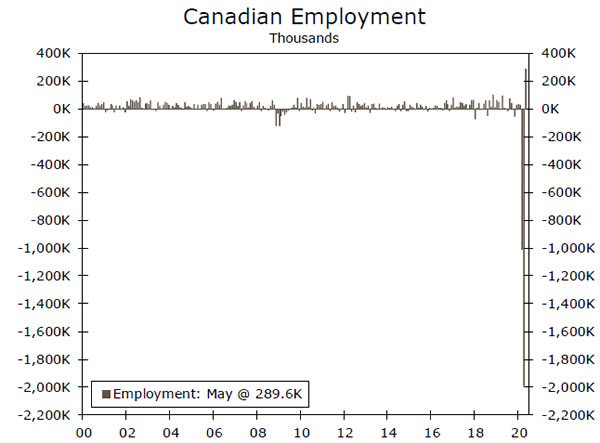
The May jobs report offered some hope that the economic trough might have been reached as employment unexpectedly rose by 289,600 after massive drops in March and April. The jump in May was likely in part due to some Canadian provinces easing restrictions and allowing some nonessential business to re-open, which allowed individuals to return to work. Meanwhile, total hours worked rose, at a faster pace than the growth in employment in most industries, while average hours worked rose slightly to 29.5 hours. Despite the large increase in jobs, the unemployment rate rose to 13.7% in May, the highest rate since the series began in 1976 as more Canadians began looking for work. In addition, significant underutilization continued with 34.8% of the potential labor force having worked less than half of their usual hours, which is up considerably from 11.9% in February. Next week, we will be watching to see if employment rises further in June, as the country continues to re-open, allowing more workers to return to their jobs.
Previous: 289.6K
Point of View
Interest Rate Watch
The Bond Market Senses Trouble
The bond market continues to exhibit an extraordinary degree of caution, particularly compared to the stronger performance of the equity market. Bond yields slipped this past week and the yield curve narrowed, as investors focused on the resurgence in COVID-19 cases in the Sunbelt and Southern California. The U.S. saw more than 50,000 new confirmed cases on Wednesday and a number of states have seen their daily new case numbers hit records in recent data. The rise is an ominous sign headed into the Fourth of July holiday weekend. COVID-19 has tended to surge following major holidays, which see a rise in social gatherings.
The resurgence in cases has already elicited policy responses that are almost certain to weigh on economic growth in coming weeks. Several states have slowed down or rolled back the re-opening of their economies. A further resurgence might put the re-opening of schools at risk. While the U.S. will likely avoid a new round of mandated shutdowns, private businesses and consumers can effectively shut the economy down by themselves if they close stores, as Apple recently has, or pull back on their level of engagement.
The rise in COVID-19 cases confirms the fears raised at the June FOMC meeting, where several members raised concerns about a rise in business failures that might trigger a further tightening in credit conditions and another pullback in economic activity. The anecdotes in the FOMC minutes suggest the Fed sees risks weighted toward the downside. Some FOMC members also seem perplexed about how hard they should push Congress for additional fiscal stimulus, without crossing critical lines.
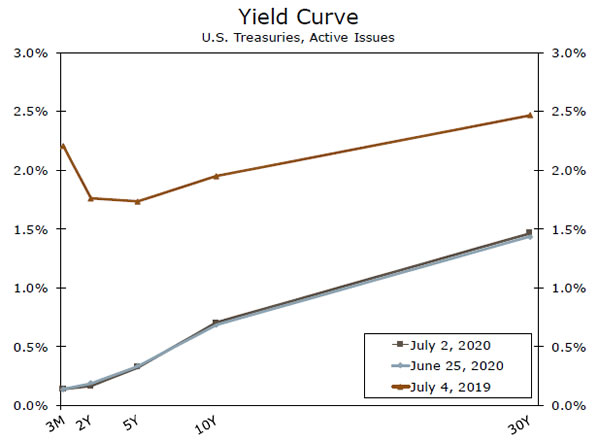
The FOMC minutes also show the concept of yield curve management which continues to receive some attention. The Fed has had only limited success in the past at bending the yield curve, so the discussion remains largely academic. Bond yields moved modestly lower this week before this morning’s surprisingly large 4.8 million job rise in nonfarm employment. The Treasury’s 10-year note ended the week yielding around 0.70%, while the two-year note was yielding roughly 0.17%.
Credit Market Insights
The Fed’s Credibility Facilities
On Monday, the Federal Reserve Bank of New York announced that “the Primary Market Corporate Credit Facility (PMCCF) is operational and available for use beginning June 29.” The facility aims to help companies access credit needed to weather the ongoing pandemic. Through the facility, the Fed has up to $500 billion to purchase bonds and syndicated loans from eligible issuers, but it is unclear how much the Fed will actually need to spend.
Since the Fed’s March 23 announcement, corporate bond spreads have narrowed considerably, while investment grade (IG) bond issuance has surged. In fact, through the first half of 2020, the level of IG issuance nearly doubled the level of issuance through the first half of 2019 and nearly eclipsed the full-year record from 2017. With the corporate bond market running smoothly, many have wondered why the Fed needs to go forward with its unprecedented bond purchasing programs. In response to a similar question posed at a congressional hearing last month, Chairman Powell responded, “we feel that we need to follow through and do what we said we’re going to do.” That is, the corporate bond market has returned to smooth functioning in large part due to the Fed’s intervention—or the promise of future intervention. If the Fed were to balk on its previously announced facilities, it could lose the credibility it needs to reassure financial markets and the broader economy in the next crisis. That said, the uptake from the facility could be limited, if markets continue to run smoothly.
Topic of the Week
Good Luck Finding a Bicycle This Summer
Of all the money spent by consumers in the United States, 64% goes to spending on services. Although spending here is typically resilient, even in a recession, March and April both saw steep declines, which left services outlays nearly 20% below the February peak. Services ticked up in May but have a long way to go.
Goods Spending Is Coming Back Fast
The rest of consumer spending (36%) goes toward goods purchases with a split between durable and non-durable goods—those items with a shorter-lifespan like food and gasoline. Non-durables have held up in this cycle as grocery store spending helped propel non-durable goods spending to a record high in March.
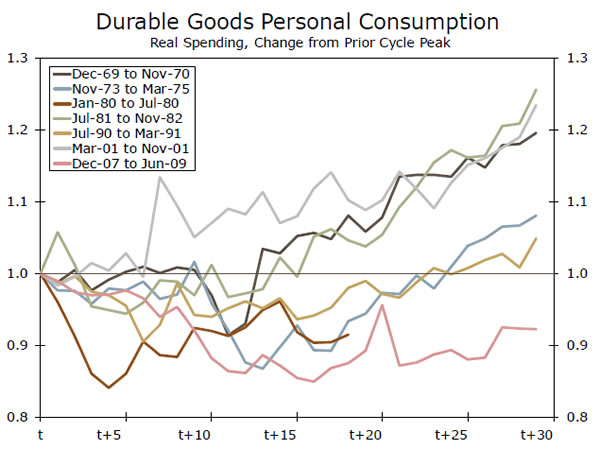
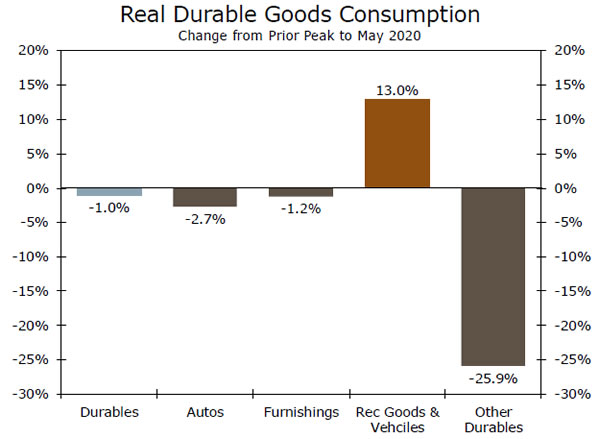
Durables spending is typically where you often see the downside in consumer spending during recession, although the extent of decline and the time it takes to fully recover varies considerably (top chart). Real durable goods spending rose 29% in May and that surge puts the level of durable goods only 1% below its’ January peak. One key factor in the resurgence has come from an unlikely place.
What Do You Like to Do for Recreation?
You do not typically see spending on recreational goods driving consumer spending during a recession, but it is now. The category “recreational goods and vehicles” is 13% higher than its February peak. Almost half of the increase in this category comes from computers and other information processing equipment as homebound workers equip the home office—so much for recreation. But spending on sporting equipment is way above its January peak as households in lockdown have been buying up bikes, swing sets, basketball hoops and trampolines. With flying and hotel stays losing their luster, RV sales jumped nearly $10 billion in May, but this category remains about $2 billion off its prior peak.
Equipping the home office does not have to happen twice, and once the hoop is up, it is there for years. For now, a surge in recreational goods has helped lift spending.


