
U.S. Highlights
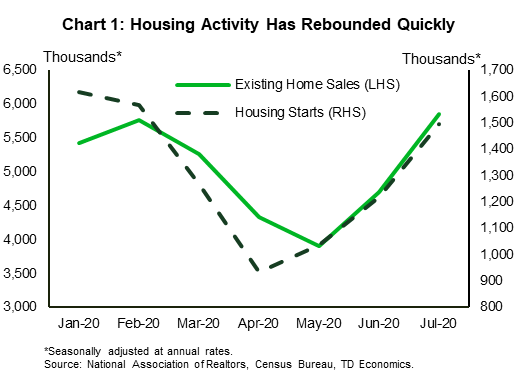
- The housing market continues to exceed expectations. Existing home sales and starts rose by 24.7% m/m and 22.6%, respectfully in July. Existing home sales are now 8% above January levels while starts are 7% below the pre-pandemic peak.
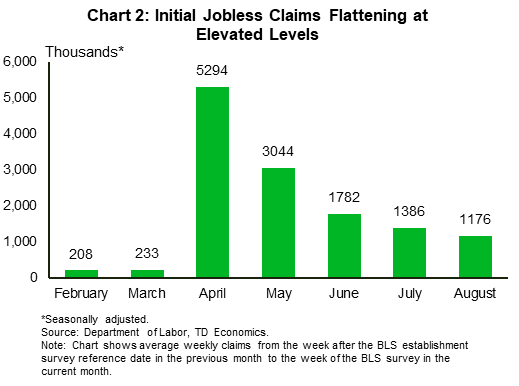
- The labor market recovery, meanwhile, appears to be losing steam. Initial and continuing jobless claims are settling at high levels suggesting more modest job gains in August compared to previous months.
- The Federal Reserve is wrapping up its comprehensive monetary policy framework review. Chairman Powell will provide an update next week at the Jackson Hole Symposium.
Canadian Highlights
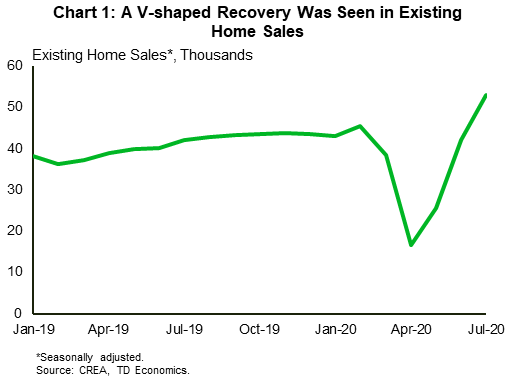
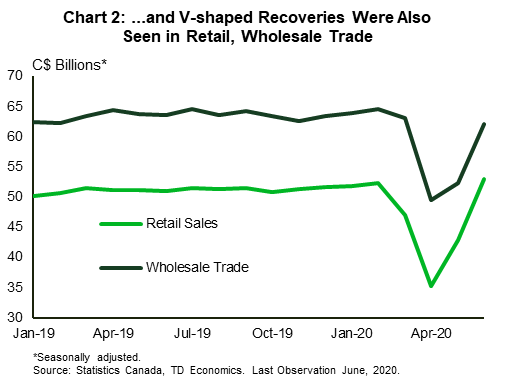
- Data releases were broadly positive this week, with existing home sales (July) and retail sales (June) both posting strong, v-shaped recoveries.
- Inflation was soft in July, reinforcing the Bank of Canada’s expectations and serving as a good reminder of sizeable economic slack, despite the aforementioned snap-back in some indicators.
- Developments in Ottawa were front and center, with newly-appointed Finance Minister Chrystia Freeland announcing a suite of new income support measures as it transitions away from CERB.
U.S. – Housing Market Rebound Continues
It was a volatile week for financial markets this week as the S&P500 briefly touched record highs before tumbling back down on Wednesday’s release of the Federal Reserve’s July meeting minutes. Since then, markets have made up some ground and at the time of writing, the S&P was a tad higher than close last week.
On the economic data front, housing activity continued to exceed expectations. Both housing starts and existing home sales trounced market forecasts in July, rising by 22.6% and 24.7% month-on-month, respectfully. Starts are now just 7% below their pre-pandemic peak (January), while existing home sales are 8% above January levels (Chart 1).
The housing market has been a bright spot for the U.S. economy during this pandemic. Record-low mortgage rates have had a magnetic pull on prospective buyers, especially millennials who have held-off purchasing a home due to affordability constraints (see report). This has given homebuilders the confidence to resume construction at extraordinary speed.
Looking ahead, the housing outlook depends on the labor market recovery. Prospective buyers will need the income to take the plunge into homeownership, but a wobbling labor market could delay their plans.
Worryingly, the labor market recovery appears to be losing steam. Initial jobless claims data released for the week ending on August 15th rose to 1.1 million claims, flattening at a level almost one million higher than in pre-pandemic months (Chart 2). Likewise, overall continuing claims are also stabilizing around the 28 million mark. Taken together, these indicators suggest employment gains slowed in August compared to May, June or July.
With the labor market hitting speed bumps, the onus is on policymakers to provide additional support to households and businesses that are struggling due to the pandemic. Congress has been deadlocked on the next set of fiscal measures, with the Democrats pushing for more income support and Republicans arguing for less. It is clear, however, that more aid will be needed to avoid deepening the economic crisis.
This sentiment was the key discussion point among Federal Open Market Committee (FOMC) members. As noted in the minutes from July, participants zeroed in on the importance of fiscal policy in holding up spending, investment, and the labor market until a vaccine or effective treatment is found. A significant downside risk to the economic outlook is if fiscal support disappoints. At the current juncture, this seems to be a very real possibility.
In terms of monetary policy, several FOMC participants agreed that without convincing fiscal support, more stimulus may be needed to promote the economic recovery. They debated the use of forward guidance and yield curve control, with the former getting more attention among members. Fed Chairman Jerome Powell will likely provide more insight into these issues as well the broader wrap up of the comprehensive monetary policy framework review next week at the Fed’s annual Jackson Hole Symposium.
Canada – Ramping Up Fiscal Support
Financial markets were mixed this week, with sentiment alternating on U.S. stimulus talks, China-U.S. trade comments, and virus developments. This left the S&P/TSX Composite almost flat (-0.2%) on the week, as of the time of writing. Turning to oil markets, this week saw another weekly inventory draw in the U.S. and a stay-the-course OPEC+ meeting that reinforced strong output compliance and a continuation of supply curtailments. That said, WTI oil prices still edged down modestly on the week. Despite the notable rebalancing seen throughout the summer, a further leg up in prices hinges on continued signs of a sustained recovery in demand and drawdown in inventories.
Developments in Ottawa were front and center, with newly-appointed Finance Minister Chrystia Freeland announcing a suite of new fiscal policy measures. These included an extension of the Canada Emergency Response Benefit (CERB) for another month, and an easing of qualification requirements for the employment insurance (EI) program. Importantly, they also included new income support programs aimed at those self-employed and caregivers (the Canada Recovery Benefit and the Canada Recovery Caregiving Benefit, respectively). This week’s announcements are expected to cost an additional $37 billion.
Largely underpinned by v-shaped recoveries in consumer and household indicators, this week’s data releases served to reaffirm the better than expected picture heading into Q3. Kicking off the release schedule was a 26% m/m increase in July’s existing home sales, which left unit sales levels at all-time highs (Chart 1). A slower increase in listings exacerbated pre-existing market tightness, leaving prices also up 9.4% on the month. Market tightness and past drivers of strong demand are still working their way through the system, but one key downside risk to housing demand is the decline in population growth that is resulting from a pandemic-driven reduction in immigration. A similarly strong, v-shaped bounce-back was seen in June’s retail sales (Chart 2), which rose 23.7% (m/m) and now rest 1.3% above pre-pandemic (February) levels. Separately, wholesale trade also recorded an encouraging 18.5% rebound, but remains around 3.9% below pre-pandemic levels.
Notwithstanding these positive surprises, one fly in the ointment in this week’s data was the broad-based weakness seen in July’s CPI inflation reading, which fell back to 0.1% (year/year). The average of the three core inflation measures also slipped to 1.6% y/y. The flatlining of inflation suggests that underlying slack remains in the economy despite the strong recoveries seen across some consumer and household categories.
All told, the broadly positive data releases this week are a welcome sign, but should not be extrapolated heading into the autumn. Indeed, some higher frequency indicators are starting to show signs of plateauing, and Statistics Canada’s preliminary estimate of a 0.7% increase in July’s retail sales is a case in point. As we transition away from CERB and run into a potential slowdown in job growth, this week’s newly-announced income supports should serve as a backstop until evidence of a more sustained firming in the economic recovery arrives.
U.S: Upcoming Key Economic Releases
U.S. PCE Report – July*
Release Date: August 27, 2020
Previous: PCE deflator: 0.4% m/m, 0.8% y/y; core PCE deflator: 0.2% m/m, 0.9% y/y
TD Forecast: PCE deflator: 0.4% m/m, 0.9% y/y; core PCE deflator: 0.4% m/m, 1.2% y/y
Consensus: PCE deflator: 0.4% m/m, 1.0% y/y; core PCE deflator: 0.5% m/m, 1.2% y/y
Consumer spending likely slowed after huge gains in May and June, but it was probably still up solidly. With a continued gain in the month, we estimate real spending was -2.6% year-on-year (y/y), still down from +2.7% in February (pre-COVID) but up from -4.5% in June and -16.3% at the low in April. The strong recovery has been helped by supplemental unemployment benefits and stimulus payments. We estimate real disposable income was +7.5% y/y in July, down from +8.1% in June and +11.5% in Q2 as a whole, but still up from +2.0% in February.
The PCE price index likely rose sharply in July, and not just due to gasoline prices. Core prices were likely boosted by an unwinding of some of the earlier plunge in travel-related prices. That said, the net result of recent swings appears to be significant slowing. We estimate core prices were up 1.2% y/y in July, up from 0.9% in June but still down from 1.9% in February (pre-COVID).

Canada: Upcoming Key Economic Releases
Canadian Real GDP – June and Q2*
Release Date: August 28, 2020
Previous: -8.2% q/q
TD Forecast: -36.3% q/q
Consensus: -38.9% q/q
It is going to be a bad one. Despite the upward trajectory of more recent data, the huge back-to-back drops in activity in March and April leave second quarter GDP on track for a record decline. Consistent with Statistics Canada’s nowcasts, we expect a near-40% annualized contraction. The pandemic’s impact is likely to be felt across nearly all categories, but household consumption (-45.6%) is likely to lead the decline given the nature of the pandemic and the size of the category. A larger decline in investment (-53.3%) is anticipated but given its smaller share of the economy it will have less of an impact on overall activity. The good news is that, as implied by the monthly GDP profile, April, and the second quarter, are likely to have marked the worst of the pandemic’s impact on the economy.
On a brighter note, the Canadian economy is set to end Q2 on a strong note with industry-level GDP rising by 6.7% m/m in June, slightly above early StatCan estimates for a 5.0% advance and an acceleration from the 4.5% increase in May. Data for June has been broadly upbeat, with record increases across manufacturing, wholesale, retail, and existing home sales. Energy and utilities should see a more modest performance within the goods-producing sector, while labour market data hints at a sharp bounce back for heavily affected industries such as accommodation/food services and admin/support services. A 6.5% increase will set another record for monthly GDP growth and provide solid momentum into the next quarter.


