
Summary
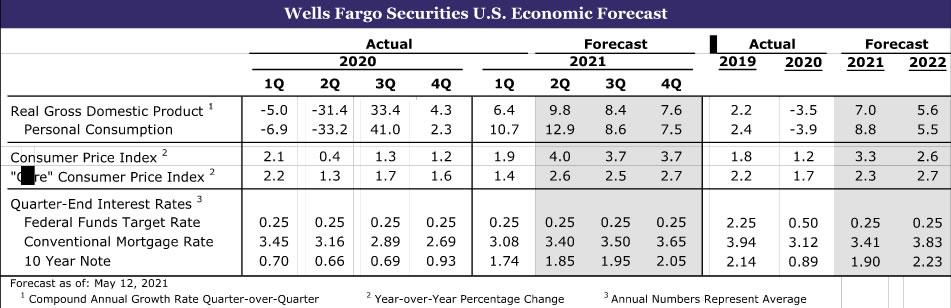
United States: Reopening Comes with a Steep Price Tag
- The leap in consumer prices this week laid bare that challenges in meeting soaring demand come with a cost.
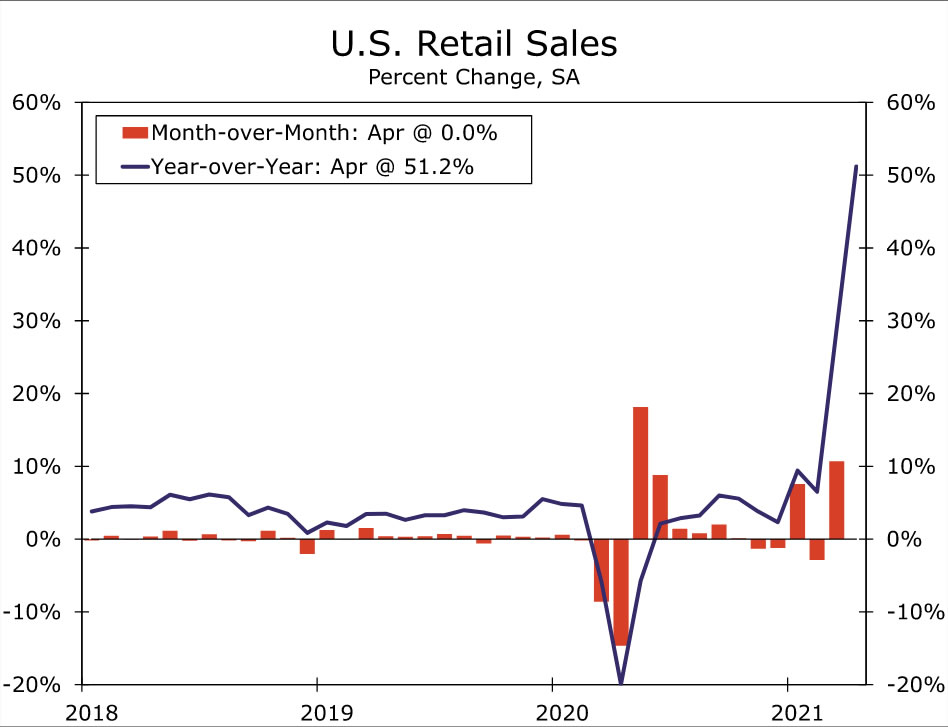
- There were few signs of the mismatch between supply and demand beginning to come back into balance. April retail sales were unchanged following the second-largest monthly increase on record in the prior month. Meanwhile, difficulty finding workers appeared to grow more acute, with job openings and the share of small businesses with a job hard to fill soaring to record highs.
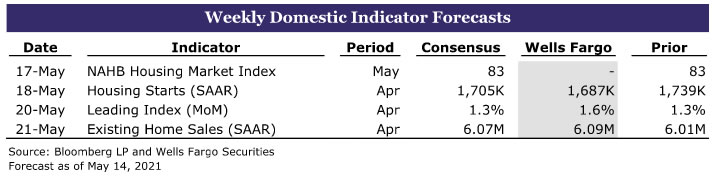
- Next week: Housing Starts (Tuesday), Leading Economic Index (Thursday), Existing Home Sales (Friday)
International: U.K. Economy Getting Back on Track
- U.K. March GDP data showed the economy starting to get back on track as GDP rose 2.1% month-over-month, reflecting gains in both services and industrial output. That said, U.K. GDP did fall for Q1 overall, with the decline concentrated in private demand, and government demand showing relative resilience.
- Next week: China Retail Sales & Industrial Output (Monday), Japan GDP (Tuesday), Eurozone PMIs (Friday)
Interest Rate Watch: Inflation Expectations and the Fed
- CPI inflation in April turned out to be significantly higher than most analysts had expected. Although one data point does not a trend make, many market participants expect that inflation will be higher in the coming years than it has been in recent history.
Topic of the Week: Fuel on the Fire
- In the latest surprise to price pressures, the cyber attack forcing the shutdown of the Colonial Pipeline over the weekend sent gas prices soaring this week and many motorists scrambling to top off.
U.S. Review
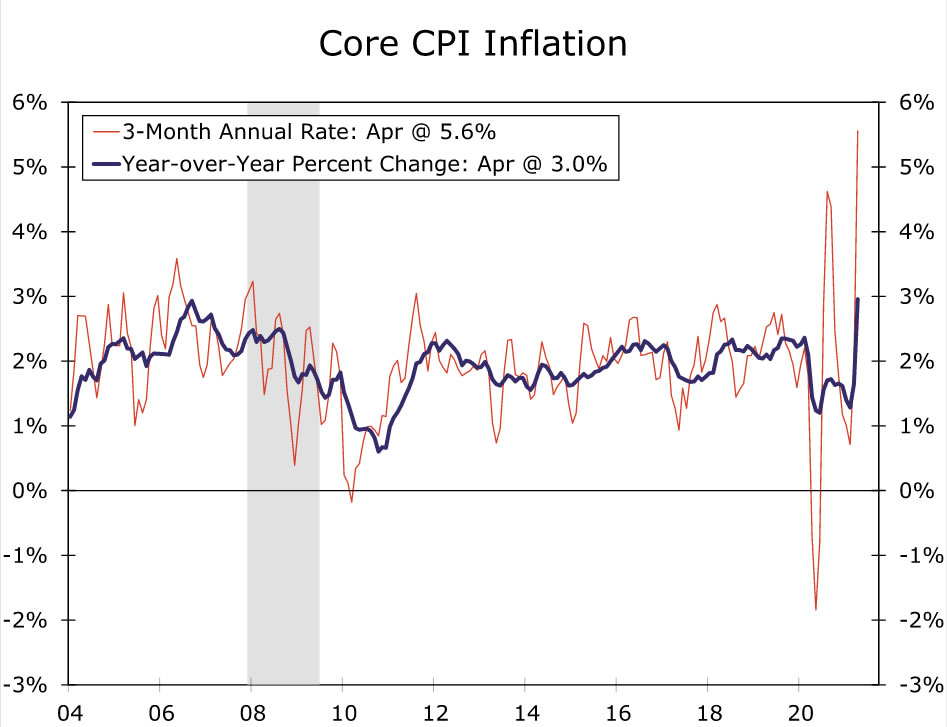
Inflation Has Arrived
The message from last week’s data was that the extraordinary pace of economic growth could be even stronger right now if supply could actually meet the tremendous onslaught of demand. This week’s data laid bare that such an imbalance comes at a cost: inflation. The Consumer Price Index jumped 0.8% in April and is up 4.2% over the past year. Excluding the volatile food and energy components, prices soared 0.9%—three times the amount expected and the largest monthly increase since 1981. Over the past three months, core CPI is rising at a 5.6% annualized pace, indicating price growth has picked up materially over just the past few months.
Booming demand is giving pricing power to businesses, and allowing them to pass on higher input costs. Nowhere was this more evident in April than in the auto sector. Semiconductor shortages have hit the sector particularly hard, leading to cutbacks in new production, a booming used car market and an inability for rental car companies to replace fleets. A 10.0% monthly jump in used car and truck prices alone accounted for more than one-third of April’s CPI increase. But prices for discretionary services largely forgone in the pandemic, like air travel, hotels and sporting events, also leapt. More small businesses reported raising prices in April than at any point since 1981.
Consumers’ inflation expectations are rising in response, with the University of Michigan’s measures of both short- and long-term expectations leaping to the highest levels since the spring of 2011 in the preliminary May report. As we discuss in our Interest Rate Watch section, inflation expectations affect actual inflation, and could buoy price growth even after current supply constraints fade.
There does not appear to be much letup in sight. U.S. producer prices rose 0.6% in April and are up 6.2% year-over-year. Costs for energy and “core” input goods eased in April, but food-related input costs picked up. Notably, service-related inputs, particularly for transportation, advanced more quickly in April. Staffing challenges seem to be becoming increasingly acute as well, implying upward pressure on labor costs at the same time businesses are paying more for parts and materials. Job openings catapulted to a record high of 8.1 million in March, while the share of small businesses reporting at least one position as hard to fill rose to the highest in the series’ nearly 50-year history.
However, there were small hints that demand for goods, at least outside the auto sector, and supply are taking baby steps toward becoming more balanced, even if supply constraints are likely to linger for months to come. Total retail sales were flat in April following an upwardly revised 10.7% surge in March that was fueled by a third round of stimulus checks. Nominal spending on autos rose 2.9% as sales matched a three and a half year high and prices jumped. The 3.0% rise in spending at food & drinking places as consumers increasingly venture out offset declines in other segments. But control group sales, which exclude autos, gas, building materials and food services, fell more than expected and suggest goods spending is starting to be pared back in favor of services. The pullback in nominal spending is slightly worse than expected considering April’s jump in prices.
Excluding food services, retail sales are still up an impressive 21% above their pre-COVID level. That stands in sharp contrast to the production of consumer goods. Consumer goods production inched up 0.3% in April, but is flat relative to its February 2020 level. While some of the gap between sales and production has been filled by imports, manufacturing globally continues to struggle to keep up. U.S. manufacturing production in April rose 0.4%, despite a 4.3% decline in motor vehicles and parts production as the semiconductor shortage continues to bite. Yet, the Fed’s release noted factory output was boosted by plants damaged by February’s severe winter weather returning to operation in April, which should help alleviate some of the current supply chain difficulties in the coming months.
U.S. Outlook
Housing Starts • Tuesday
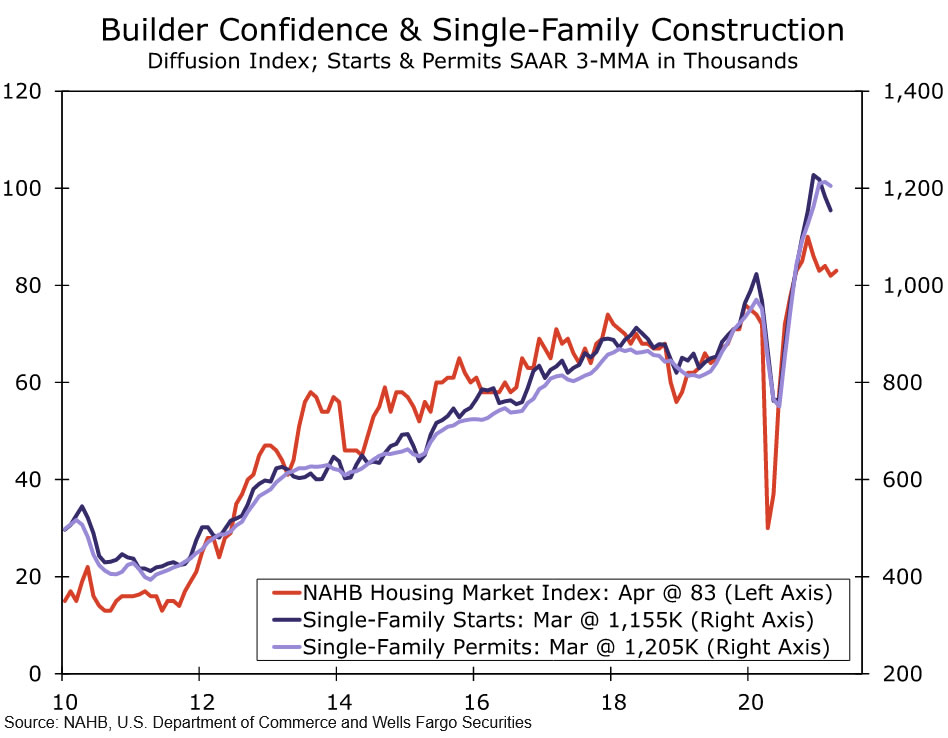
During March, new residential construction rebounded from the weather-related weakness the month prior. Total housing starts jumped over 19% to a 1.74-million unit pace, which marks the fastest pace in more than a decade. Single-family starts rose 15.3% during the month, and multifamily starts surged 30.8%. Home building clearly has a lot of underlying momentum currently. Starts through the first three months of 2021 are running 8.6% ahead of their year-ago pace.
Home builders are ramping up construction to meet strong demand and to bolster low for-sale home inventories. Sustaining the rapid pace of construction seen in March will be challenging, however, considering shortages of lots, labor and building materials. Sky-rocketing building material prices (e.g. lumber) present some downside risk for the months ahead. Bearing that in mind, we expect housing starts cooled off a bit in April. Still, the NAHB/Wells Fargo Housing Market Index (HMI) remains elevated and rose one point to 83 in April. The recent strength in the HMI indicates that new residential construction will likely continue at a fairly robust pace, despite supply-side headwinds.
Leading Economic Index • Thursday
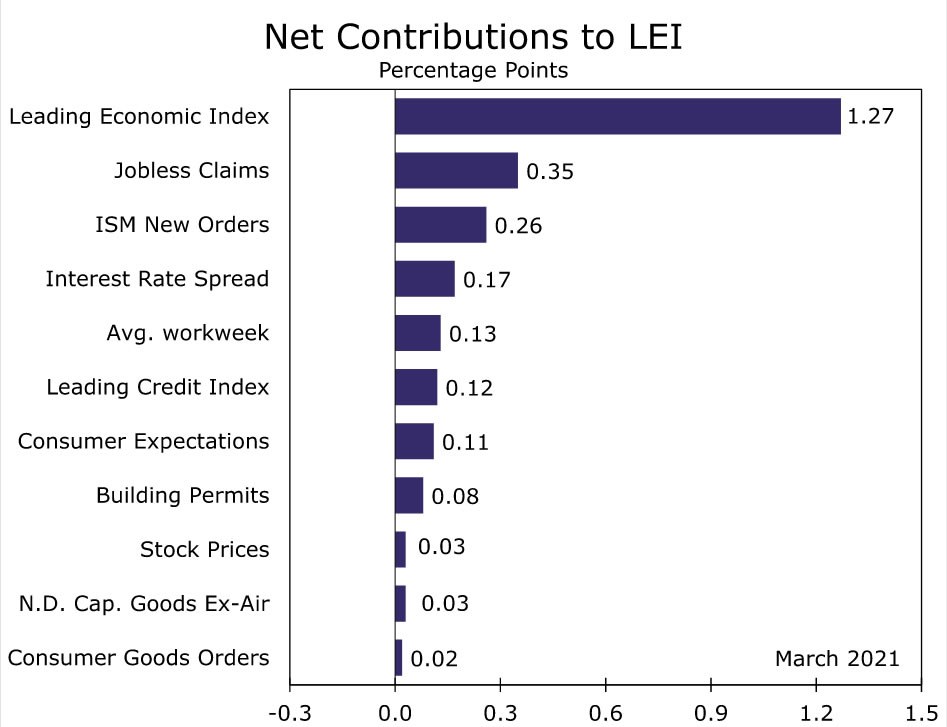
The Leading Economic Index (LEI) jumped 1.3% in March, a gain that was consistent with the strong results seen across a wide array of other indicators during the month. The monthly rise in the LEI was broad-based, with all 10 index components registering a substantial improvement.
Looking ahead, the LEI appears poised for another gain in April. Jobless claims downshifted in April, while nondefense capital goods orders excluding aircraft rose modestly. Retail sales were flat during April, but consumer confidence surged during the month. Consumer confidence rising to a pandemic-era high points to another improvement in the consumer expectations component. Furthermore, residential construction continues to be strong, and we expect building permits gained during the month. Overall, the LEI should continue to climb in April as more economic indicators reflect the revival in economic activity currently taking place.
Existing Home Sales • Friday
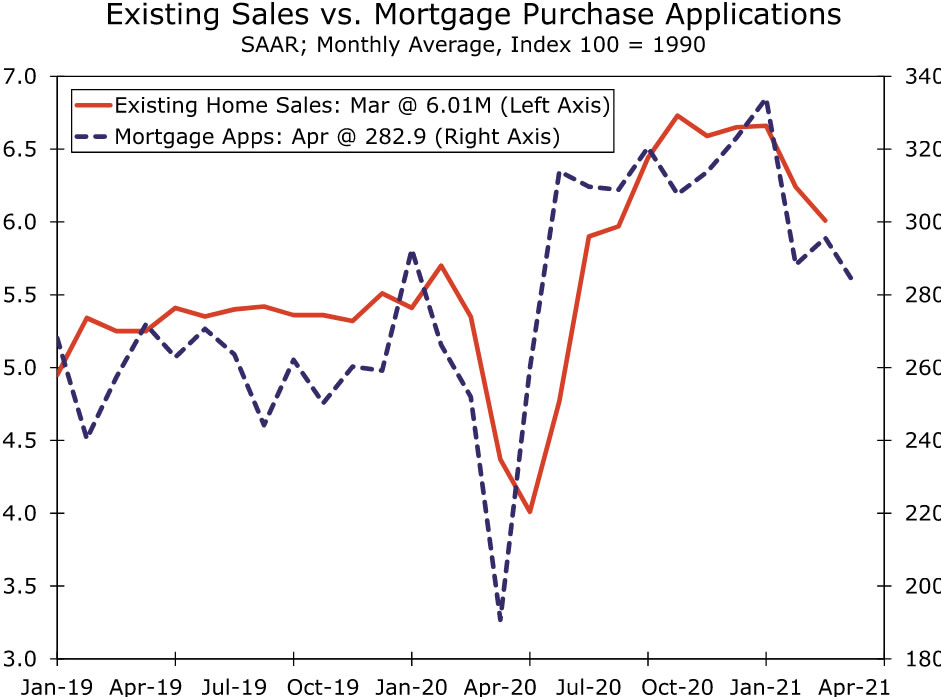
Resales slipped in March to a still-strong 6.01-million unit pace. The 3.7% monthly decline was larger than expected and occurred one month after severe winter weather disrupted sales activity in many parts of the country. Existing sales would have been higher if there were more homes for sale. Inventories rose modestly in March, but still remain near historic lows. The lack of inventory is putting upward pressure on home prices. The median price of an existing home soared over 17% year-over-year in March. Despite rising affordability concerns, several signs point to the pace of existing sales picking up slightly in April. During March, mortgage applications for purchase slightly improved relative to February. What’s more, the pending home sales index edged higher in March, which indicates that April contract closings moved in a similar direction.
International Review
U.K. Economy Getting Back on Track
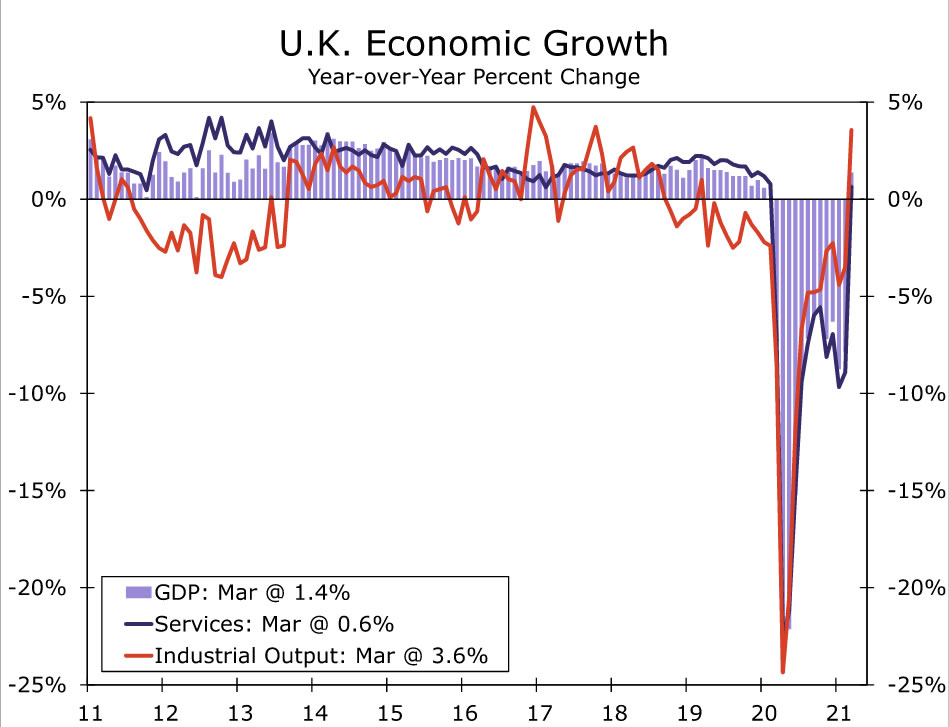
The March GDP figures from the United Kingdom showed relatively sturdy gains, indicating an economy that is getting back of track as the government carefully manages the reopening of the economy following a surge in COVID cases earlier this year. March GDP rose 2.1% month-over-month, more than the 1.5% gain forecast by the consensus. By sector, activity in the important services sector rose 1.9%, industrial output rose 1.8% and construction output jumped 5.8%. With March 2020 having been a very bad month for the U.K. economy and March this year being a much better month for the economy, year-over-year growth for services activity, industrial output and overall GDP all returned to positive territory.
The news for Q1 U.K. GDP overall was not quite as upbeat. First quarter GDP fell 1.5% quarter-over-quarter, admittedly a smaller decline than had initially been feared. That said, private sector demand was tepid in the first quarter as consumer spending fell 3.9% and business investment fell 11.9%. As a result, our estimate of final private domestic demand fell 4.5% quarter-over-quarter in Q1, with much of the relative strength instead stemming from government demand.
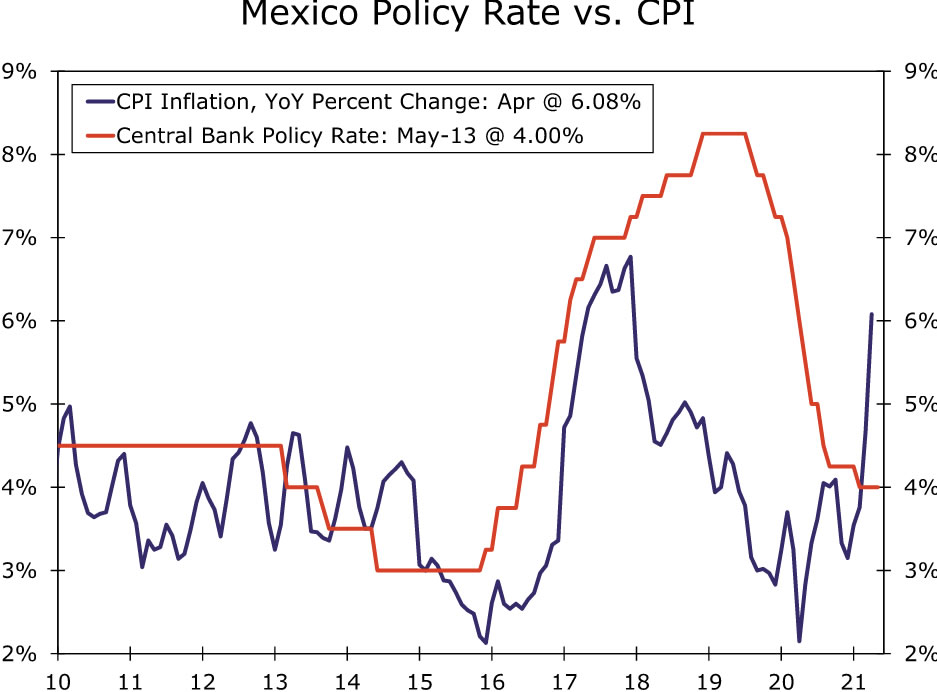
The Central Bank of Mexico and Central Bank of Chile both announced monetary policy decisions this week, keeping policy interest rates steady at 4.00% and 0.50%, respectively. In Mexico, the central bank said the economic environment was still uncertain and that economic slack remained. However, it saw growth as somewhat stronger, with the risks around growth balanced. With respect to inflation, given the recent quickening in prices, the Bank of Mexico acknowledged that inflation risks were tilted to the upside. The cental bank said given “the recent shocks that have affected inflation, it is necessary for the adjustment in relative prices to take place in an orderly manner,” and that it expects inflation converge to target in Q2-2022. Despite the reasonably balanced statement from the Bank of Mexico, given the recent spike of inflation, for now, we still expect the central bank to raise interest rates at some point.
In Chile, the central bank kept its policy interest rate at a record-low 0.50%, while the accompanying statement did not suggest imminent monetary tightening. The central bank said economic prospects had improved, but for inflation to converge to target, monetary stimulus needs to be highly expansionary. The central bank also said its policy rate would be “kept at its minimum of 0.5% for as long as it is deemed necessary for the recovery of the economy to take hold.” Finally, in data releases from Brazil, where the central bank hiked interest rates last week, April CPI inflation quickened further to 6.76% year-over-year. March economic activity fell 1.6% month-over-month, although that decline was much smaller than the consensus forecast.
International Outlook
China Retail Sales and Industrial Output • Monday
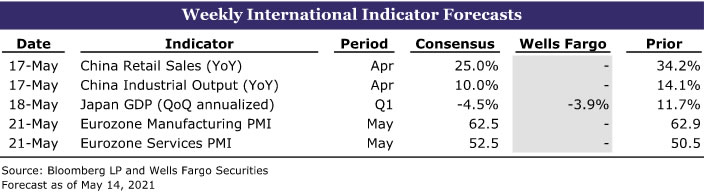
The underlying trend of the Chinese economy has been somewhat challenging to decipher this year. The severe weakness seen in early 2020 has been replaced by overall steadier trends in early 2021, leading to a surge in year-over-year growth rates. In addition, confidence surveys have been up-and-down during the early part of 2021 reflecting, in part, renewed localized outbreaks of COVID cases.
While April activity is unlikely to provide a completely clean read on the economy, it may begin to offer a better underlying sense of how the economy is faring. Growth in April activity is expected to slow, though still remain at an impressive pace by international standards. The consensus forecast is for April retail sales to slow to 25.0% year-over-year (from 34.2% in March), while growth in industrial output is forecast to slow to 10.0% (from 14.1% in March).
Japan GDP • Tuesday
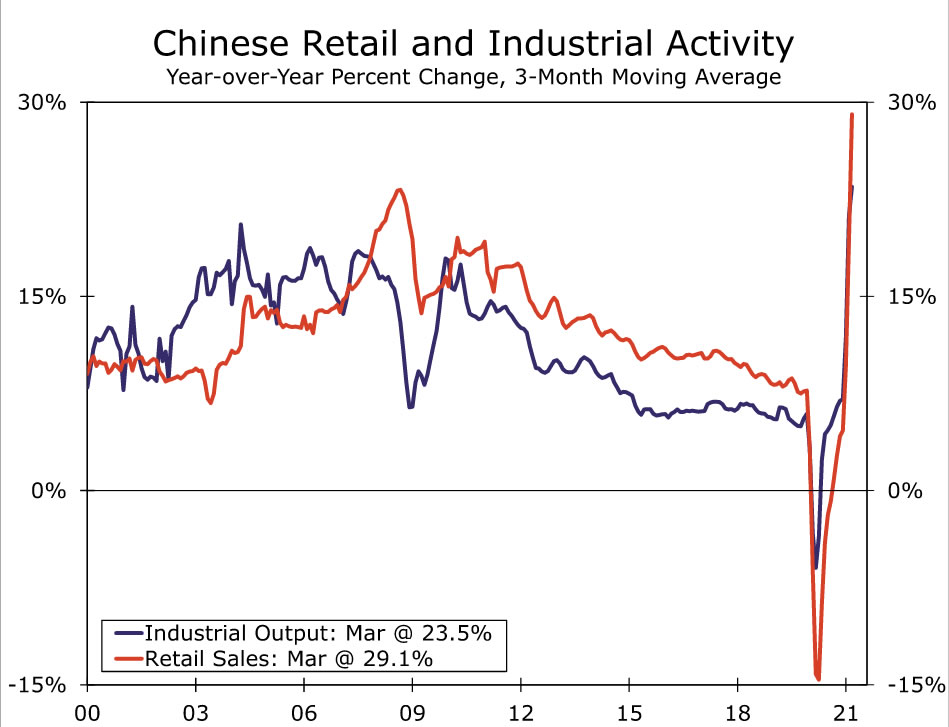
It has been a difficult start to 2021 for Japan’s economy as a renewed rise in COVID cases, and associated restrictions, have weighed on activity. Moreover, those COVID concerns have continued to linger with a new state of emergency declared for the Tokyo area and some surrounding regions declared in late April, and now extended through late May. It is against this backdrop that Japan’s Q1 GDP is expected to show a renewed contraction. We forecast Q1 GDP to decline at a 3.9% quarter-over-quarter annualized rate, while the consensus is for an even faster 4.5% pace of decline.
In terms of the breakdown, the consensus forecast is for consumer spending to be especially weak, with a decline of 1.9% quarter-over-quarter (not annualized) expected. Business investment is expected to increase, while a modest positive contribution to Q1 GDP from inventories is expected to be offset by a modest negative contribution from net exports.
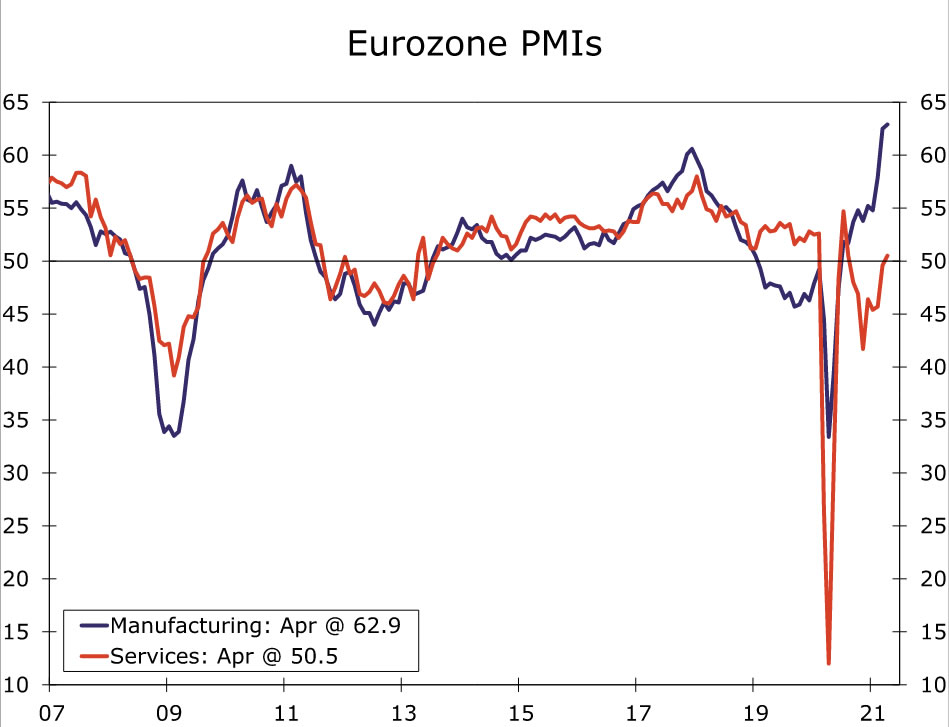
Eurozone PMIs • Friday
The release of the Eurozone May manufacturing and services PMIs are expected to indicate an economic recovery that is gradually gaining pace. After a rise in COVID cases around the turn of the year and an initially slow vaccination rollout, the services PMI in particular will be closely watched. As the pace of vaccinations has improved, it has allowed for some progress in reopening the retail and other service sectors of the economy. As a result, the May services PMI is forecast to rise to 52.5, which would be the highest reading since July 2020. The manufacturing sector has performed better during the early stages of the post-COVID rebound. Thus, although May manufacturing is expected to ease to 62.5, that would still be a relatively high level by historical standards.
In terms of the major Eurozone economies, May German and French PMIs are also published next week. Of note, the German services PMI is forecast to rise to 52.0, while the French services PMI is also expected to rise, to 53.0. (Return to Summary)
Interest Rate Watch
Inflation Expectations and the Fed
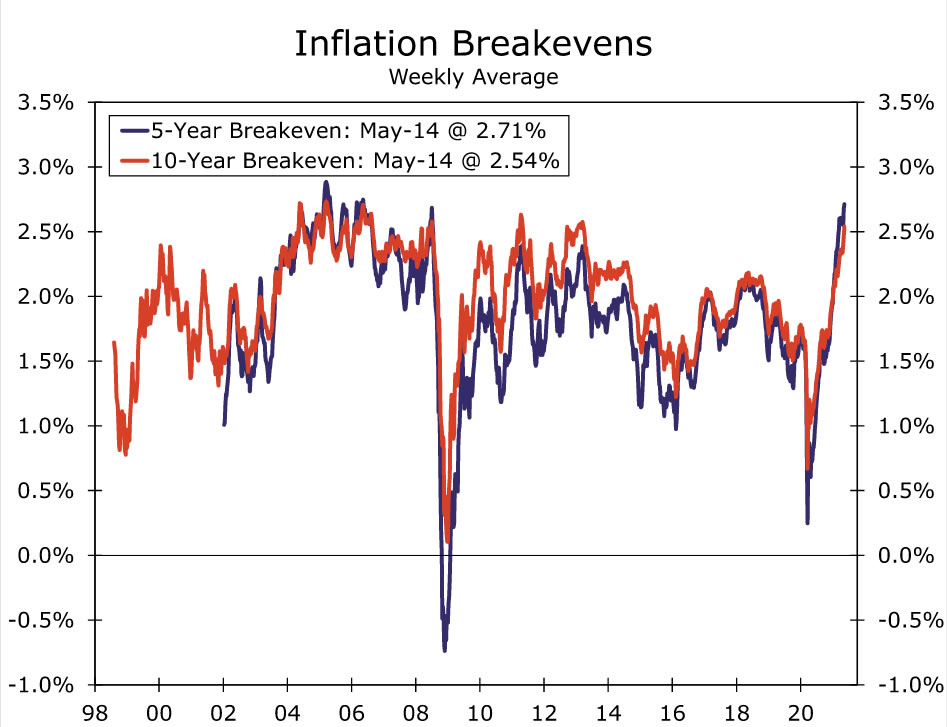
CPI inflation in April turned out to be significantly higher than most analysts had expected. Although one data point does not a trend make, many market participants expect that inflation will be higher in the coming years than it has been in recent history. We can measure inflation expectations through so-called “breakevens,” which are the spreads between the yield on a U.S. Treasury security and the yield on an inflation-protected U.S. Treasury security (TIPS) of the same maturity. As of this writing, the yield on the five-year Treasury security is 0.82%, and the yield on the five-year inflation-protected Treasury security is -1.89%. The difference between these two yields, 271 bps, suggests that fixed income investors expect inflation to average roughly 2.7% per annum over the next five years (see graph). CPI inflation has not averaged 2.7% per annum since 2004-2008.
Policymakers at the Federal Reserve do not seem to be overly concerned, at least at present, about the recent rise in inflation expectations and the actual rate of inflation. In a speech this week before the April CPI data release, Fed Governor Brainard said that any increase in inflation should be largely “transitory.” Vice Chair Clarida, who spoke after the data printed, also used the word “transitory” when discussing the outlook for inflation.
Statistical analysis suggests that inflation expectations have an important bearing on the actual rate of inflation. So, the recent rise in inflation expectations is exactly what the Federal Reserve is attempting to engineer. Inflation has consistently undershot the Fed’s target of 2% per annum over the past decade. Fed officials believe that they will have more success achieving their long-run 2% inflation target if they can lift inflation expectations. They are even willing to tolerate an inflation rate that “moderately” exceeds 2% “for some time,” so that inflation averages 2% over a number of years.
Of course, hitting an inflation target a few years in the future is not an exact science. There is a risk that inflation could actually turn out to be significantly higher than Fed officials expect and desire over the next few years. But for now, monetary policymakers seem to be relaxed about the recent run-up in inflation and inflation expectations. Bottom line: Don’t look for the Federal Reserve to begin removing monetary accommodation anytime soon. We continue to believe that the FOMC will maintain its target range for the fed funds rate, which currently sits at 0.00% to 0.25%, through at least the end of next year.
Topic of the Week
Fuel on the Fire
In the latest surprise to price pressures, the cyber attack forcing the shutdown of the Colonial Pipeline over the weekend sent gas prices soaring this week and many motorists scrambling to top off. The pipeline provides 45% of the fuel used on the East Coast, so the disruption has major short-term consequences for these areas, but the key word there is short.
By Wednesday evening, the pipeline’s owners signaled that it would resume operations and gas is again flowing in some of the places that had run dry earlier in the week. This is not the first time the country experienced a restricted supply from an unexpected shutdown. After Hurricane Katrina, regular gas prices surged 17.4% (around 40 cents) in the week following the natural disaster’s landfall in Louisiana. However, fast-forward about two months, and gas prices were already back down to where they were before the hurricane. It is likely that the price effects from this event will also be short-lived, especially with many states taking extra precautions against price gouging.
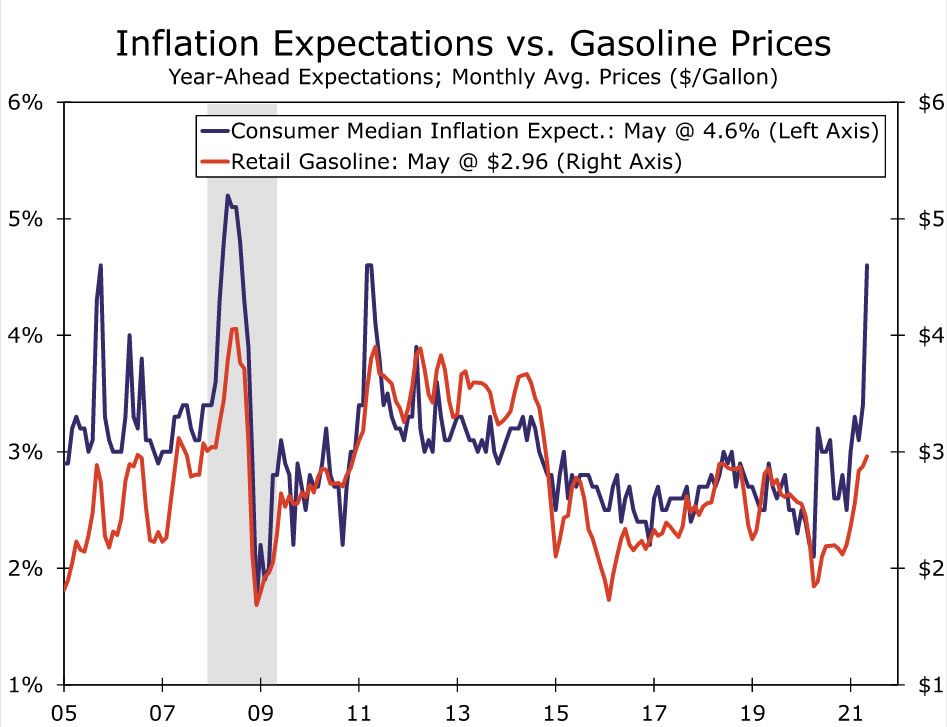
With that in mind, although fuel prices did climb above the psychologically significant, seven-year high of $3/gallon; it was not only because of this week’s disruption. Pressures have been building on trend ever since prices plummeted last spring as consumers stayed at home and did not travel for leisure or business. As activity has picked up, demand has also been a considerable factor alongside supply. As vaccinations have ramped up, so too has the traffic on the nation’s roads and motorists have been making more regular stops for gas.
Airport traffic has picked up, too. The seven-day moving average of airport passengers is now only down 34% from the same timeframe in 2019 compared to 62% at the start of the year. April CPI data showed prices for used trucks surged 10% in the month of April alone, which was a record, while car and truck rentals increased 16.2%.
Although the Colonial Pipeline disruption was temporary, it comes at a time when inflation is already top-of-mind and consumers and businesses are on high alert. The priced paid components for both the ISM manufacturing and services measures rose to their highest levels since 2008. Meanwhile, the NFIB survey reported the largest share of firms raising prices since 1981. For now, pain at the pump is likely to further feed into inflation expectations, particularly since fuel is a frequently bought item. For more insights as to what these rising inflation expectations may mean for the broader economy, please read our Interest Rate Watch.


