The price of crude oil declined slightly after the latest meeting by OPEC and its allies. The cartel decided to continue increasing monthly crude production by about 400k barrels. Before the meeting, some analysts were expecting that the cartel will slow the reduction because of the new Covid-19 variant. In an unusual move, the cartel added that its meeting would remain in session. This means that members will continue watching developments in the industry and intervene if needed. The OPEC decision came two weeks after the US agreed to release its strategic petroleum reserves.
American stocks rose as investors shrugged the new virus. The Dow Jones and Nasdaq 100 index rose by more than 1%. This rally was likely because of a deal in the House of Representatives that will avert the government shut down until February 2018. It is unclear whether the Senate will agree to the deal. They also rose after a positive report by GlaxoSmithKline, which said that its anti-body treatment was effective against the Omicron in early lab testing. Shares of Grab, the giant Southeast Asian ride-hailing company declined by more than 10% after it went public.
The economic calendar will have some important events today. The most important will be the non-farm payroll (NFP) data from the United States. Analysts expect the data to show that the economy added more than 550k jobs in November while the unemployment rate fell to 4.5%. In Canada, the country’s statistics agency will also publish its latest employment numbers. In Europe, Eurostat will release the latest retail sales while in October. And in Turkey, the statistics agency will publish November’s inflation data. These numbers will be watched closely since the country’s central bank has slashed interest rates three times this year.
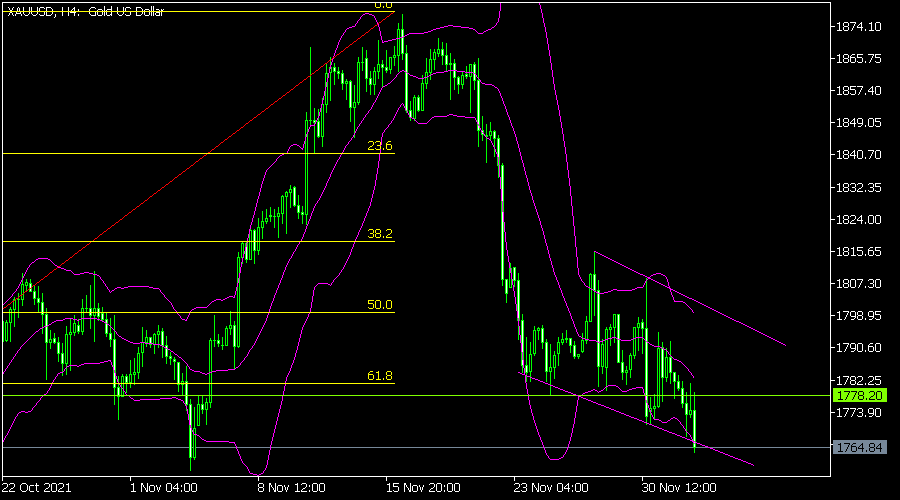
XAUUSD
The XAUUSD pair declined sharply ahead of the latest US jobs numbers. It is trading at 1,764, which was the lowest level since November 2. The pair managed to move below the lower side of the bearish flag pattern. It also managed to move below the 25-day moving average. The pair has also moved to the lower side of the Bollinger Bands. It also moved below the 61.8% Fibonacci retracement level. Therefore, the pair will likely keep falling with the next reference point being at 1,700.
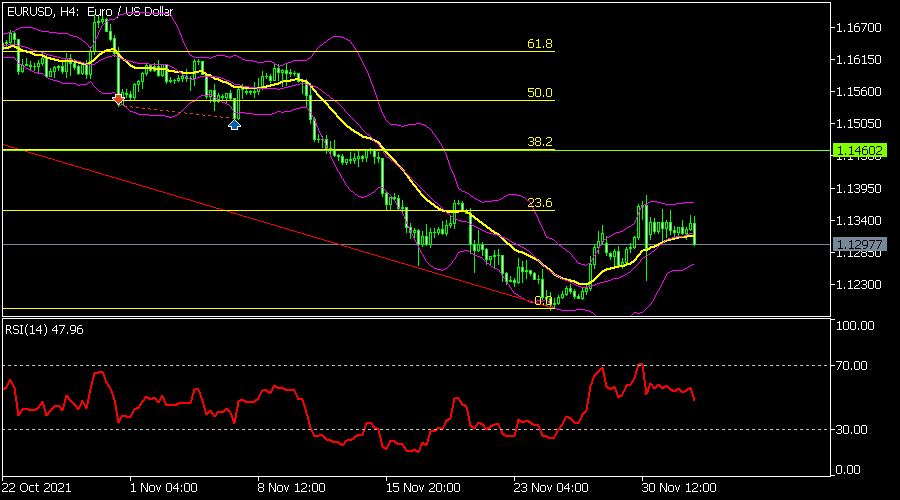
EURUSD
The EURUSD pair tilted lower ahead of the US nonfarm payroll numbers. The pair dropped to a low of 1.1300. On the four-hour chart, the pair is along with the 25-day moving average. It has also formed an inverted head and shoulders pattern. It is also slightly below the 61.8% Fibonacci retracement level. The Relative Strength Index (RSI) has also moved below the overbought level. Therefore, the pair will likely bounce back today.
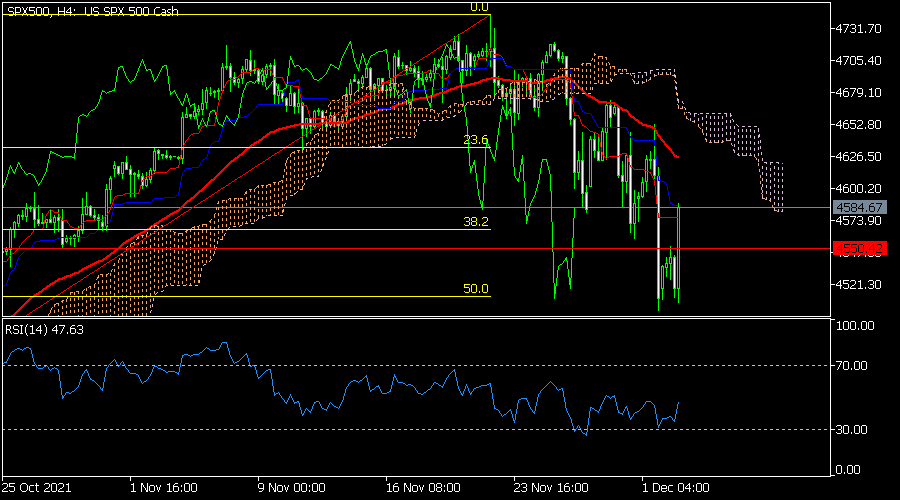
SPX500
The S&P 500 bounced back after the progress on government lockdown. The index rose to a high of $4585, which was higher than this week’s low of $4,500. On the four-hour chart, the index moved above the 38.2% Fibonacci retracement level. It is also below the Ichimoku cloud while the Relative Strength Index (RSI) has moved from the oversold level. Therefore, the index will likely keep rising today.