
The EUR/USD currency pair
Technical indicators of the currency pair:
Prev Open: 1.14581
Open: 1.14675
% chg. over the last day: +0.11
Day’s range: 1.14718 – 1.14828
52 wk range: 1.1214 – 1.2557
EUR/USD is showing an ambiguous technical picture. The trading instrument is in a sideways trend. Yesterday the EU published some weak economic reports. The volume of the industrial production lowered in Novermber by 1.7% while the investors expected the fall by 1.5%. The trading instrument is consolidating in the 1.14600-1.14900 range. You should open positions from the key levels.
The Economic News Feed for 15.01.2019:
Trading Balance Volume Reports (US) – 15:30 (GMT+2:00);
Manufacturer`s Price Index (US) – 15:30 (GMT+2:00).
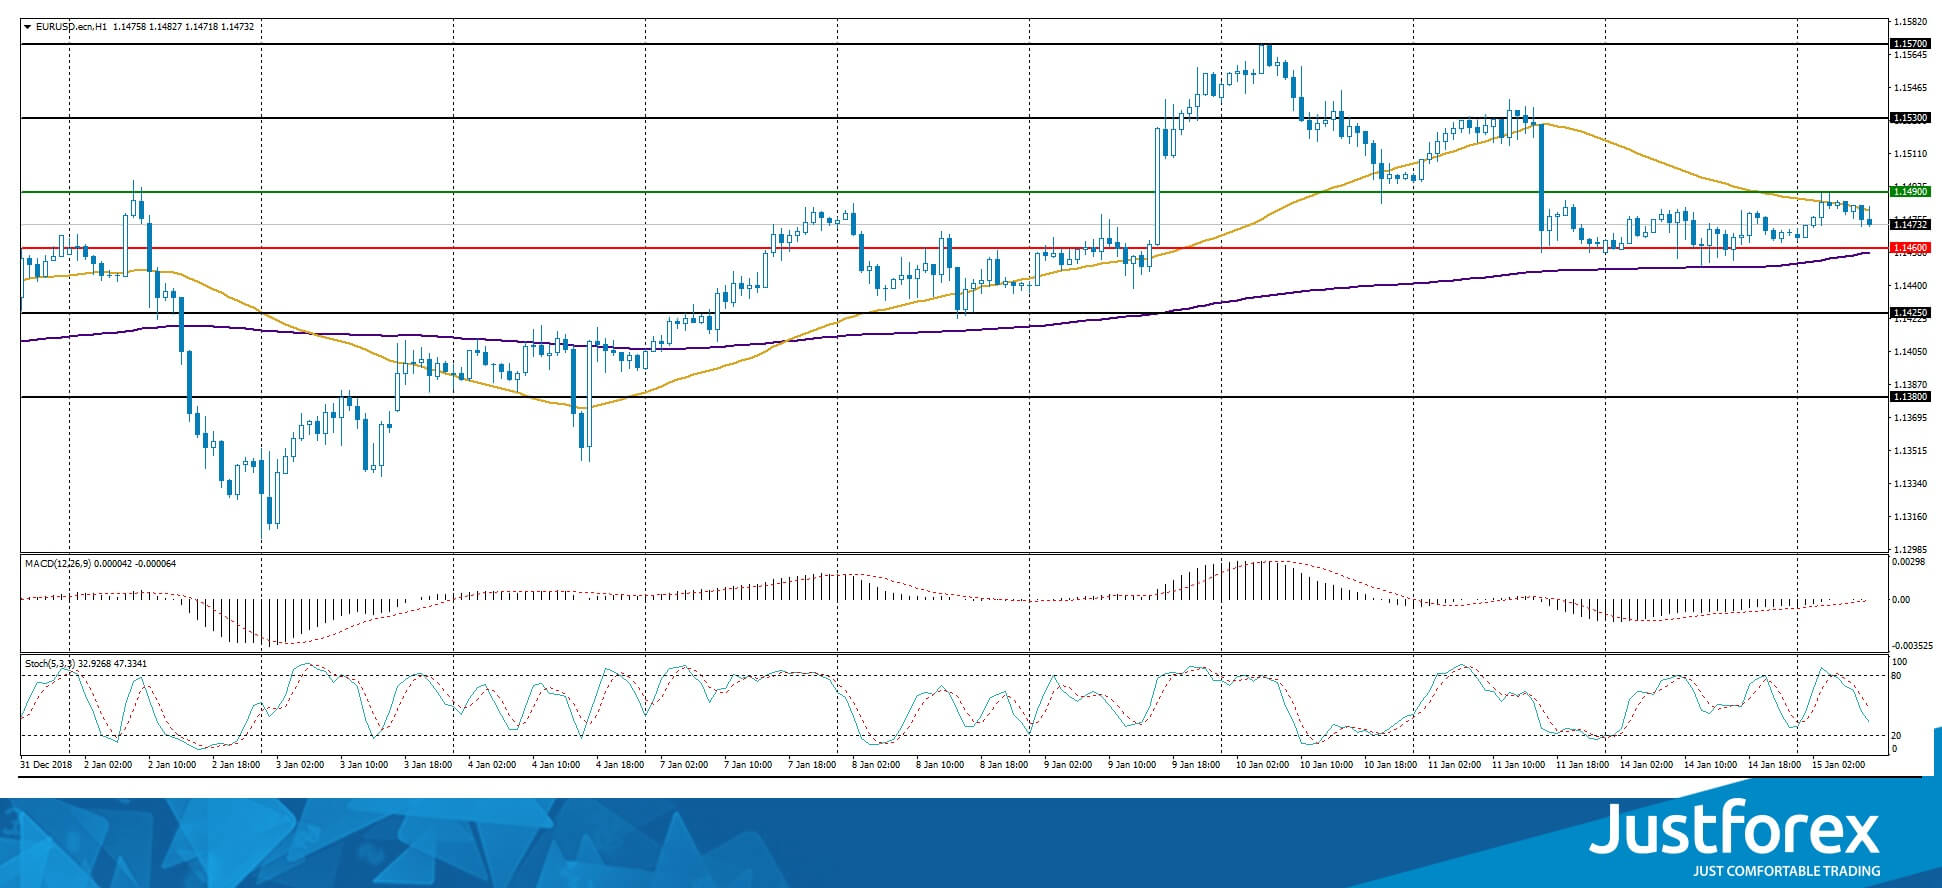
The indicators do not provide precise signals, the price is being traded between 50 MA and 200 MA.
The MACD histogram is close to 0. There are no signals.
The Stochastic Oscillator is in the neutral zone, the %K line is below the %D line, which points toward a bearish mood.
Trading recommendations
Support levels: 1.14600, 1.14250, 1.13800
Resistance levels: 1.14900, 1.15300, 1.15700
If the price fixes below the local support level of 1.14600 consider selling EUR/USD. The movement will tend toward 1.14000.
Alternatively the currency pair can grow toward 1.15300-1.15500.
The GBP/USD currency pair
Technical indicators of the currency pair:
Prev Open: 1.28538
Open: 1.28560
% chg. over the last day: +0.21
Day’s range: 1.28800 – 1.29105
52 wk range: 1.2438 – 1.4378
GBP/USD is showing a variety of trends. The investors are waiting for the Brexit vote which is set for tonight. The key levels are 1.28600 and 1.29100. Positions should be opened from these levels. Tonight GBP/USD may be highly volatile so consider setting the StopLoss and TakeProfit parameters.
The Economic News Feed for 15.01.2019:
The Brexit Vote – 21:00 (GMT+2:00);
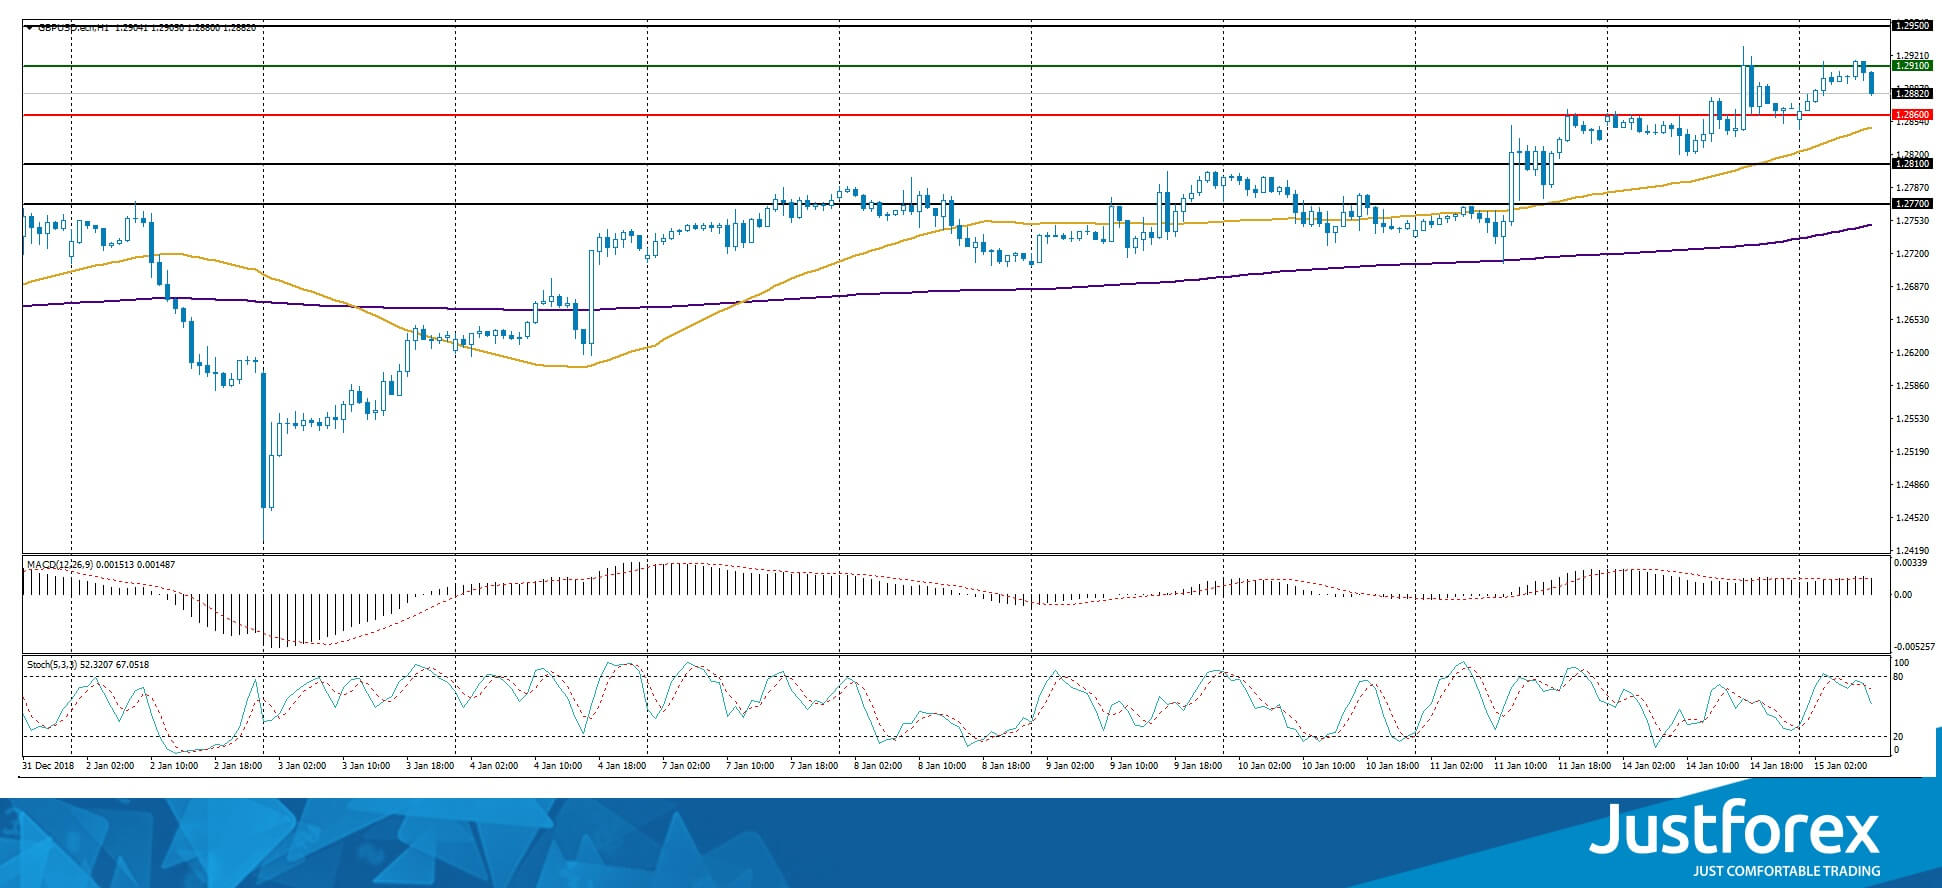
Indicators point toward the power of the buyers, the price fixed above 50 MA and 200 MA.
The MACD histogram is in the positve zone but below the signal line, which gives a weak signal o buy GBP/USD.
The Stochastic Oscillator is in the neutral zone, the %K line is below the %D line which points toward a bearish mood.
Trading recommendations
Support levels: 1.28600, 1.28100, 1.27700
Resistance levels: 1.29100, 1.29500
If the price fixes below the mirror support of 1.28600, expect the quotes to fall toward 1.28100-1.27900.
Alternatively the quotes can grow toward 1.29500-1.29700.
The USD/CAD currency pair
Technical indicators of the currency pair:
Prev Open: 1.32572
Open: 1.32817
% chg. over the last day: +0.04
Day’s range: 1.32444 – 1.32582
52 wk range: 1.2248 – 1.3664
USD/CAD is showing an ambiguous technical picture. The quotes are moving in a flat. The investors are waiting for additional drivers. You should keep an eye on the US news feed. Right now the key interest range is 1.32400 and 1.32800 respectively. You should open positions from the key levels.
The Economic News Feed for 15.01.2019 is calm.
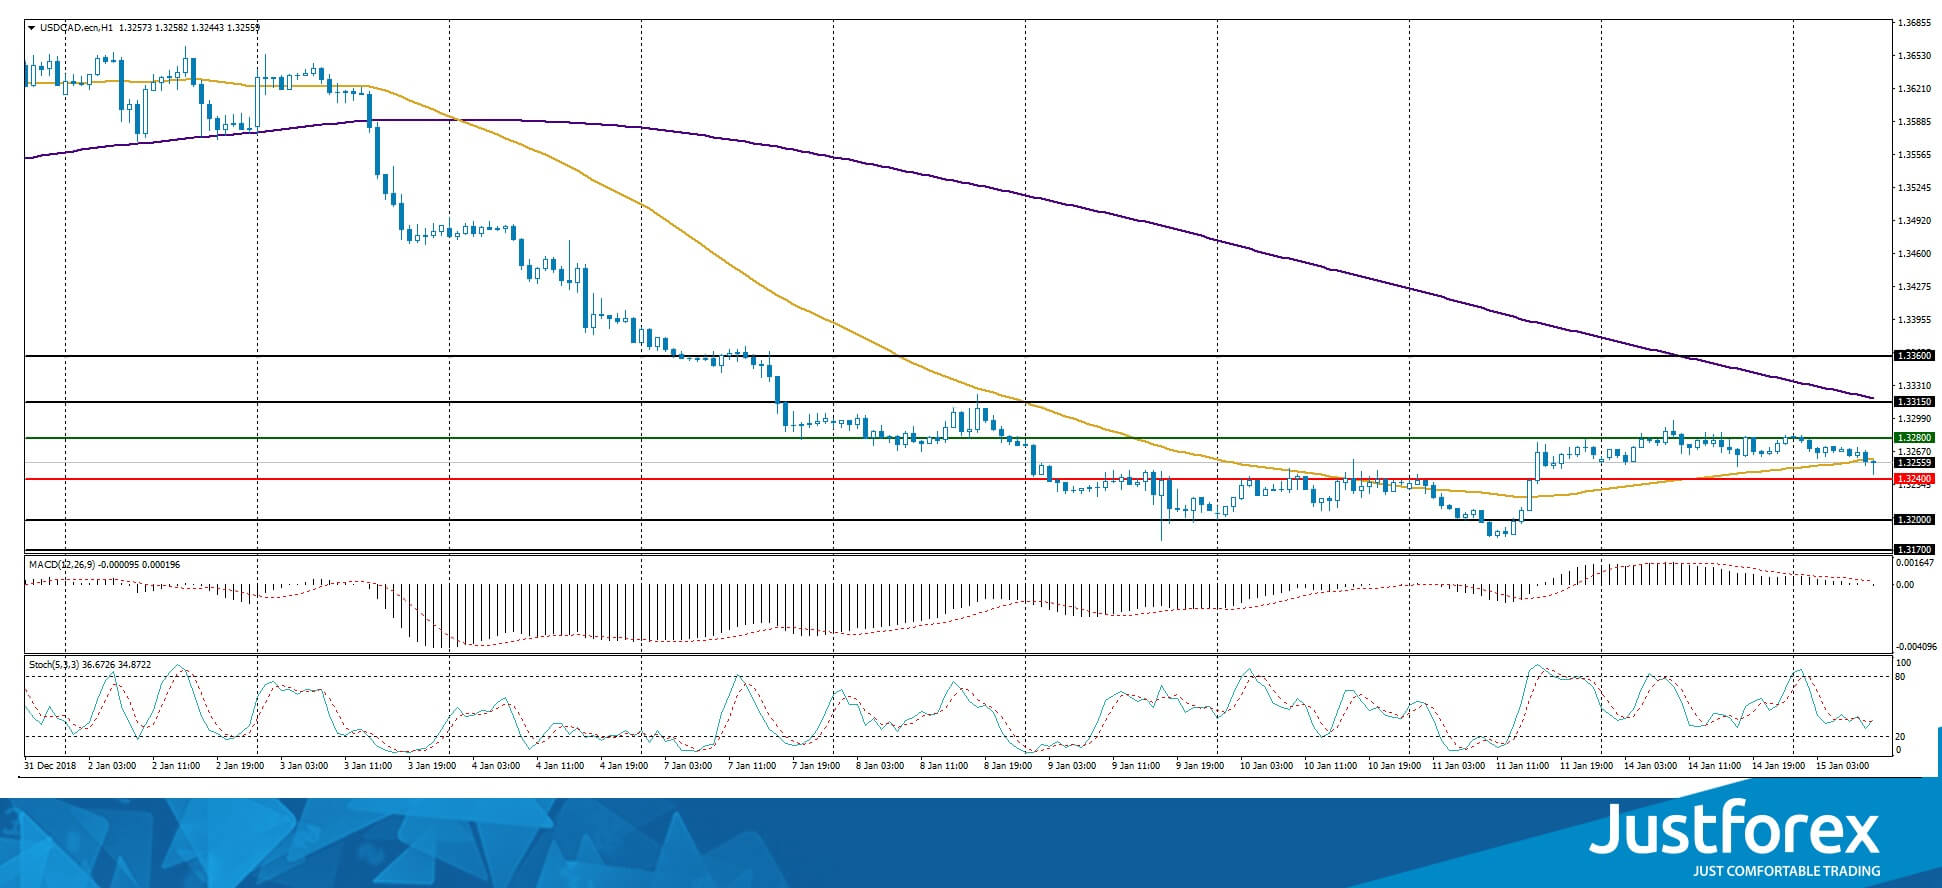
The indicators do not provide precise signals, the price is testing 50 MA.
The MACD histogram is close to 0.
The Stochastic Oscillator is in the neutral zone, the %K line is below the %D line which gives a signal to sell USD/CAD.
Trading recommendations
Support levels: 1.32400, 1.32000, 1.31700
Resistance levels: 1.32800, 1.33150, 1.33600
If the price fixes below 1.32800 expect the quotes to grow toward 1.33150-1.33400.
Altenatively the quotes can descend toward 1.32000-1.31700.
The USD/JPY currency pair
Technical indicators of the currency pair:
Prev Open: 108.512
Open: 108.154
% chg. over the last day: -0.20
Day’s range: 108.632 – 108.697
52 wk range: 104.56 – 114.56
Yesterday the USD/JPY have slightly lowered. Right now the currency pair is in a bullish mood. The key levels are 108.500 and 108.800. You should open positions from the key levels. The quotes can grow further.
The Economic News Feed for 15.01.2019 is calm.
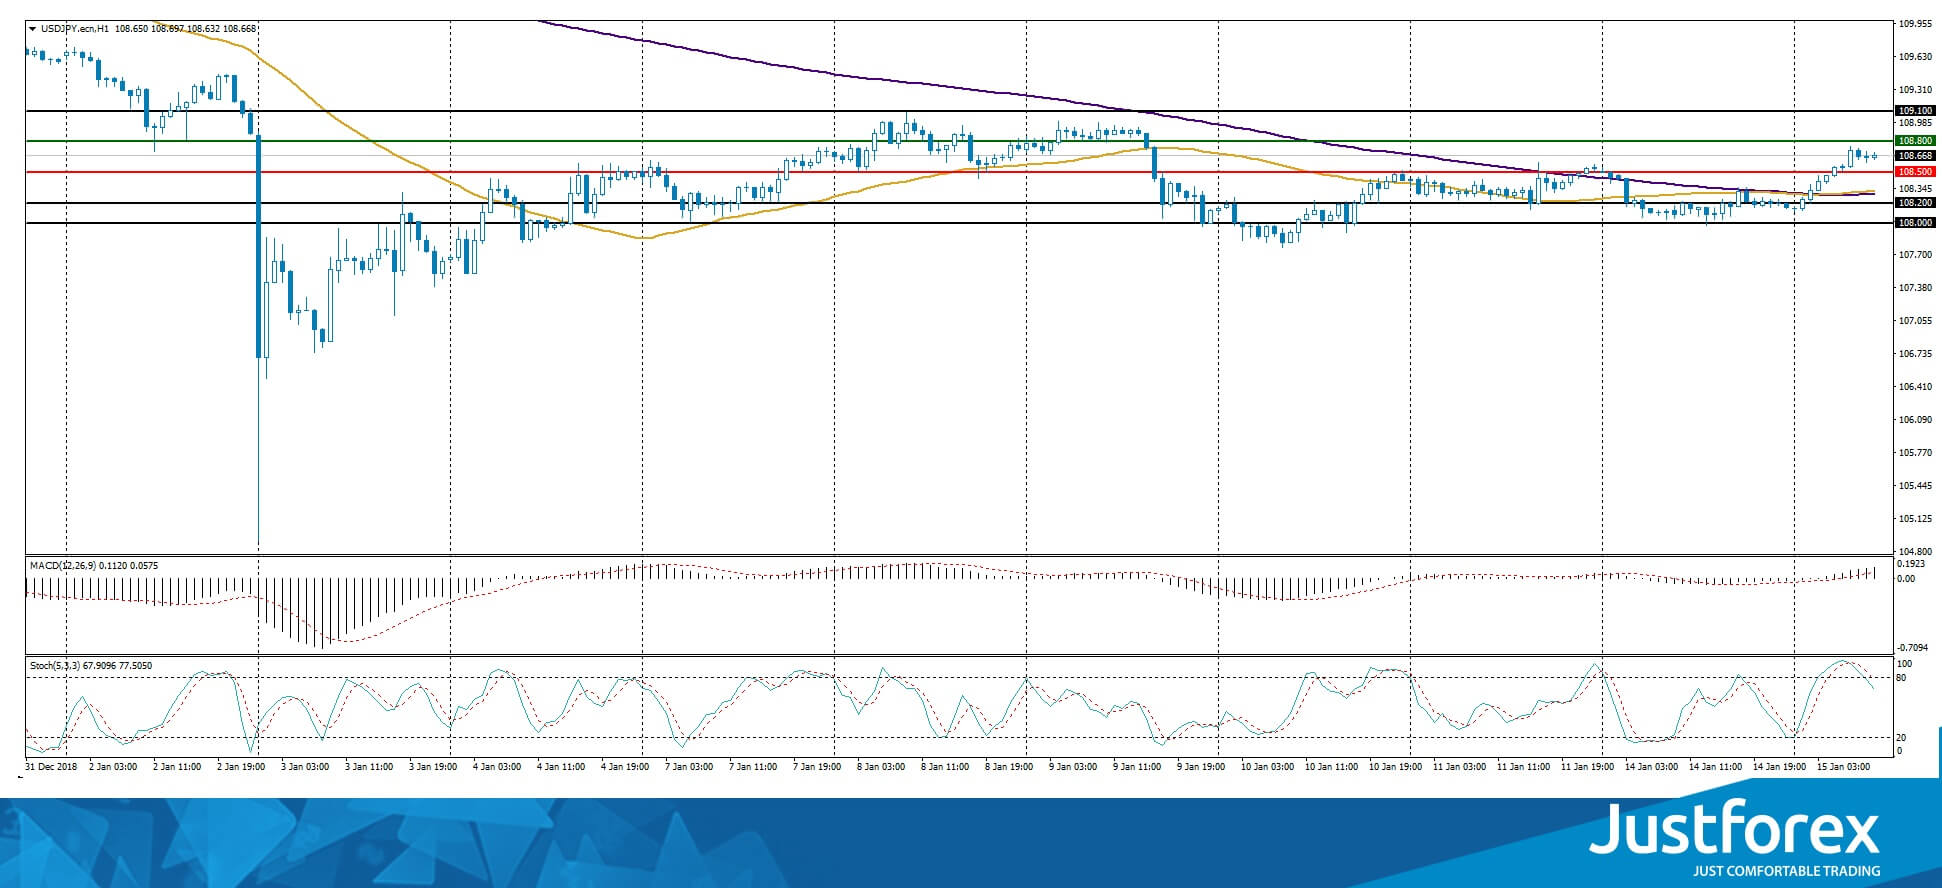
The price has fixed above 50 MA and 200 MA which shows the power of the buyers.
The MACD histogram is in the positive zone which gives a signal to buy USD/JPY.
The Stochastic Oscillator is in the neutral zone, the %K line is below the %D line, which points toward a bearish mood.
Trading recommendations
Support levels: 108.500, 108.200, 108.000
Resistance levels: 108.800, 109.100
If the price fixes above 108.800 expect further growth toward 109.100-109.300.
Alternatively the quotes can fall toward 108.200-108.000


