
The EUR/USD currency pair
Technical indicators of the currency pair:
Prev Open: 1.13597
Open: 1.13803
% chg. over the last day: +0.24
Day’s range: 1.13405 – 1.13738
52 wk range: 1.1214 – 1.2557
EUR/USD was in a bullish mood yesterday, but today the quotes started to descend. The investors are watching the US/China trading conflict. The key support and resistance levels are 1.13550 and 1.13850. You should open positions from these levels. The trading instrument has a tendency to descend.
The Economic News Feed for 24.01.2019:
Industrial PMI (GER) – 10:30 (GMT+2:00);
Key Interest Rate Announcement (EU) – 14:45 (GMT+2:00);
Composite PMI by Markit (US) – 16:45 (GMT+2:00);
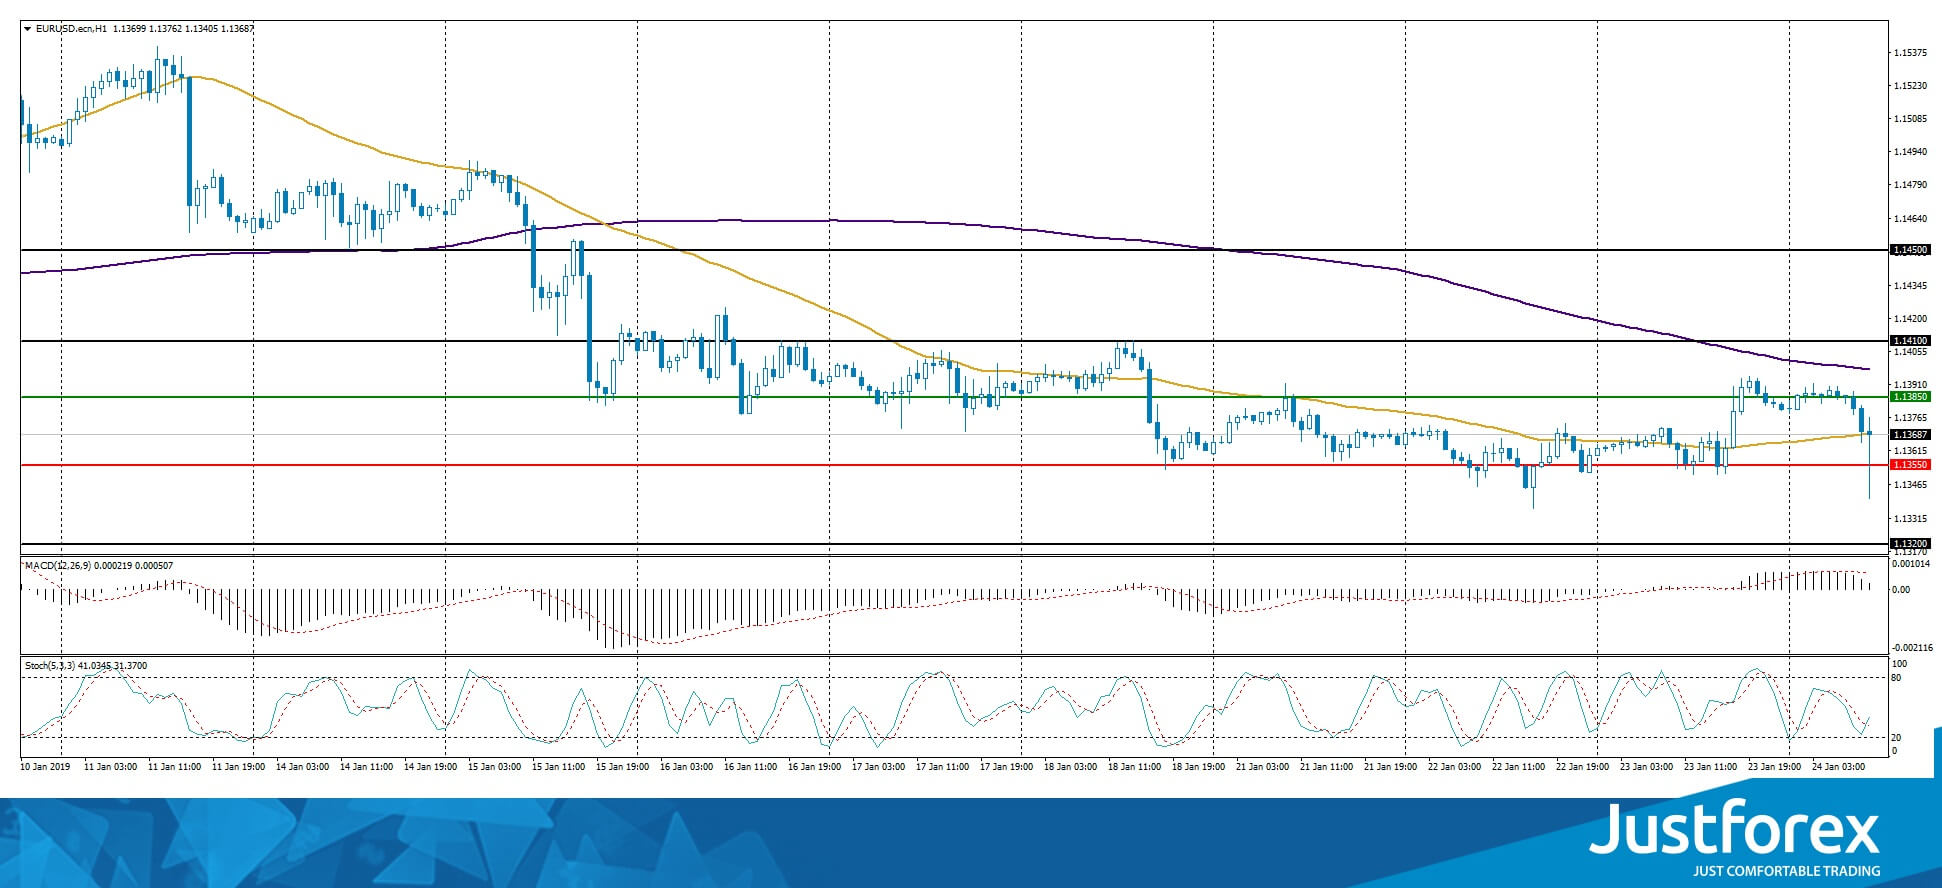
The indicators do not provide precise signals, the price is testing 50 MA.
The MACD histogram is in the positive zone but below the signal line, which gives a weak signal to buy EUR/USD.
The Stochastic Oscillator is in the neutral zone, the %K line is crossing the %D line. There are no signals.
Trading recommendations
Support levels: 1.13550, 1.13200
Resistance levels: 1.13850, 1.14100, 1.14500
If the price fixes above 1.13550 the quotes can descend further toward 1.13200-1.13000.
Alternatively the quotes can rise toward 1.14100-1.14300.
The GBP/USD currency pair
Technical indicators of the currency pair:
Prev Open: 1.29565
Open: 1.30680
% chg. over the last day: +0.96
Day’s range: 1.30273 – 1.30696
52 wk range: 1.2438 – 1.4378
Yesterday USD/CAD is in an aggressive buyout. The quotes have grown by 120 points. The financial market participants hope that the UK will avoid leaving the EU without an agreement. The key support and resistance levels are 1.30250 and 1.30750. A technical correction is possible soon.
The Economic News Feed for 24.01.2019 is calm.
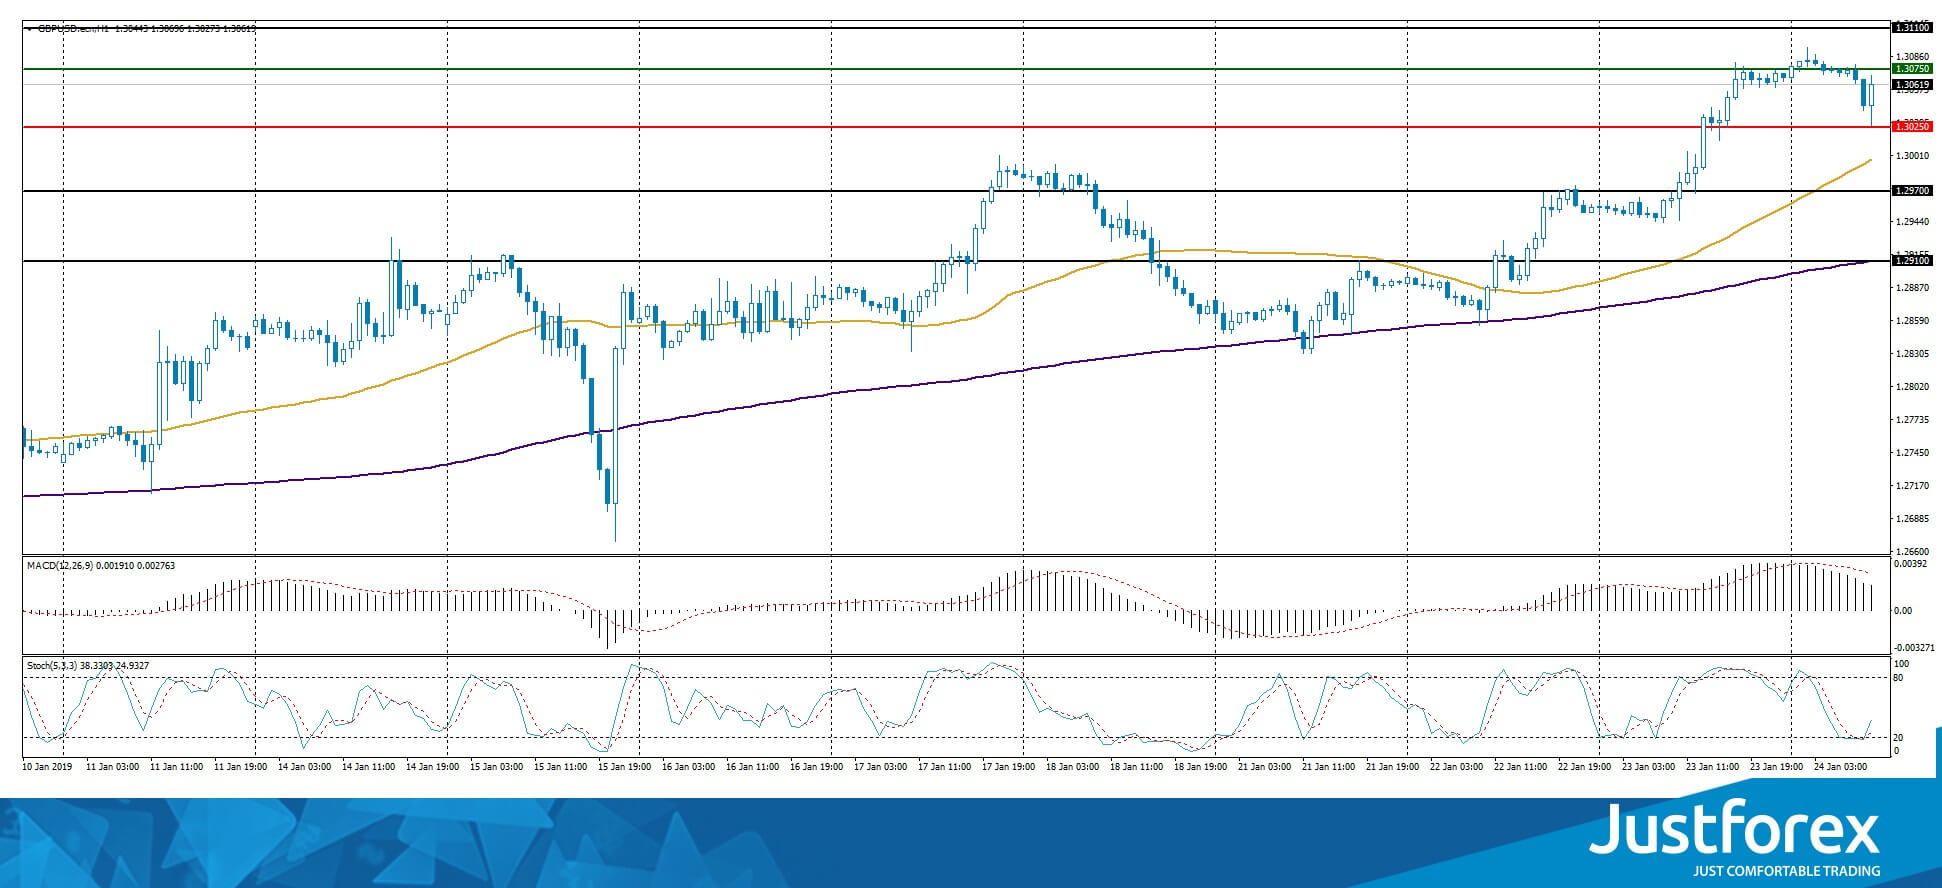
The indicators point to the power of the buyers, the price is above 50 MA and 200 MA.
The MACD histogram is in the positive zone but below the signal line, which gives a weak signal to buy GBP/USD..
The Stochastic Oscillator is in the overbought zone, the %K line is crossing the %D line.
Trading recommendations
Support levels: 1.30250, 1.29700, 1.29100
Resistance levels: 1.30750, 1.31100
If the price is below 1.30250, expet the quotes to correct toward 1.29700-1.29500.
Alternatively, the quotes can grow toward 1.31100-1.31300.
The USD/CAD currency pair
Technical indicators of the currency pair:
Prev Open: 1.32903
Open: 1.33400
% chg. over the last day: -0.10
Day’s range: 1.33554 – 1.33575
52 wk range: 1.2248 – 1.3664
Yesterday USD/CAD was in a variety of trends, following a weak report on the retail sales. The basis index in November lowered by 0.6 while the experts were waiting for 0.4. The retail sales volume in November also lowered by 0.9% instead of 0.6%. The key support and resistance levels are 1.33400 and 1.33650. You should open positions from these levels.
The Economic News Feed for 24.01.2019 is calm.
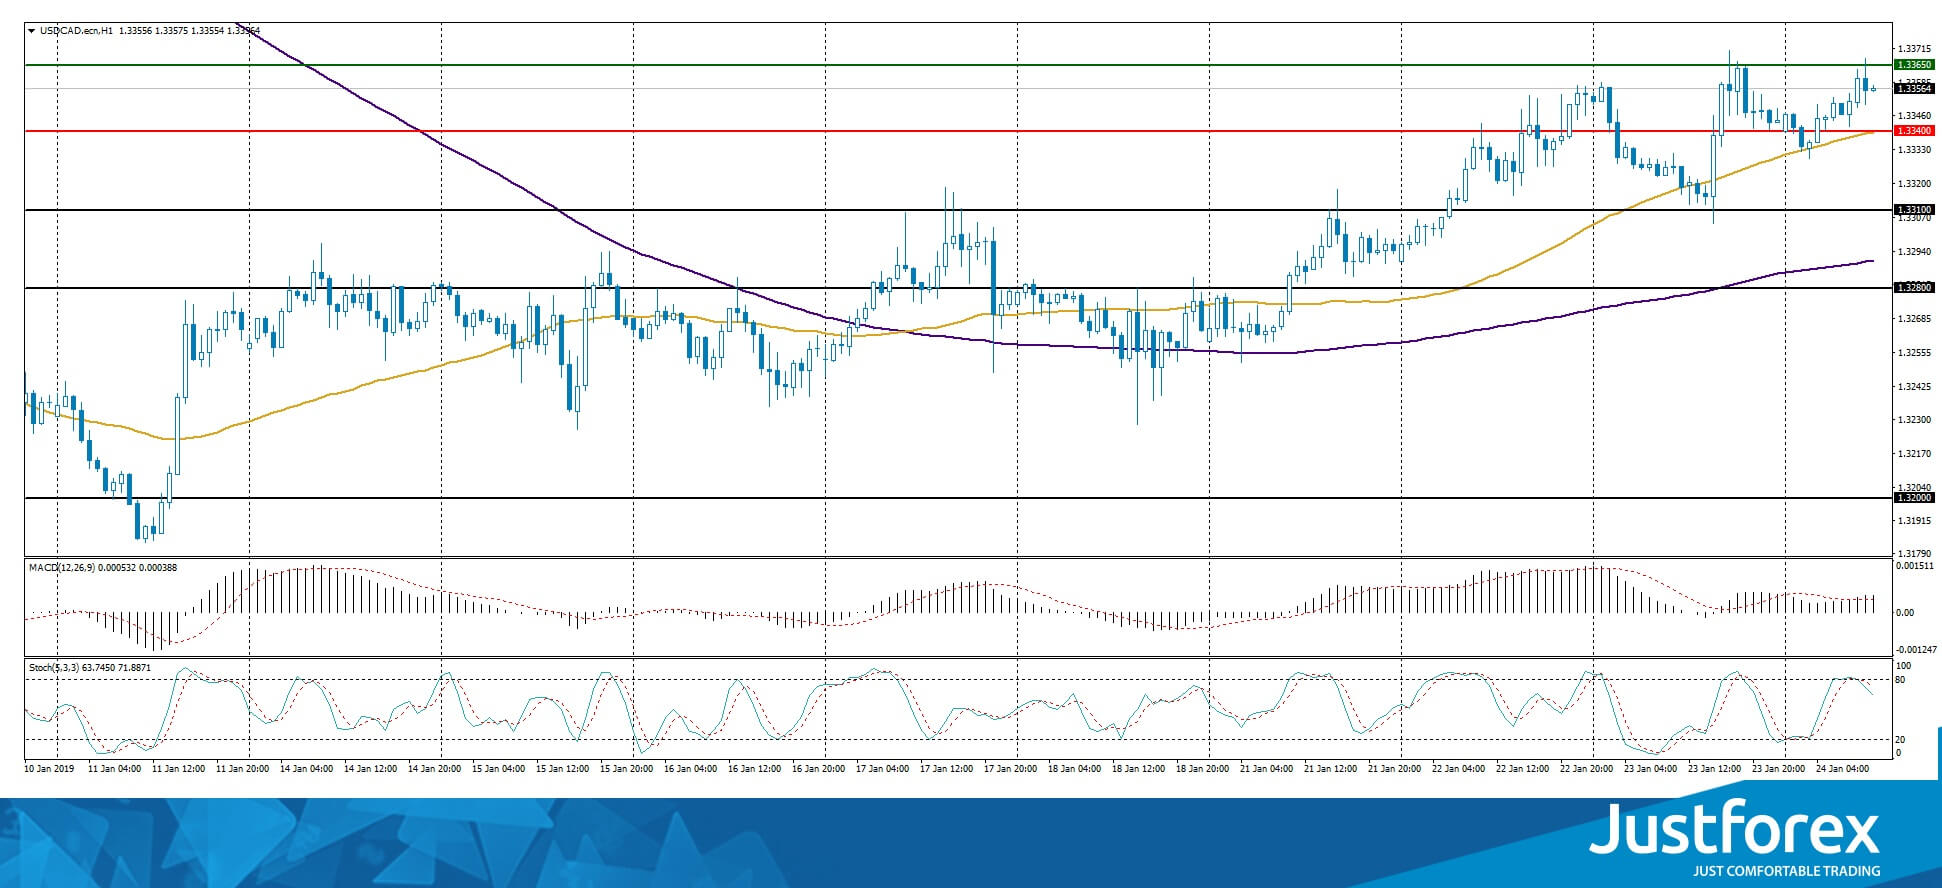
The price fixed above 50 MA and 200 MA which points to the power of the buyers.
The MACD histogram is in the positive zone and above the signal line, which gives a strong signal to buy USD/CAD.
The Stochastic Oscillator is in the neutral zone, the %K line is below the %D line which gives a signal to sell USD/CAD.
Trading recommendations
Support levels: 1.33400, 1.33100, 1.32800
Resistance levels: 1.33650, 1.34000
If the price fixes above 1.33650, expect the quotes to grow toward 1.34000.
Alternatively the quotes can descend towar 1.33100-1.32800.
The USD/JPY currency pair
Technical indicators of the currency pair:
Prev Open: 109.651
Open: 109.564
% chg. over the last day: +0.11
Day’s range: 109.656 – 109.689
52 wk range: 104.56 – 114.56
USD/JPY is in an variety of trends. The investors are waiting for addtional drivers. The key support and resistance levels are 109.500 and 109.800, you should open positions from them. Keep an eye on the US Treasury 10-year bonds yield.
The Economic News Feed for 24.01.2019 is calm.
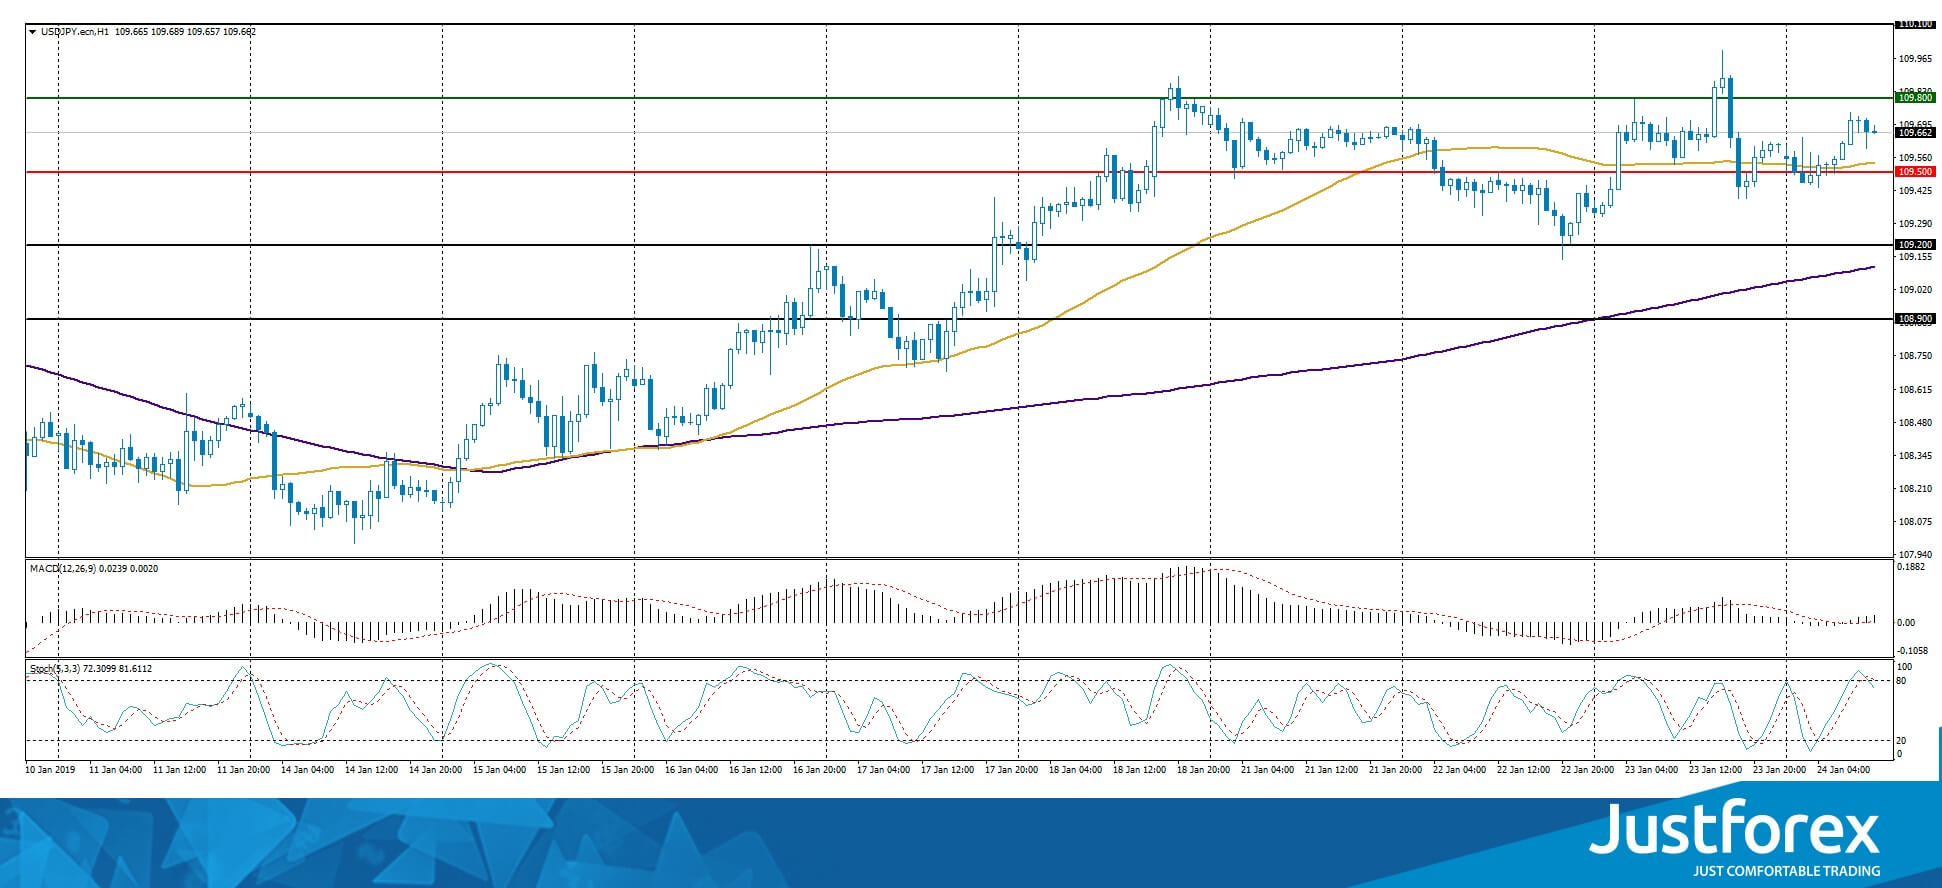
The price fixed above 50 MA and 200 MA which points to the power of the buyers.
The MACD histogram is close to 0. There are no signals.
The Stochastic Oscillator is close to the overbought zone, the %K line is crossing the %D line. There are no signals.
Trading recommendations
Support levels: 109.500, 109.200, 108.900
Resistance levels: 109.800, 110.100
If the price fixes above the key resistance of 109.800 consider selling USD/JPY. The movement will tend toward 110.100-110.300.
Alternatively the quotes can fall toward 109.200-108.900.


