
Gold price declined recently and tested the $1,275 support area where buyers emerged. Crude oil price broke a key resistance near $53.50 and it may continue to move higher.
Important Takeaways for Gold and Oil
- Gold price is gaining momentum and broke the $1,280 resistance against the US Dollar.
- There is a crucial bearish trend line in place with resistance at $1,283 on the hourly chart of gold.
- Crude oil price broke a major bearish trend line at $53.00 on the hourly chart of XTI/USD.
- The price could accelerate higher and it may continue to rise towards the $54.50 level.
Gold Price Technical Analysis
Gold price started a major decline from the $1,295 resistance level against the US Dollar. The price declined heavily and broke the $1,292, $1,290 and $1,285 support levels.
There was even a break below the $1,280 support and a low was formed at $1,276 on FXOpen. Later, the price corrected higher and moved above the $1,280 and $1,282 resistance levels. There was also a break above the 23.6% Fib retracement level of the recent decline from the $1,295 high to $1,276 low.
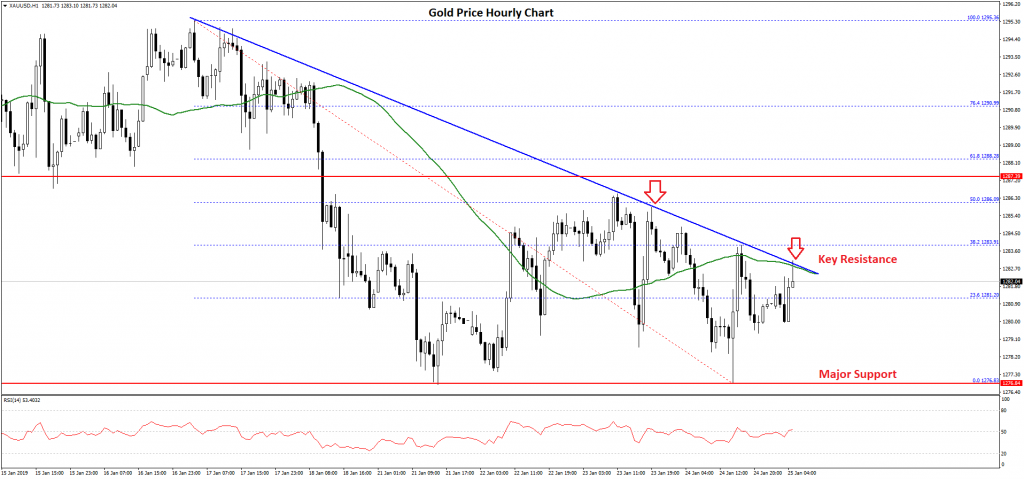
However, the price is currently facing a monster resistance near the $1,285 level and the 50 hourly simple moving average. Moreover, there is a crucial bearish trend line in place with resistance at $1,283 on the hourly chart of gold.
Above the trend line, the next resistance is near the $1,286 level and the 50% Fib retracement level of the recent decline from the $1,295 high to $1,276 low. The main resistance is near the $1,288 pivot level, above which the price is likely to accelerate towards the $1,290 and $1,295 levels.
On the downside, an initial support is at $1,280, below which the price could revisit the $1,276 support level. If there is a break below the recent low, the price may move into a bearish zone towards $1,270.
Oil Price Technical Analysis
Crude oil price dipped earlier this week from the $54.50 resistance level against the US Dollar. The price traded lower and broke the $54.00 and $53.50 support levels before buyers emerged near the $52.00 zone.
A low was formed near the $51.88 level and later the price bounced back sharply. It broke the $52.50 resistance and the 50 hourly simple moving average. Besides, there was a break above the 50% Fib retracement level of the recent decline from the $54.47 high to $51.88 low.
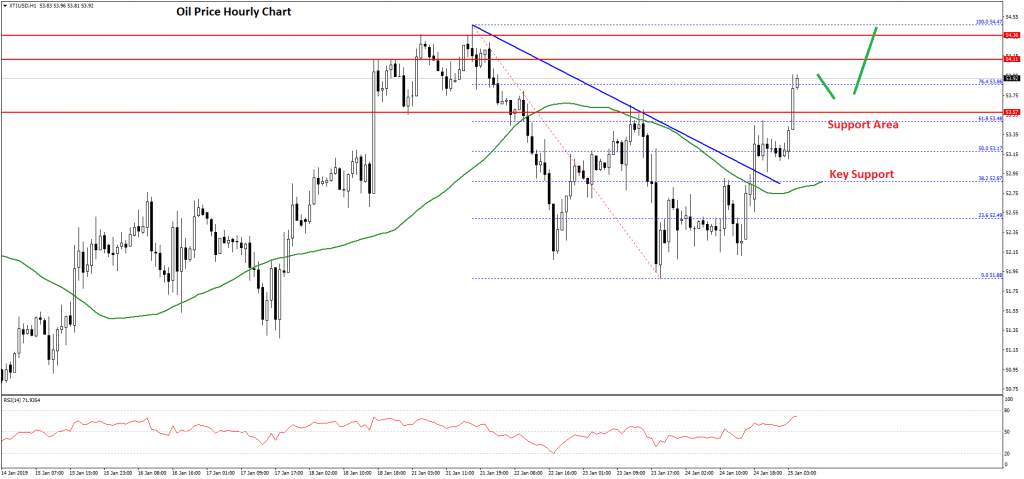
More importantly, the price broke a major bearish trend line at $53.00 on the hourly chart of XTI/USD. It opened the doors for more gains and the price surpassed the $53.50 resistance.
Therefore, there are high chances of more gains above the $54.00 and $54.20 levels in the near term. If there is an upside break above $54.50, the price may even test the $55.00 level.
On the downside, an initial support is at $53.50, below which the price could test the $52.50 support and the 50 hourly simple moving average. As long as the price is trading above the $52.50 pivot level, it remains supported for more gains in the coming sessions.


