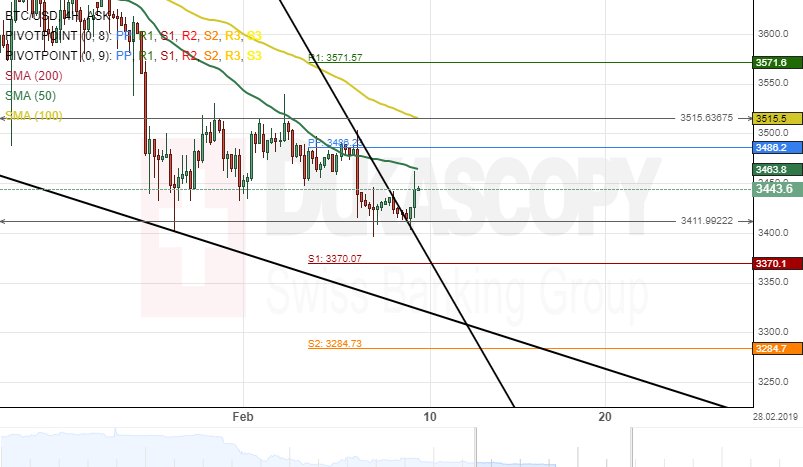
The Bitcoin cryptocurrency has been moving sideways against the US Dollar since January 29. The pair was trading between the upper and lower boundaries of a horizontal channel.
As for the near future, it is likely that the BTC/USD currency pair continues its movement down. The potential target for the blockchain will be near a traditional weekly support level at 3370.1.
However, it is expected that the pair aims for a re-test of the 50-hour simple moving average at 3464.8 during the following trading session