
The EUR/USD currency pair
Technical indicators of the currency pair:
Prev Open: 1.13383
Open: 1.13191
% chg. over the last day: -0.10
Day’s range: 1.13146 – 1.13300
52 wk range: 1.1214 – 1.2557
EUR stabilized after a long fall since the beginning of the month. Right now EUR/USD quotes are consolidating. The key support and resistance levels are 1.13150 and 1.13350. A US/China trading conflict is in the spotlight. Keep in mind that the countries made a truce until March 1 to find a compromise. The investors are waiting for the next round, set to commence this week. Keep an eye on the relevant intel regarding and open positions from the key levels.
The Economic News Feed for 11.02.2019 is calm.
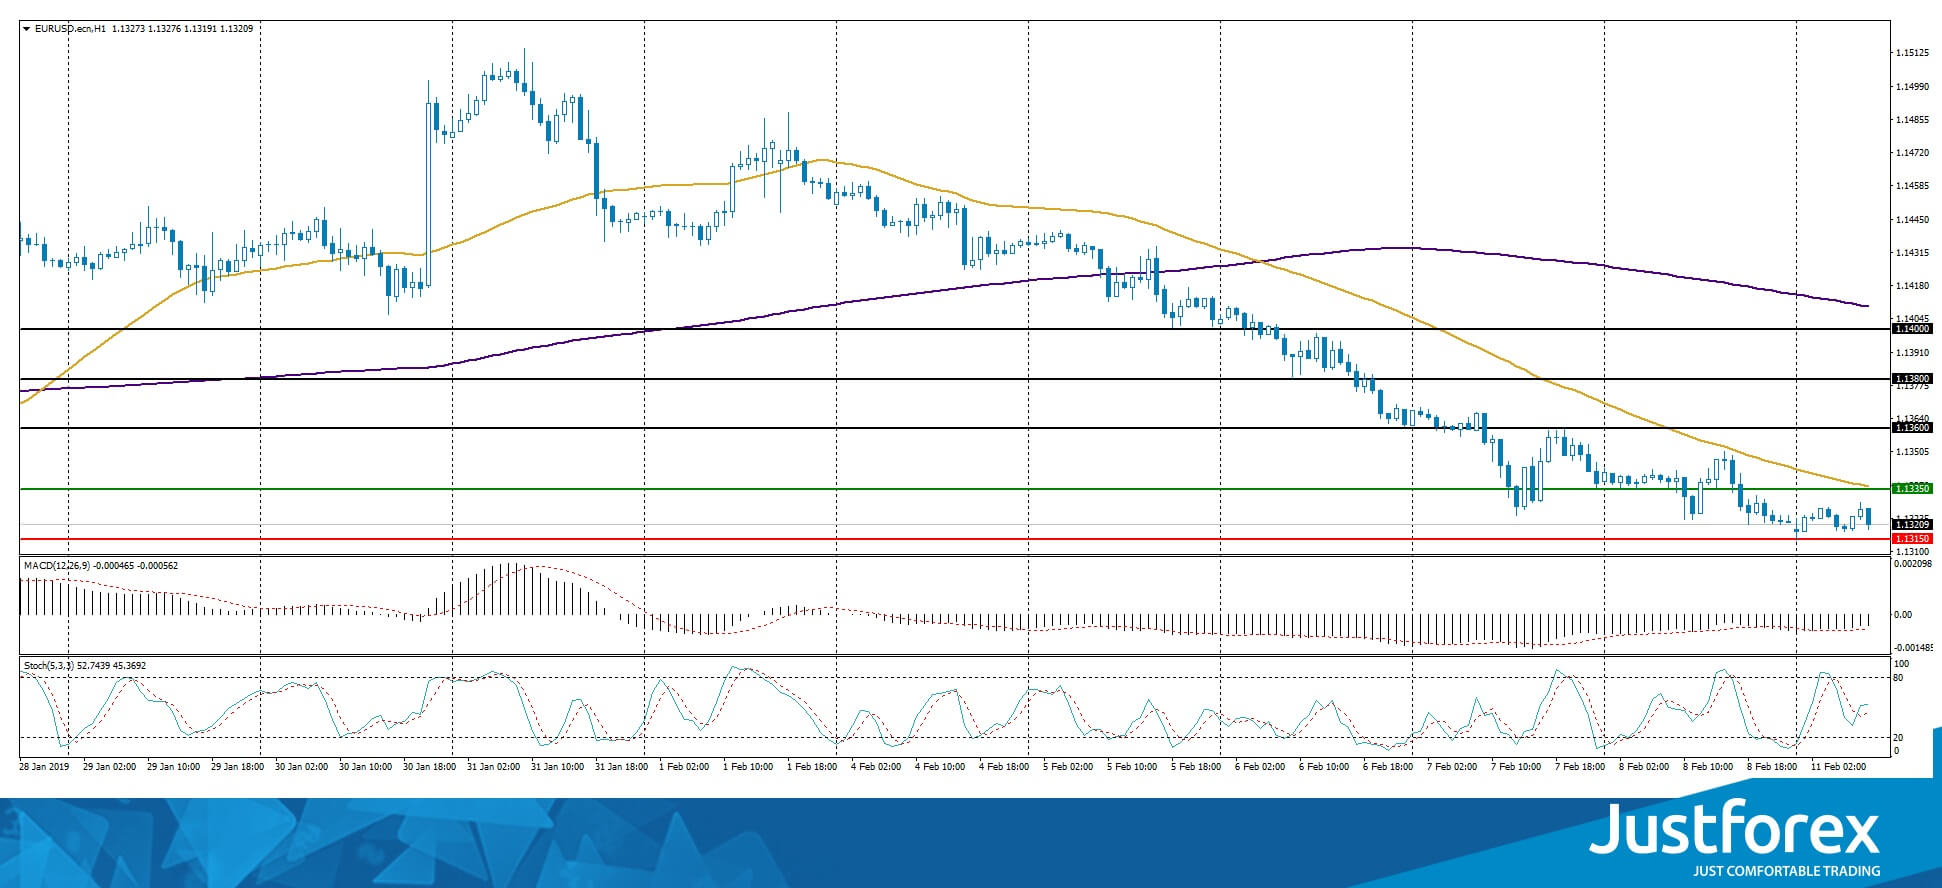
The price fixed below 50 MA and 200 MA which points to the power of the sellers.
The MACD histogram is in the negative zone but above the signal line, which gives a weak signal to sell EUR/USD.
The Stochastic Oscillator is in the neutral zone, the %K line is crossing the %D line. There are no signals at the moment.
Trading recommendations
Support levels: 1.13150, 1.13000, 1.12500
Resistance levels: 1.13350, 1.13600, 1.13800
If the price fixes below the local support 1.13150, expect the quotes to fall toward 1.12800-1.12600.
Alternatively, the quotes can recover toward 1.13600-1.13800.
The GBP/USD currency pair
Technical indicators of the currency pair:
Prev Open: 1.29480
Open: 1.29289
% chg. over the last day: -0.05
Day’s range: 1.29075 – 1.29386
52 wk range: 1.2438 – 1.4378
GBP/USD has an ambiguous technical picture. The pound is being traded in a flat. The key range is 1.29000-1.29450. The financial market participants are waiting for new information regarding Brexit. This week the UK will publish some important reports which may change the GBP/USD balance in the short-term. Open the positions from the key levels.
The Economic News Feed for 11.02.2019:
GDP Report (GB) – 11:30 (GMT+2:00);
Volume of Industrial Production (GB) – 11:30 (GMT+2:00);
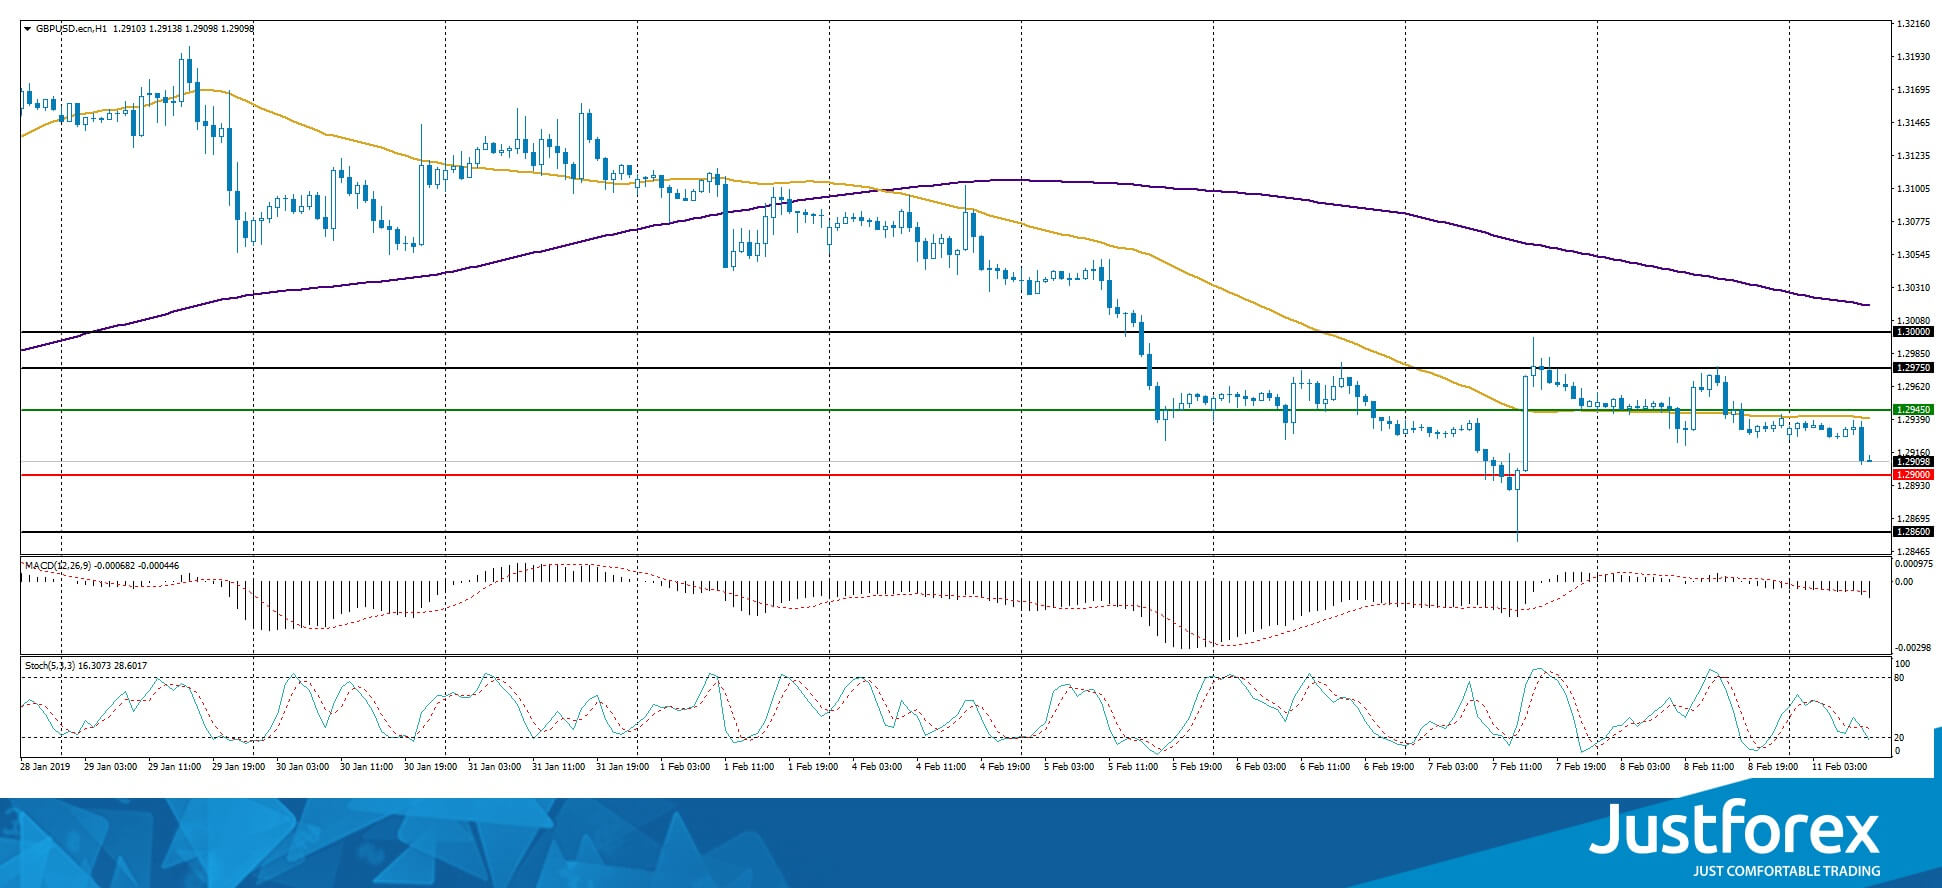
The price fixed below 50 MA and 200 MA, which points to the power of the sellers
The MACD histogram is in the negative zone and below the signal line, which points to the bearish mood.
The Stochastic Oscillator is near the oversold zone, the %K line is below the %D line which gives a weak signal to sell GBP/USD.
Trading recommendations
Support levels: 1.29000, 1.28600
Resistance levels: 1.29450, 1.29750, 1.30000
If the price fixes below the round 1.29000 consider selling GBP/USD. The movement will tend toward 1.28600-1.28400.
Alternatively, the quotes can grow toward 1.29750-1.30000.
The USD/CAD currency pair
Technical indicators of the currency pair:
Prev Open: 1.32979
Open: 1.32630
% chg. over the last day: -0.23
Day’s range: 1.32629 – 1.32965
52 wk range: 1.2248 – 1.3664
USD/CAD had a little sell-off on Friday and updated the local minimums. The demand on the CAD grew after an optimistic Labour Market report and the primary construction data. Right now USD/CAD is consolidating around 1.32600-1.32950 and can correct further. Open the positions from the key levels.
The Economic News Feed for 11.02.2019:= is calm.
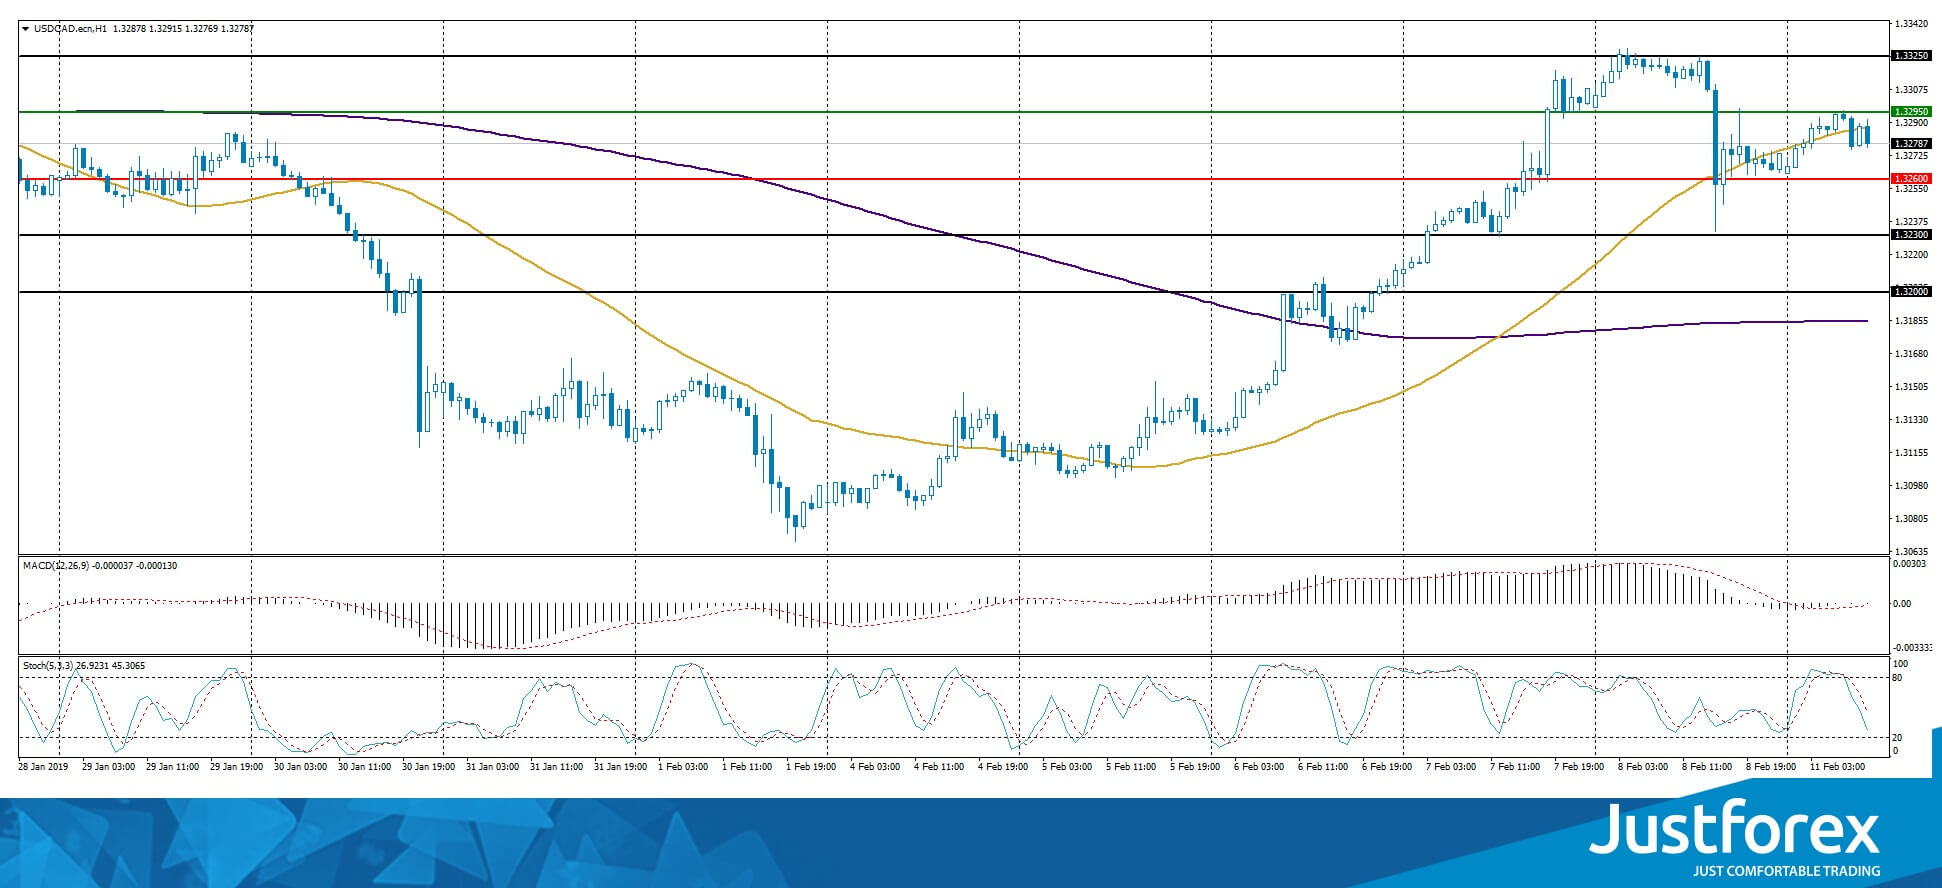
The indicators do not provide precise signals, the price has crossed 50 MA.
The MACD histogram is close to 0.
The Stochastic Oscillator is in the neutral zone, the %K line is below the %D line, which gives a signal to sell USD/CAD.
Trading recommendations
Support levels: 1.32600, 1.32300, 1.32000
Resistance levels: 1.32950, 1.33250
If the price fixes below 1.32600 expect the quotes to correct toward 1.32300-1.32000.
Alternatively the quotes can grow toward 1.33250-1.33500.
The USD/JPY currency pair
Technical indicators of the currency pair:
Prev Open: 109.790
Open: 109.736
% chg. over the last day: -0.07
Day’s range: 109.722 – 110.028
52 wk range: 104.56 – 114.56
USD/JPY keeps trading in a long flat. There is no single defined trend. The financial market participants are waiting for additional drivers. The USD/JPY quotes are testing the 110.000-110.150 zone. The local support is 109.750. You should open positions from the key levels and keep an eye on the US/China trading conflict.
Today the trading activity and volatility on USD/JPY may be smaller than usual due to the celebrations in Japan.
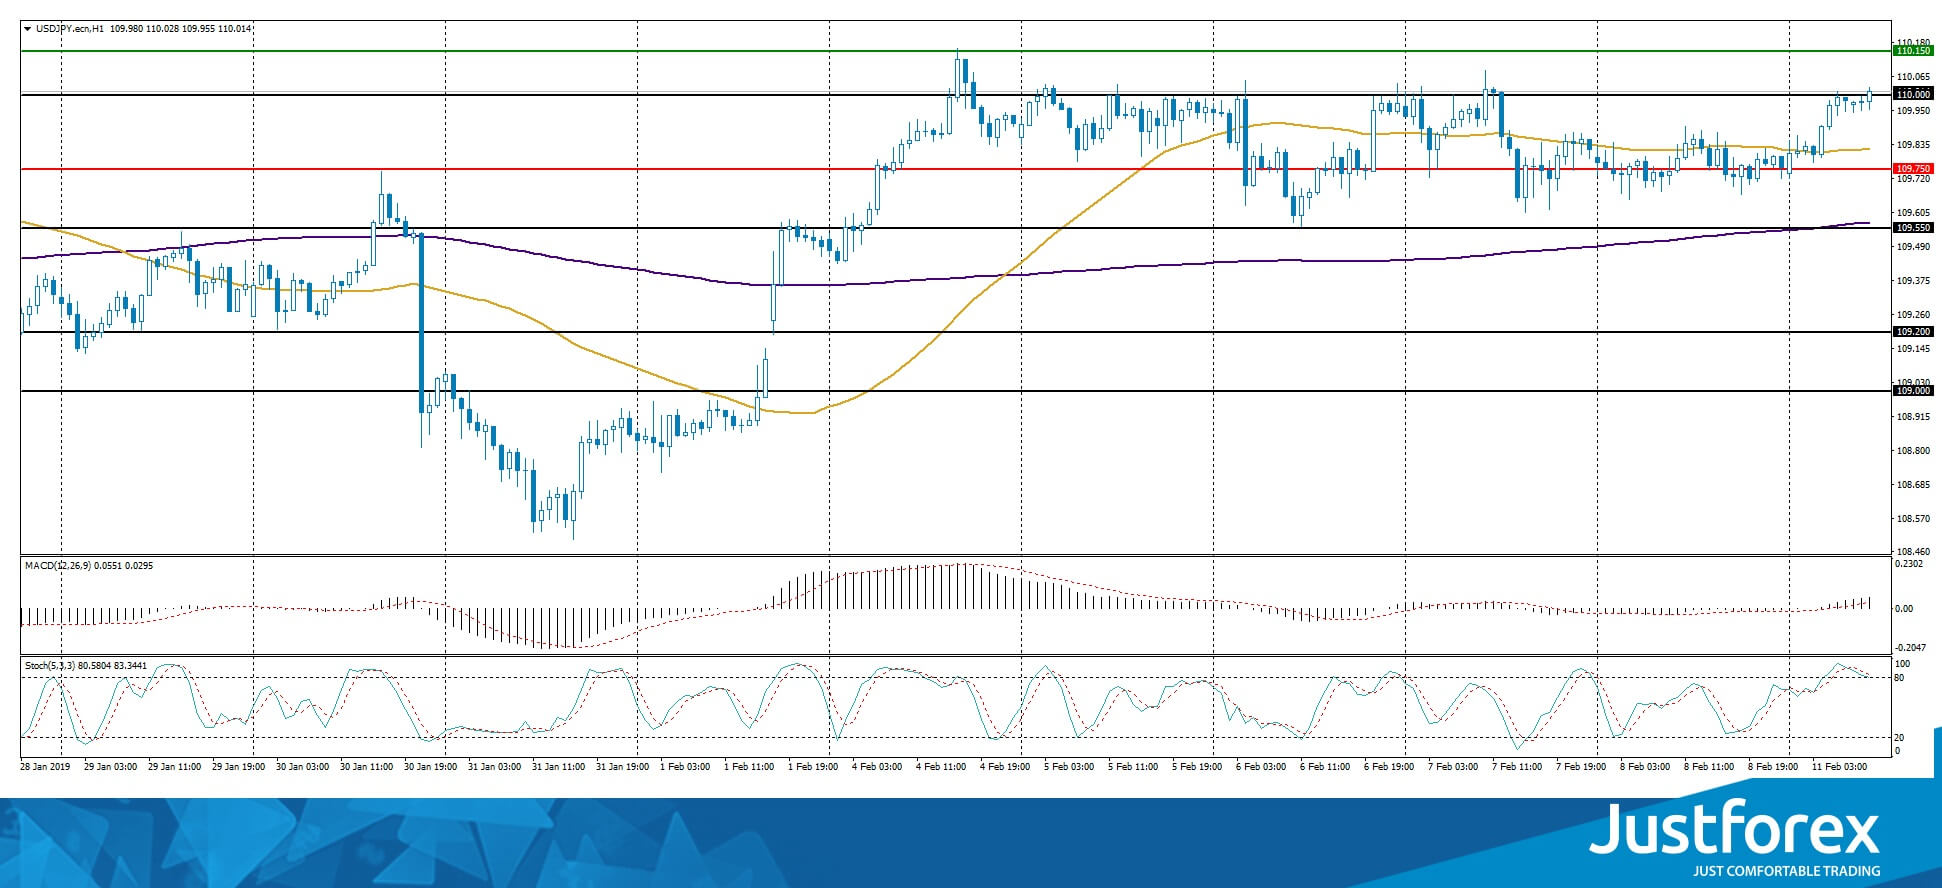
The price fixed above 50 MA and 200 MA which points to the power of the buyers.
The MACD histogram is in the positive zone and keeps rising which points to a bullish mood.
The Stochastic Oscillator is in the overbought zone, the %K line is crossing the %D line. There are no signals at the moment.
Trading recommendations
Support levels: 109.750, 109.550, 109.200
Resistance levels: 110.000, 110.150, 110.500
If the price fixes above 110.150, expect it to grow toward 110.500-110.700.
Alternatively, the price can fall toward 109.500-109.300.


