
A note on lower timeframe confirming price action…
Waiting for lower timeframe confirmation is our main tool to confirm strength within higher timeframe zones, and has really been the key to our trading success. It takes a little time to understand the subtle nuances, however, as each trade is never the same, but once you master the rhythm so to speak, you will be saved from countless unnecessary losing trades. The following is a list of what we look for:
- A break/retest of supply or demand dependent on which way you’re trading.
- A trendline break/retest.
- Buying/selling tails … essentially we look for a cluster of very obvious spikes off of lower timeframe support and resistance levels within the higher timeframe zone.
- Candlestick patterns. We tend to only stick with pin bars and engulfing bars as these have proven to be the most effective.
EUR/USD
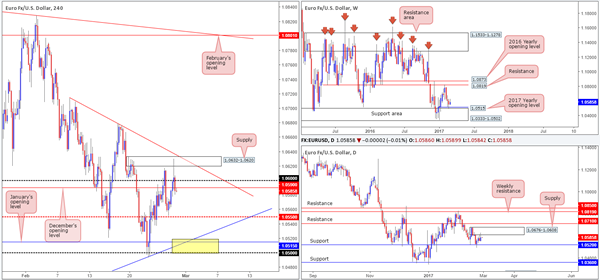
In recent sessions, we can see that the single currency rose on both weak US core durable goods data and disappointing US pending home sales. Despite this, the rally was a short-lived one as price failed to sustain gains beyond the H4 supply area seen at 1.0632-1.0620 (located within daily supply coming in at 1.0676-1.0608). With the H4 candles now seen trading below December’s opening level at 1.0590, the next downside objective, in our view, falls in at the H4 mid-level support drawn from 1.0550, shadowed closely by January’s opening base at 1.0515.
Our suggestions: Personally, we would consider shorting at this time. The 1.05/1.0520 area, nevertheless, looks great for a bounce north (yellow rectangle). The zone comprises of: a round number at 1.05, a H4 trendline support taken from the low 1.0339, January’s opening level at 1.0515, daily support at 1.0520 and let’s not forget that all of this is further reinforced by the weekly support area at 1.0333-1.0502. This barrier, in our humble opinion, has sufficient confluence to justify a trade without the need for additional confirmation.
Data points to consider: US prelim GDP at 1.30pm, CB consumer confidence at 3pm GMT.
Levels to watch/live orders:
- Buys: 1.05/1.0520 ([an area one could possibly trade at market] stop loss: 1.0490).
- Sells: Flat (stop loss: N/A).
GBP/USD
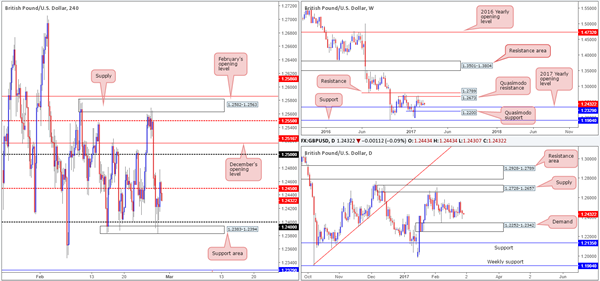
The GBP/USD pair, as you can see, recently managed to find a pocket of bids around the H4 support area drawn in at 1.2383-1.2394. The unit eventually advanced north from here on weak US pending home sales and shook hands with the H4 mid-way resistance band at 1.2450. As of this time, we do not see much direction, at least from a structural perspective, coming in from the bigger picture. Weekly action remains trading mid-range between the 2017 yearly opening level at 1.2329 and a weekly Quasimodo resistance coming in at 1.2673. By the same token, a similar pattern is in motion on the daily chart. The daily candles are seen loitering between daily demand at 1.2252-1.2342 (houses the aforementioned 2017 yearly opening level) and a daily supply penciled in at 1.2728-1.2657 (also houses the above noted weekly Quasimodo resistance level).
Our suggestions: By and large, we still do not see much to hang our hat on at the moment, as price shows very little confluence. Without it, trading becomes a challenging task! Therefore, we’ll continue to remain on the sidelines today and reassess going into Wednesday’s session.
Data points to consider: US prelim GDP at 1.30pm, CB consumer confidence at 3pm GMT.
Levels to watch/live orders:
- Buys: Flat (stop loss: N/A).
- Sells: Flat (stop loss: N/A).
AUD/USD
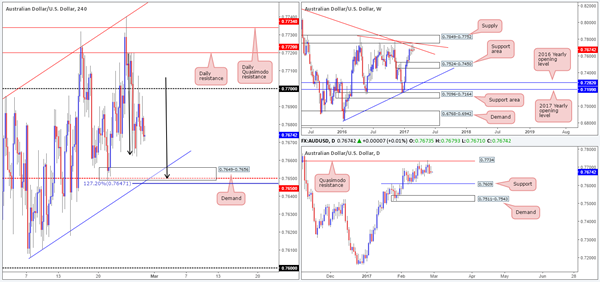
During the course of yesterday’s sessions, the commodity-driven currency tapped the underside of 0.77 and sold off to lows of 0.7669. What is quite notable from a technical perspective this morning is the potential H4 AB=CD bullish pattern (black arrows) in process, terminating around the H4 mid-way support neighborhood at 0.7650. While this number boasts a H4 demand seen at 0.7649-0.7656 and a H4 channel support extended from the low 0.7605, we still remain hesitant. Our reasoning lies within the higher-timeframe structure. Both the weekly and daily charts show room to trade beyond the current H4 demand base to 0.76, as we have a daily support level planted around that area at 0.7609.
Our suggestions: Does this mean we are going to completely ignore the above noted H4 demand? No. Despite the area being positioned at somewhat of a disadvantage on the higher timeframes, our desk believes that a bounce could still be seen from here. But, before trading long from this region we would insist on seeing a reasonably sized H4 bull candle take shape. What this will do is show buyer interest within the walls of a high-probability reversal zone.
Data points to consider: US prelim GDP at 1.30pm, CB consumer confidence at 3pm GMT.
Levels to watch/live orders:
- Buys: 0.7649-0.7656 ([wait for a reasonably sized H4 bull candle to form before looking to execute a trade] stop loss: ideally beyond the trigger candle).
- Sells: Flat (stop loss: N/A).
USD/JPY
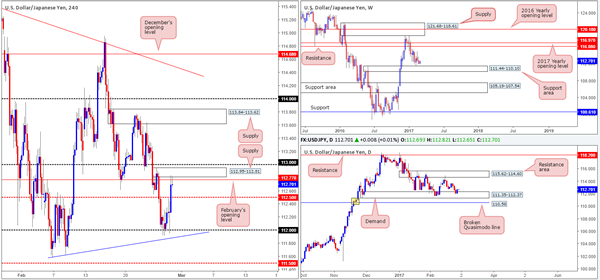
Try as it might, the USD/JPY could not muster enough strength to break through the 112 handle yesterday, and ended the day topping around the underside of the H4 supply at 112.95-112.81/February’s opening level at 112.70. Although this move is bolstered by a daily demand area coming in at 111.35-112.37, we would need to see the H4 candles close above the 113 neighborhood before considering becoming buyers in this market. Beyond 113 is a H4 supply sitting at 113.84-113.62, followed closely by the 114 handle.
Our suggestions: Given the structure seen from the daily timeframe at the moment, we will not be looking to sell this unit today. And, as mentioned above, it will take a H4 close above 113 to be seen before we look to buy. An ideal setup here would be a H4 close higher, followed by a retest of this number as support and a reasonably sized H4 bull candle!
Data points to consider: US prelim GDP at 1.30pm, CB consumer confidence at 3pm GMT.
Levels to watch/live orders:
- Buys: Watch for a H4 close above 113 and look to trade any retest seen thereafter ([we would also advise waiting for a reasonably sized H4 bull candle to form following the retest before looking to execute a trade] stop loss: ideally beyond the trigger candle).
- Sells: Flat (stop loss: N/A).
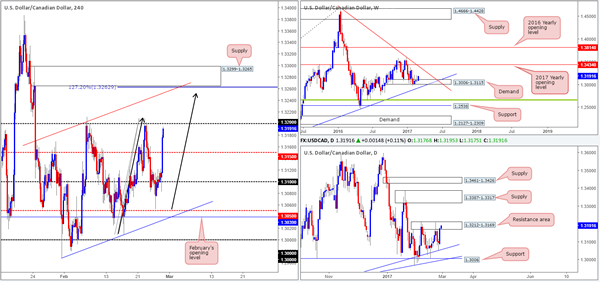
USD/CAD
Underpinned by a weekly demand base coming in at 1.3006-1.3115, the pair was able to touch gloves with a daily resistance area yesterday seen at 1.3212-1.3169. Any sustained move beyond this daily zone would likely place the daily supply base at 1.3387-1.3317 in the firing range.
Turning our attention to the H4 candles, the recent advance has brought the piece up to within striking distance of the 1.32 handle. Apart from price currently being supported by a weekly demand, H4 action is also in the process of forming a H4 AB=CD bearish D-leg, which terminates around the underside of a H4 supply at 1.3299-1.3265 (H4 127.2% Fib ext. at 1.3263). In addition to this, there’s also an intersecting H4 upper channel resistance line coming in from the high 1.3171.
Our suggestions: In essence, we have two possible setups to consider:
- A decisive H4 close above 1.32, followed by a retest and a reasonably sized H4 bull candle would, in our opinion, be enough evidence to suggest price wants to test the above noted H4 supply area. Therefore, one may look to consider longs from here.
- The aforementioned H4 supply is not only a good take-profit target, it’s also a fine place to look to sell from given the surrounding confluence. However, we would advise waiting for a H4 bearish candle to take shape before committing yourself to a position here. The reason simply comes down to the possibility of a fakeout through our H4 supply zone up to the underside of the nearby daily supply at 1.3317.
Data points to consider: US prelim GDP at 1.30pm, CB consumer confidence at 3pm GMT.
Levels to watch/live orders:
- Buys: Watch for a H4 close above 1.32 and then look to trade any retest seen thereafter ([we would also advise waiting for a reasonably sized H4 bull candle to form following the retest before looking to execute a trade] stop loss: ideally beyond the trigger candle).
- Sells: 1.3299-1.3265 ([wait for a reasonably sized H4 bear candle to form before looking to execute a trade] stop loss: ideally beyond the trigger candle).
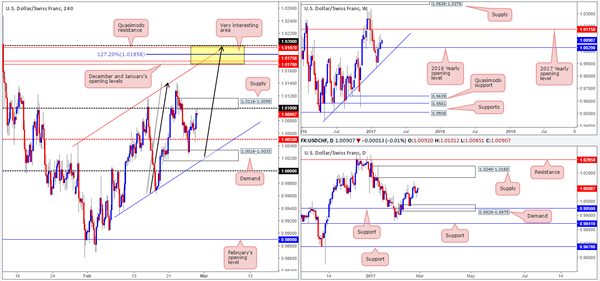
USD/CHF
Amid yesterday’s US segment, the USD/CHF retested the H4 mid-way number coming at 1.0050 and gravitated north up to the H4 supply barrier seen at 1.0116-1.0099. As we mentioned in Monday’s report, while this H4 supply zone could potentially hold the market lower today, we feel it is somewhat vulnerable since the more attractive zone (in yellow) is seen above! The area comprises of the following converging structures: both December and January’s opening levels at 1.0170/1.0175, a H4 AB=CD 127.2% Fib ext. at 1.0185, an upper H4 channel resistance line pegged from the high 1.0044, a H4 Quasimodo resistance at 1.0197, a 1.02 psychological handle and let’s not forget that all of this is seen housed within the daily supply zone coming in at 1.0248-1.0168.
Our suggestions: In light of this confluence, our team will, dependent on the time of day, look to sell from the H4 127.2% Fib ext. level with stops placed a few pips above 1.02. In addition to this, we see little reason not to look to buy any break of the current H4 supply zone up to our H4 sell area. However, we would insist on not only a clean H4 close above the supply, but also a retest of the zone as demand followed by a reasonably sized H4 bull candle before committing to a position.
Data points to consider: US prelim GDP at 1.30pm, CB consumer confidence at 3pm GMT.
Levels to watch/live orders:
- Buys: Watch for a H4 close above the current H4 supply area and look to trade any retest seen thereafter ([we would also advise waiting for a reasonably sized H4 bull to form following the retest candle before looking to execute a trade] stop loss: ideally beyond the trigger candle).
- Sells: 1.0185 region ([an area one could possibly trade at market] stop loss: 1.0205).
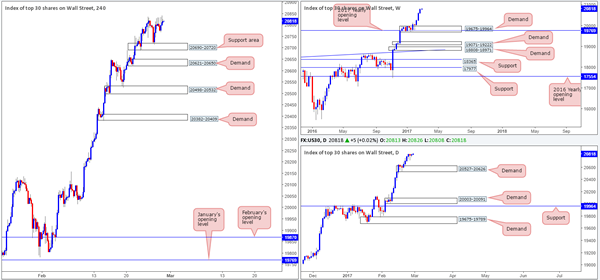
DOW 30
Although price managed to clip fresh a fresh record high of 20843 yesterday, trade was quiet on Monday with price ranging a mere 74 points. Due to this lackluster performance, much of the following report will echo similar thoughts put forward in Monday’s analysis…
As can be seen from the weekly chart, another healthy round of buy orders flowed into the market last week, consequently registering a third consecutive weekly gain. With equities now trading at record highs, where do we go from here? Well, given that there is absolutely no weekly resistance levels in sight, the best we can do for the time being is continue looking to ‘buy the dips’. The closest higher-timeframe area can be seen at 20527-20626: a daily demand zone.
Over on the H4 chart, price respected the H4 support area at 20690-20720 beautifully on Friday and rallied to a high of 20816. Although this zone boasts no higher-timeframe (structural) convergence, the buyers have already proved its value. Therefore, it remains of interest to our desk today.
Our suggestions: Just to be clear here though, placing pending orders at this zone is not advised, since there’s little stopping price from ignoring this area and heading to the H4 demand zone below at 20621-20650, which happens to be positioned around the top edge of the current daily demand base. Waiting for additional confirmation such as a lower-timeframe buy signal (see the top of this report) or a reasonably sized H4 bull candle is, at least in our opinion, the safer, more logical, path to take.
Data points to consider: US prelim GDP at 1.30pm, CB consumer confidence at 3pm GMT.
Levels to watch/live orders:
- Buys: 20690-20720 ([waiting for additional confirmation is advised before looking to execute a trade] stop loss: dependent on how one chooses to confirm the zone).
- Sells: Flat (stop loss: N/A).
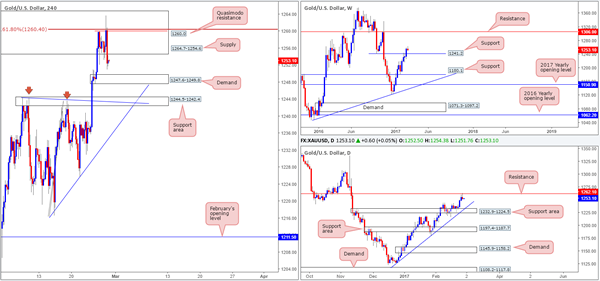
GOLD
For those who read Monday’s report on gold you may recall our desk talking about shorting from the H4 161.8% Fib ext. at 1260.4, which is sited within a H4 supply at 1264.7-1254.6. As you can see, bullion sold off beautifully from this line and is on course to test the H4 demand coming in at 1247.6-1249.8. Well done to any of our readers who managed to jump aboard this move!
While the H4 candles are currently reflecting a bearish tone, as well as daily action recently kissing the underside of a daily resistance seen at 1262.1, where do we go from here when weekly price, only last week, closed above a weekly resistance at 1241.2?
Our suggestions: There is a chance that price could very well continue selling off this week, with price taking out not only the current H4 demand, but also the H4 support area seen below it at 1244.5-1242.4, since weekly movement may retest the recently broken weekly resistance as support.
With this in mind, we are looking to short from the H4 Quasimodo resistance at 1260.0 today. Not only is it located within the above noted H4 supply, it also sits just below the H4 161.8% Fib ext. at 1260.4 and daily resistance at 1262.1. However, we must stress that we would pass on this setup if price connects with the H4 demand beforehand since this is our first take-profit target.
Levels to watch/live orders:
- Buys: Flat (stop loss: N/A).
- Sells: 1260.0 region ([an area one could possibly trade at market] stop loss: above the H4 supply at 1264.7-1254.6).


