
The EUR/USD currency pair
Technical indicators of the currency pair:
Prev Open: 1.12209
Open: 1.12760
% chg. over the last day: +0.49
Day’s range: 1.12636 – 1.12793
52 wk range: 1.1111 – 1.2009
EUR/USD shows high trading activity and volatility. The Central Bank of Europe, as expected, kept the monetary policy on the same levels. The regulator increased the forecasted value of the EU GDP growth from 1.1% to 1.2% this year. The Central Bank left out the increase in the key interest rates until the end of the first half of 2020. Mario Draghi earlier mentioned that some of the CBE representatives are ready to review the restoration of the quantitative easing program should the conditions become unfavourable. The local support and resistance levels are 1.12500 and 1.12750. The investors are waiting for the May US labour market report. Keep an eye on the difference between the real and the forecasted values and open positions from the key levels.
At 15:30 the US will publish a labour market report.
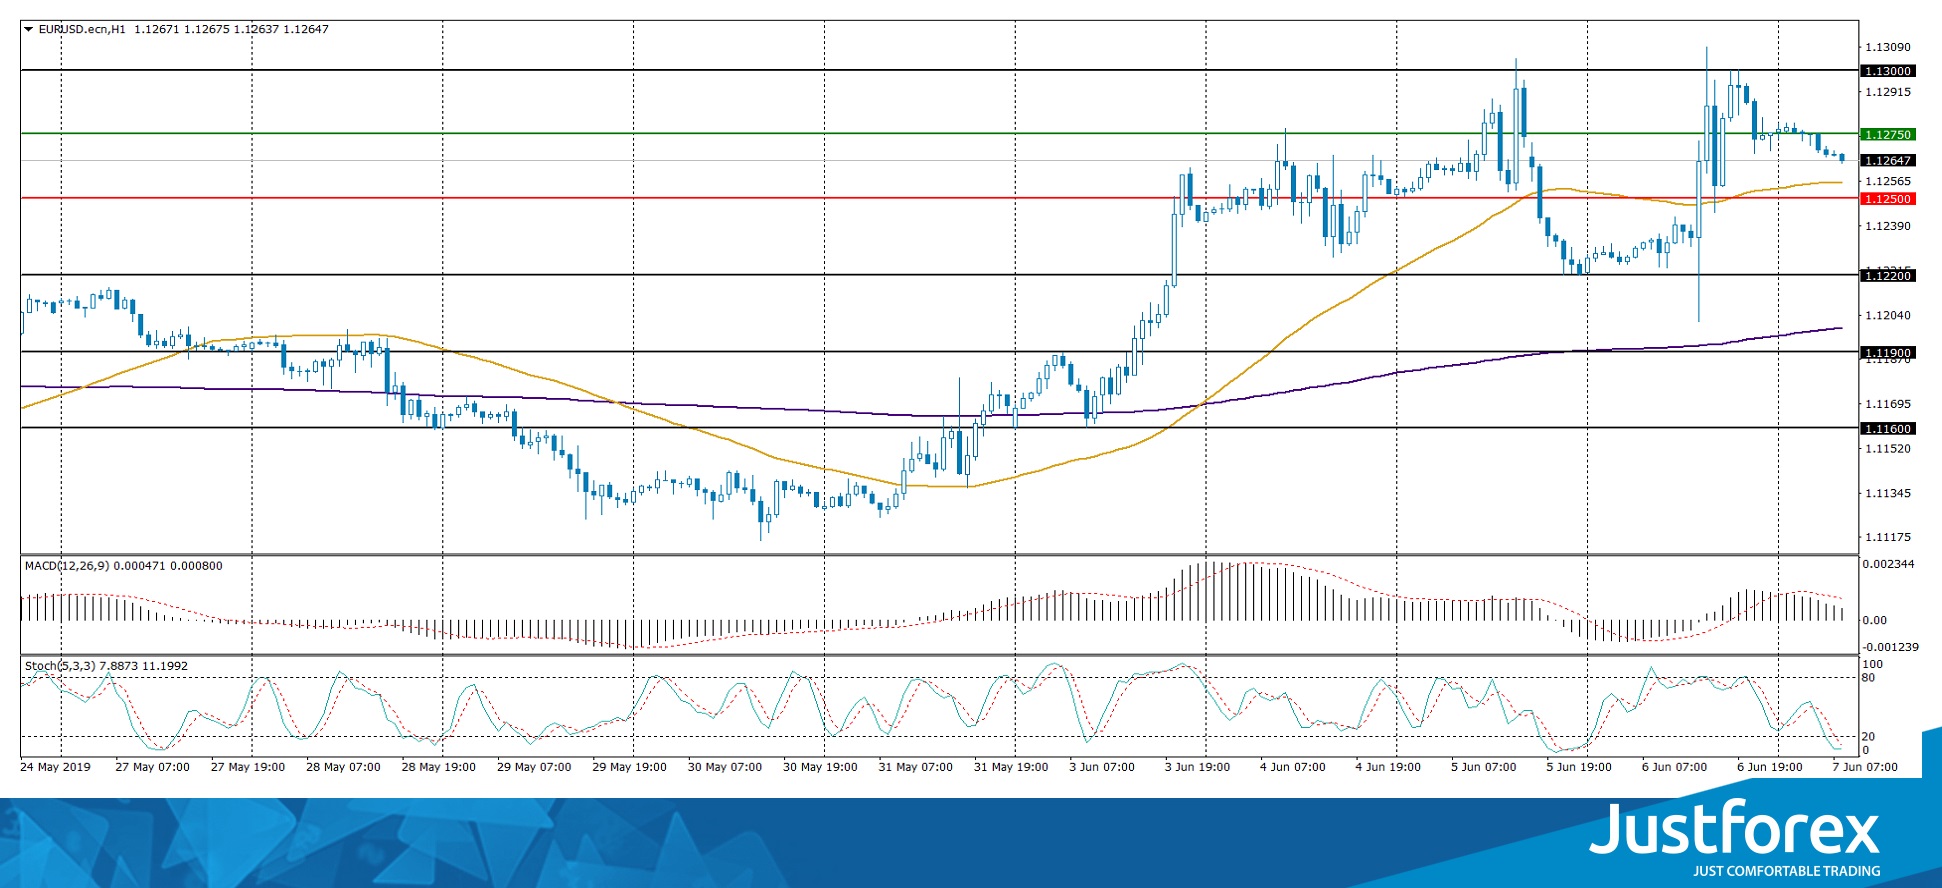
The price fixed above 50 MA and 200 MA which points to the power of the buyers.
The MACD histogram is in the positive zone but below the signal line which points towards buying EUR/USD.
The Stochastic Oscillator is in the oversold zone, the %K line. There are no signals at the moment.
Trading recommendations
Support levels: 1.12500, 1.12200, 1.11900
Resistance levels: 1.12750, 1.13000
If the price fixes above 1.12750, expect the growth towards 1.13250-1.13500.
Alternatively, the quotes can descend towards 1.12000-1.11800.
The GBP/USD currency pair
Technical indicators of the currency pair:
Prev Open: 1.26988
Open: 1.26834
% chg. over the last day: -0.08
Day’s range: 1.26741 – 1.26939
52 wk range: 1.2438 – 1.3631
GBP/USD stabilized after a long growth since the beginning of May. The quotes are moving sideways. The investors are waiting for additional drivers. The support and resistance levels are 1.26750 and 1.27100. The market pariticpants are waiting for the US labour market report. Open positions from the key levels.
The Economic News Feed for 07.06.2019 is calm.
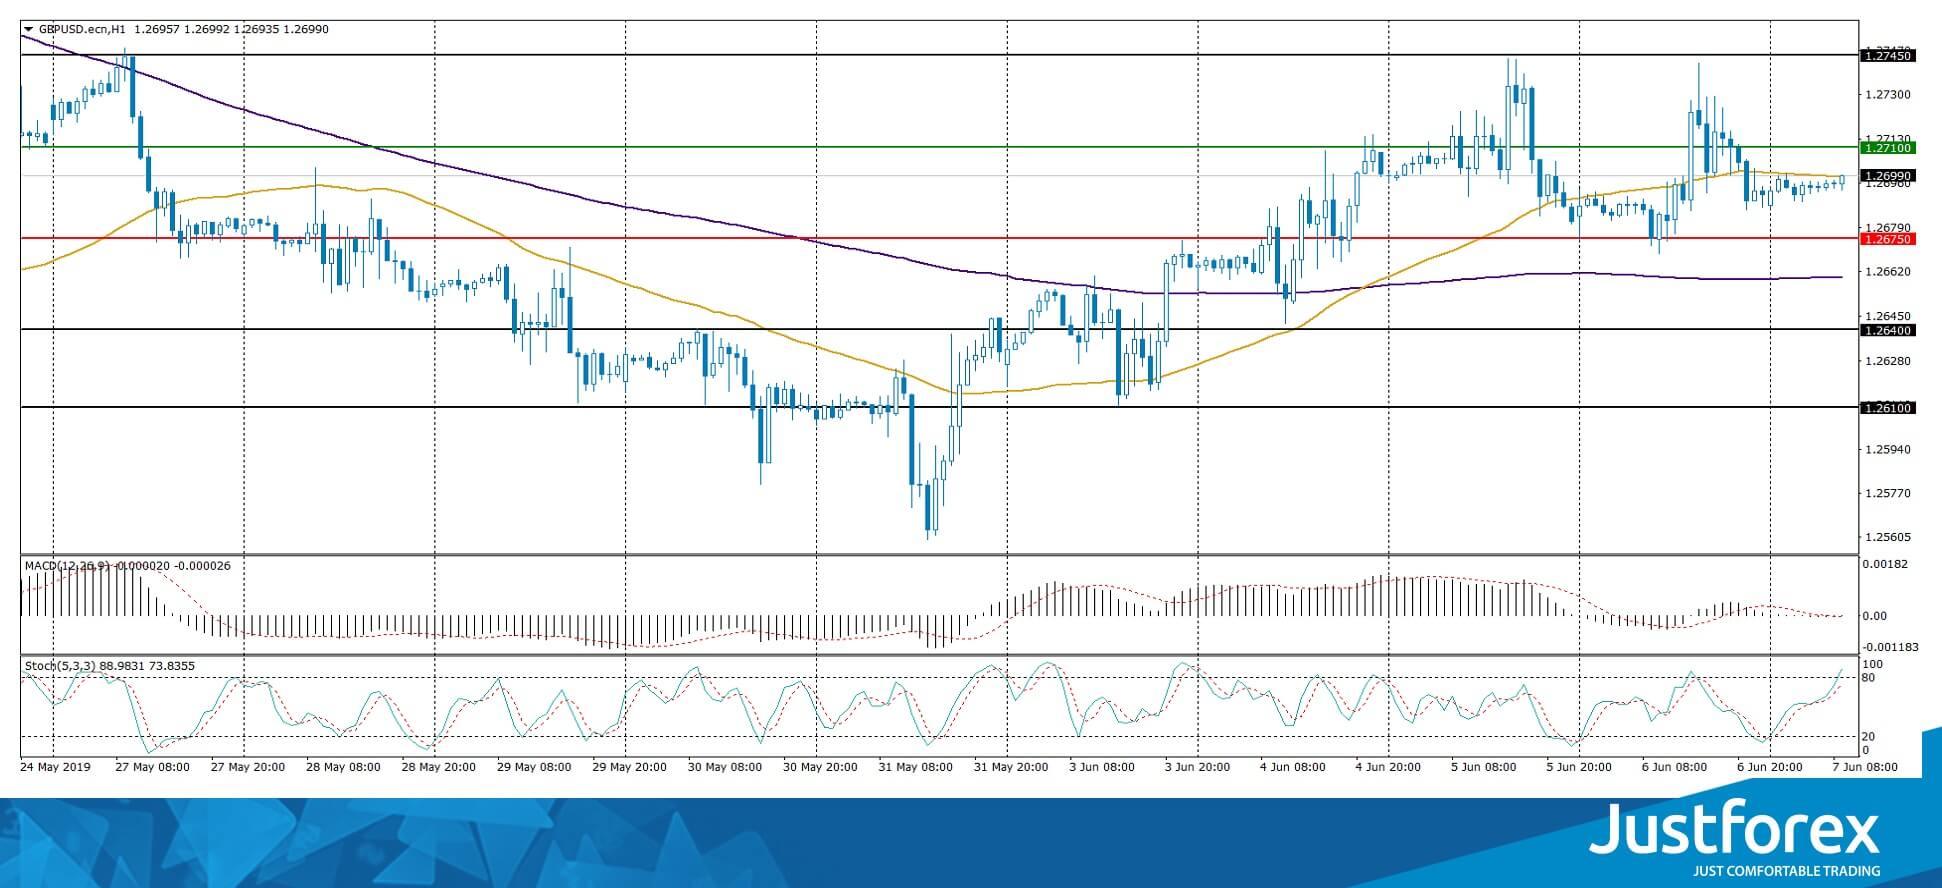
The indicators do not provide precise signals, the price crossed 50 MA.
The MACD histogram is close to 0
The Stochastic Oscillator is in the neutral zone, the %K line is above the %D line which points to a bullish mood
Trading recommendations
Support levels: 1.26750, 1.26400, 1.26100
Resistance levels: 1.27100, 1.27450
If the price fixes above 1.27100, expect further growth towards 1.27500-1.27700.
Alternatively, the quotes can descend towards 1.26400-1.26200.
The USD/CAD currency pair
Technical indicators of the currency pair:
Prev Open: 1.34145
Open: 1.33617
% chg. over the last day: -0.45
Day’s range: 1.33459 – 1.33668
52 wk range: 1.2727 – 1.3664
USD/CAD started to descend again. The trading instrument updated the two-month minimums. The price on oil recovered, which gave a boost to CAD. Right now the quotes are near the local support of 1.33450 with 1.33750 acting as a nearest resistance. The quotes can descend further. Keep an eye on the US and Canada labour market reports and open positions from the key levels.
At 15:30 (GMT+3:00) Canada will puiblish a labour market report.
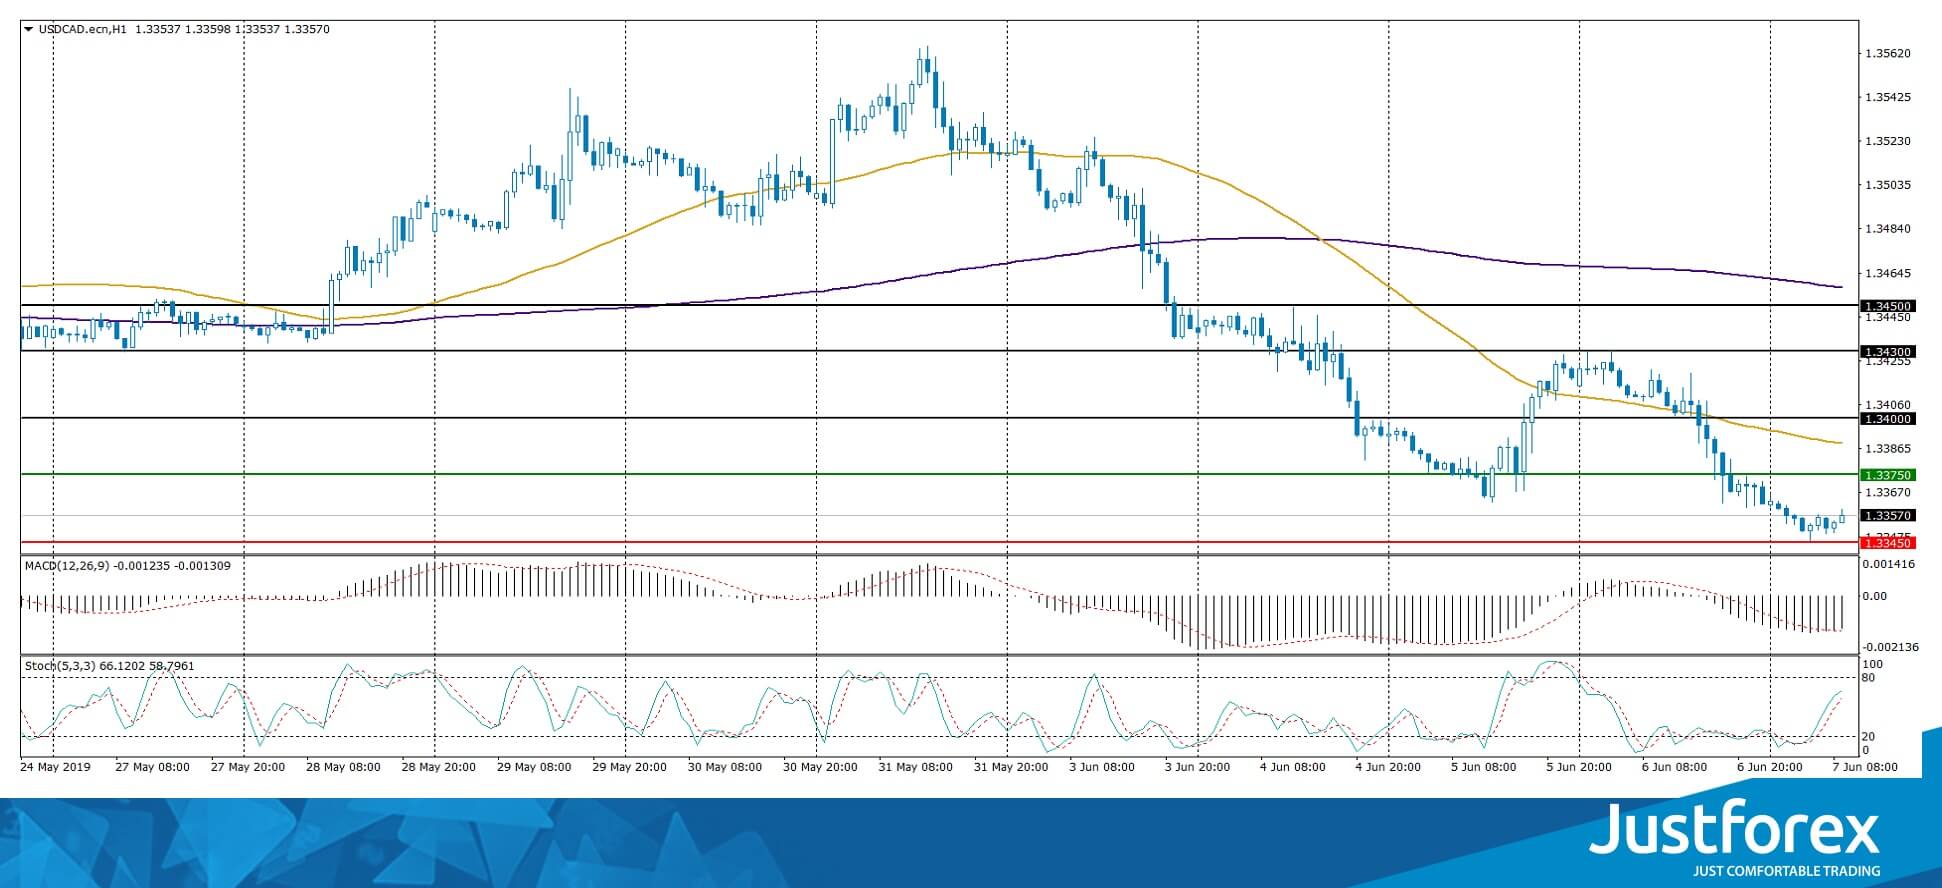
The price fixed below 50 MA and 200 MA which point to the power of the buyers.
The MACD histogram is in the negative zone which points to the bearish mood.
The Stochastic Oscillator is in the neutral zone, the %K line is above the %D line which gives a signal to sell USD/CAD.
Trading recommendations
Support levels: 1.33450, 1.33000
Resistance levels: 1.33750, 1.34000, 1.34300
If the price fixes below 1.33450, expect further descend towards 1.33000.
Alternatively, the quotes can grow towards 1.34000-1.34300.
The USD/JPY currency pair
Technical indicators of the currency pair:
Prev Open: 108.464
Open: 108.399
% chg. over the last day: -0.03
Day’s range: 108.320 – 108.535
52 wk range: 104.97 – 114.56
The USD/JPY quotes are moving sideways, the technical picture is ambiguous. The market participants are waiting for the US labour market report. The quotes are consolidating around 108.200-108.550. The demand on the safe assets remains high. Keep an eye on the US Treasury bonds’ yield and open positions from the key levels.
During the Asian trading session, Japan published weak household expenditure data.
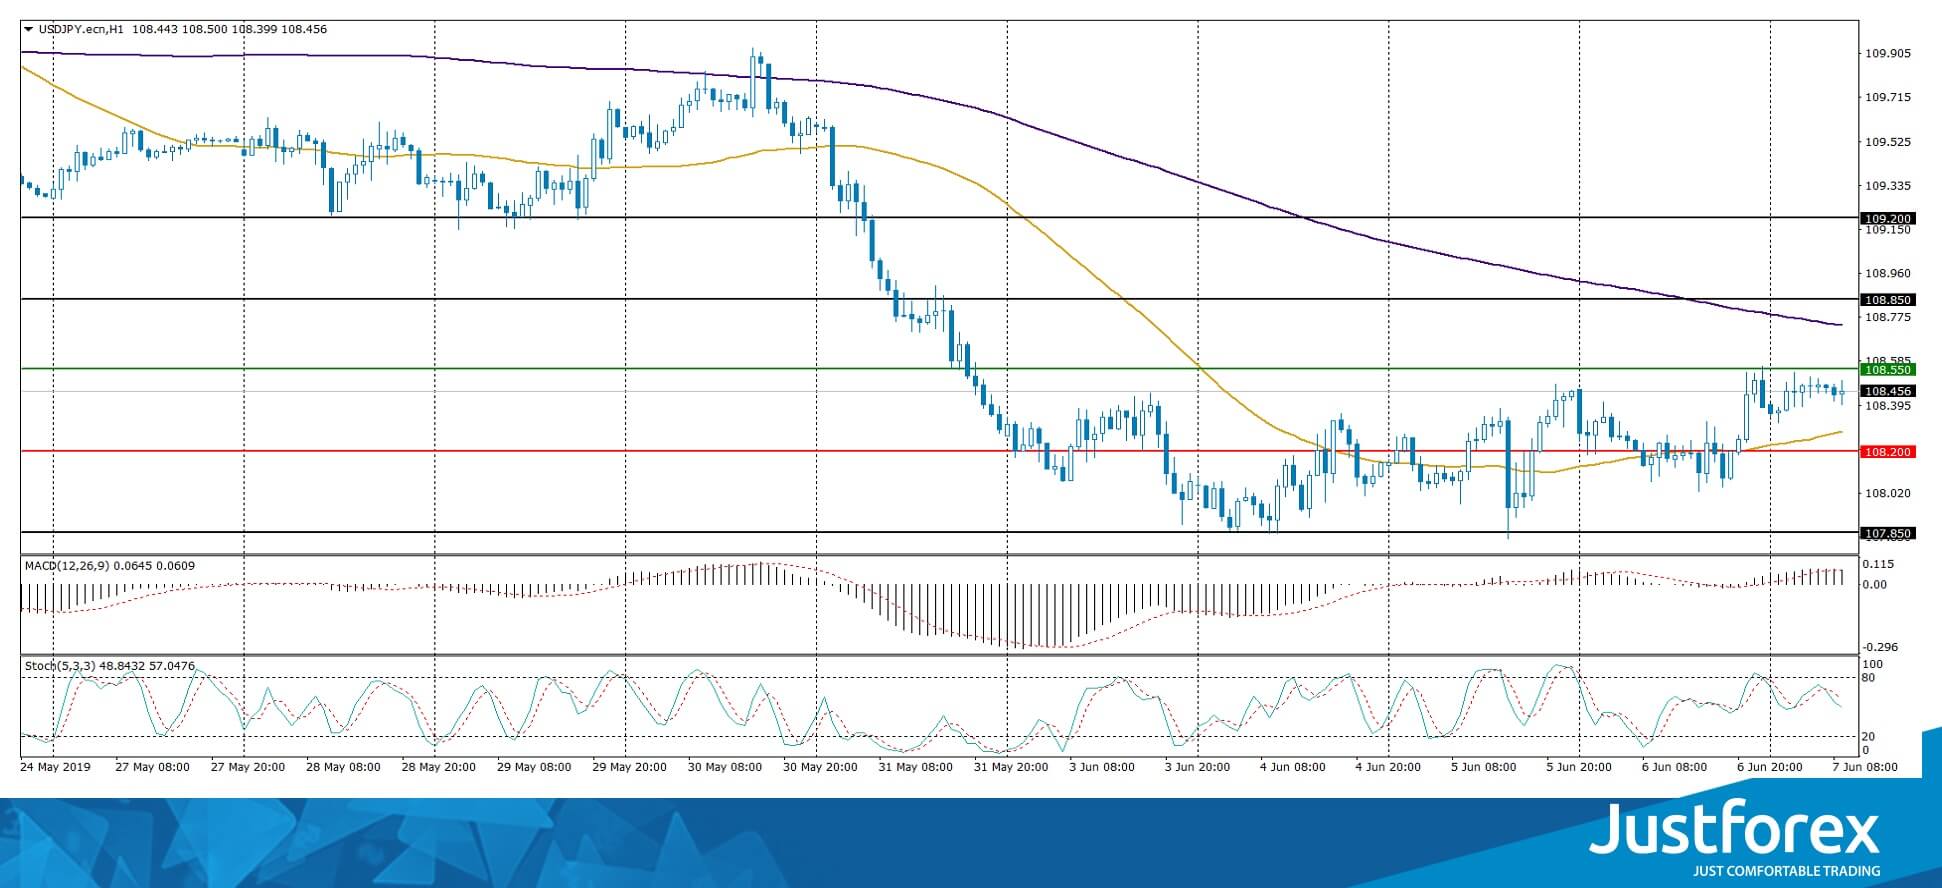
The indicators do not provide precise signals, the price fixed between 50 and 200 MA.
The MACD histogram is in the positive zone, which points to a bullish mood.
The Stochastic Oscillator is in the neutral zone, the %K line is below the %D line which gives a signal to sell USD/JPY.
Trading recommendations
Support levels: 108.200, 107.850, 107.500
Resistance levels: 108.550, 108.850, 109.200
If the price fixes below 108.200, the quotes can descend towards 107.850-107.500.
Alternatively, the quotes can recover towards 109.000-109.200.


