
A note on lower timeframe confirming price action…
Waiting for lower timeframe confirmation is our main tool to confirm strength within higher timeframe zones, and has really been the key to our trading success. It takes a little time to understand the subtle nuances, however, as each trade is never the same, but once you master the rhythm so to speak, you will be saved from countless unnecessary losing trades. The following is a list of what we look for:
- A break/retest of supply or demand dependent on which way you’re trading.
- A trendline break/retest.
- Buying/selling tails … essentially we look for a cluster of very obvious spikes off of lower timeframe support and resistance levels within the higher timeframe zone.
- Candlestick patterns. We tend to only stick with pin bars and engulfing bars as these have proven to be the most effective.
EUR/USD
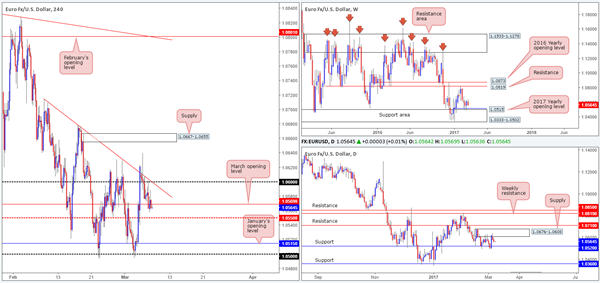
As we entered into the early hours of yesterday’s London segment, the single currency tapped the underside of the 1.06 handle and sold off. Despite this, the selloff was a relatively short-lived one, as price found support just ahead of the H4 mid-way support level at 1.0550.
With the session producing very little in terms of movement, our desk continues to favor the 1.05/1.0520 area for longs. The zone comprises of: a round number at 1.05, January’s opening level at 1.0515, daily support at 1.0520 as well as being reinforced by the weekly support area at 1.0333-1.0502.
Our suggestions: Seeing as how the 1.05/1.0520 zone has already been tested twice, we would not be comfortable trading from here without additional lower-timeframe confirmation. This could be either an engulf of demand followed by a retest as supply, a trendline break/retest or simply a well-defined collection of buying tails around the higher-timeframe zone.
Data points to consider: US ADP non-farm employment change at 1.15pm GMT
Levels to watch/live orders:
- Buys: 1.05/1.0520 ([wait for a lower-timeframe signal to form before looking to pull the trigger] stop loss: dependent on where one confirms the zone).
- Sells: Flat (stop loss: N/A).
AUD/USD
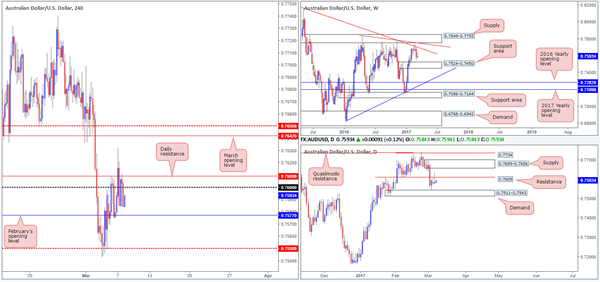
Kicking this morning’s report off with a look at the daily timeframe, we can see that the commodity currency has now chalked in two back-to-back bearish pin bars off the underside of a daily resistance pegged at 0.7609. Assuming that this encourages selling, the next downside target to have noted is the daily demand area drawn from 0.7511-0.7543. In conjunction with the daily picture, weekly action also indicates that there’s room to push lower down to a weekly support area seen at 0.7524-0.7450 (bolsters the aforementioned daily demand).
Stepping across to the H4 candles, price settled for the day just ahead of February’s opening level at 0.7577. Despite what we’ve noted on the higher-timeframe structures, to become sellers we would need to see a H4 close beyond 0.7577. This would, as you can see, potentially open up the runway south down to the H4 mid-way point 0.7550 which happens to be positioned directly above the top edge of the current daily demand.
Our suggestions: Should a close below 0.7577 come to fruition, we would look to short any retest seen to the underside of this line assuming that it’s backed with a lower-timeframe confirming signal (see the top of this report), targeting 0.7550.
Data points to consider: Chinese trade balance (tentative). US ADP non-farm employment change at 1.15pm GMT.
Levels to watch/live orders:
- Buys: Flat (stop loss: N/A).
- Sells: Watch for price to engulf 0.7577 and then look to trade any retest seen thereafter (waiting for a lower-timeframe confirming signal to form following the retest is advised] stop loss: dependent on where one confirms the level).
USD/JPY
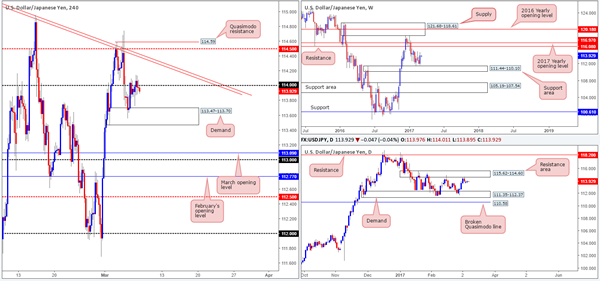
USD/JPY prices are little changed this morning, with the market spending the day ranging (43 pips) around the 114 handle. This lackluster performance, as you can see on the daily chart, formed yet another daily indecision candle!
With weekly action recently printing a strong-looking weekly bullish engulfing candle, and daily movement seen loitering around the underside of a daily resistance area at 115.62-114.60, higher-timeframe technicals are somewhat mixed at the moment.
Our suggestions: While a H4 close above 114 would be considered a bullish signal, and considering that you’d also be trading in line with weekly flow, price may very well reach the nearby H4 trendline resistance extended from the high 115.62. However, this would also place one against daily sellers! It’s just not worth the risk, in our opinion. The same goes for shorting this piece. A short would obviously place one in line with daily flow, but at the same time, against weekly direction!
Therefore, at least for now, we will remain on the sidelines.
Data points to consider: US ADP non-farm employment change at 1.15pm GMT.
Levels to watch/live orders:
- Buys: Flat (stop loss: N/A).
- Sells: Flat (stop loss: N/A).
USD/CAD
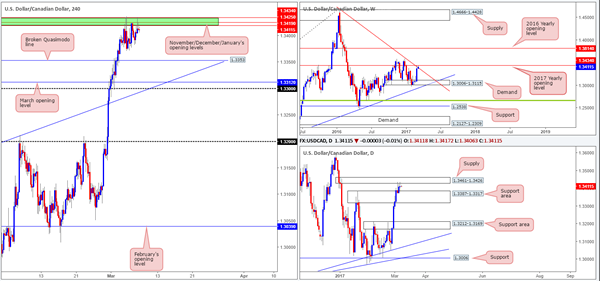
Much the same as yesterday, the USD/CAD is still seen capped at 1.3434/1.3419 (November, December and January’s opening levels). Also worth noting is the converging weekly trendline resistance extended from the high 1.4689 and daily supply coming in at 1.3461-1.3426. While this collective structure places the unit in a somewhat overbought position right now, there’s been very little bearish intent registered so far. This, of course, could have something to do with the daily support area seen in play at 1.3387-1.3317! Assuming that the bears regain consciousness here, however, the next downside target on the H4 scale is a broken Quasimodo line at 1.3353.
Our suggestions: If one is able to pin down a lower-timeframe short position (see the top of this report) from the above noted monthly levels today, a short position could be considered, targeting the above said broken H4 Quasimodo level. In regards to buying this unit, we would advise against this given the opposing structures seen on the weekly and daily timeframes.
Data points to consider: US ADP non-farm employment change at 1.15pm. Crude oil inventories at 3.30pm GMT.
Levels to watch/live orders:
- Buys: Flat (stop loss: N/A).
- Sells: 1.3434/1.3419 ([wait for a lower-timeframe signal to form before looking to pull the trigger] stop loss: dependent on where one confirms the zone).
USD/CHF
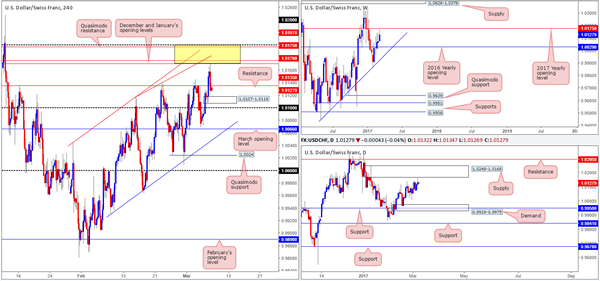
For a while now we have been banging the drum about the 1.02/1.0170 (yellow zone) neighborhood for shorts. The reason being is that this area comprises of the following converging structures: both December and January’s opening levels at 1.0170/1.0175, a H4 trendline resistance pegged from the high 1.0118, a H4 Quasimodo resistance at 1.0197, a 1.02 psychological handle and let’s not forget that all of this is seen housed within the daily supply zone mentioned above 1.0248-1.0168.
As can be seen from the H4 chart this morning, price actually tagged the underside of this region yesterday and aggressively sold off. Unfortunately, we were looking to sell from January’s opening level at 1.0175, so we missed the trade by five pips! Well done to any of our readers who managed to short from this beautiful zone.
Going forward, the pair is now seen trading between a H4 resistance at 1.0135 and a nearby H4 demand base coming in at 1.0107-1.0118. Given the near-touch of January’s open level, our team believes further selling could very well be on the cards today/this week. However, selling is a little tricky right now. Apart from the nearby H4 demand, we also have a psychological band coming in at 1.01, followed closely by the March opening level at 1.0066 to contend with!
Our suggestions: in the absence of cleaner price action, we have decided to remain flat for the time being.
Data points to consider: US ADP non-farm employment change at 1.15pm GMT.
Levels to watch/live orders:
- Buys: Flat (stop loss: N/A).
- Sells: Flat (stop loss: N/A).
DOW 30
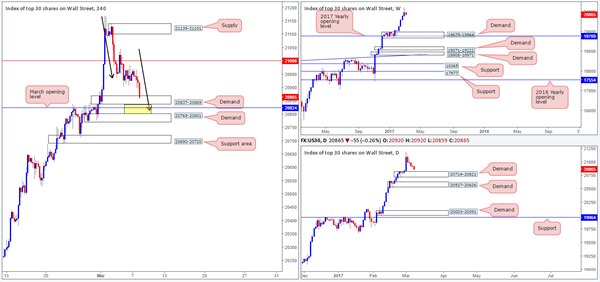
In recent hours we have seen the US equity market tumble down to a H4 demand area marked at 20837-20869. Be that as it may, we have our eye on the zone seen between this H4 demand and the one directly below it: 20769-20801/ 20837-20869, which happens to be positioned within the walls of the nearby daily demand zone at 20714-20821. The interesting thing here is that in between these two H4 barriers (the yellow zone) is March’s opening level at 20824 and a possible H4 AB=CD completion point at 20813 (see black arrows).
Our suggestions: Should we see price strike the yellow zone today, our team would, assuming that a reasonably sized H4 bull candle takes shape, look to buy from here with stops either placed below the trigger candle or below the H4 demand at 20769-20801.
Data points to consider: US ADP non-farm employment change at 1.15pm GMT.
Levels to watch/live orders:
- Buys: 20801/20837 region ([wait for a reasonably sized H4 bull candle to form before looking to pull trigger here] stop loss: ideally beyond the trigger candle).
- Sells: Flat (stop loss: N/A).
GOLD
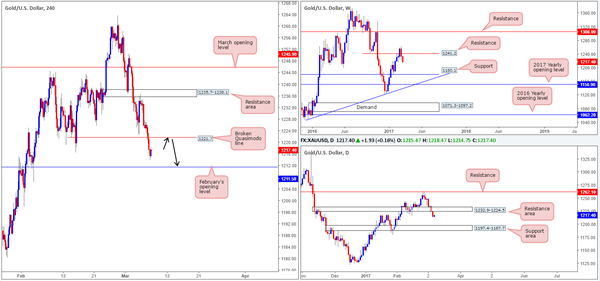
Gold took yet another hit to the mid-section yesterday as the unit crashed through bids at a H4 Quasimodo support level coming in at 1221.7. In view of the H4 candles now seen loitering mid-range between this H4 level and February’s opening level at 1211.5, where do we go from here? Well, both weekly and daily action suggest further selling could be on the horizon, with the closest higher-timeframe support coming in at 1197.4-1187.7: a daily support area. Therefore, a short from the recently broken 1221.7 hurdle could be an option today, targeting 1211.5 as your initial take-profit zone (as per the black arrows).
Our suggestions: Since we are dealing with a fixed level here, to avoid the possibility of a fakeout we would strongly recommend waiting for a lower-timeframe sell signal to form before pulling the trigger.
Levels to watch/live orders:
- Buys: Flat (stop loss: N/A).
- Sells: 1221.7 region ([wait for a lower-timeframe signal to form before looking to pull the trigger] stop loss: dependent on where one confirms the zone).


