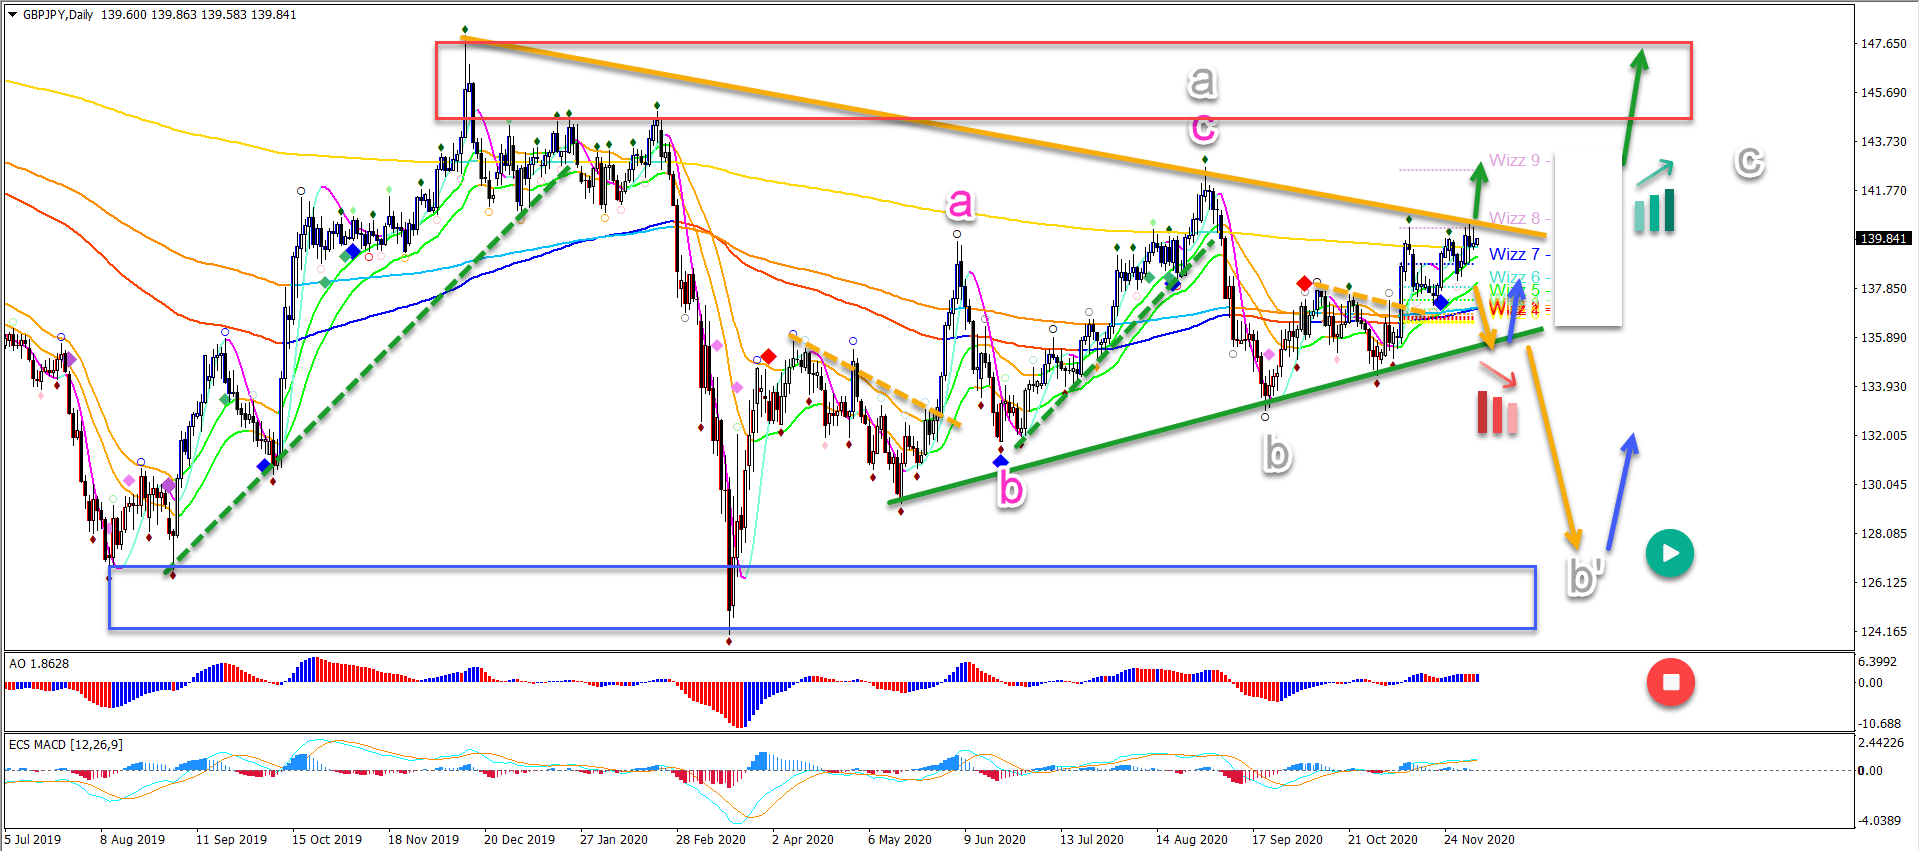
It would be the first serious break above the MA since the year 2015. It could finally indicate a larger uptrend on the daily chart.
The GBP/JPY needs a break above the key resistance trend line (orange). A bullish breakout (green arrow) above 126.50 would confirm the uptrend.
Price Charts and Technical Analysis
The main targets are the Wizz 9 level at 142.50 and the resistance zone at the previous top (red box). In this case we are looking at a bullish wave C (grey).
What if a bearish break happens? This could indicate a retest of the support trend line (green). A break below that could indicate a deep wave B (grey), which could go to the previous bottom (blue box).
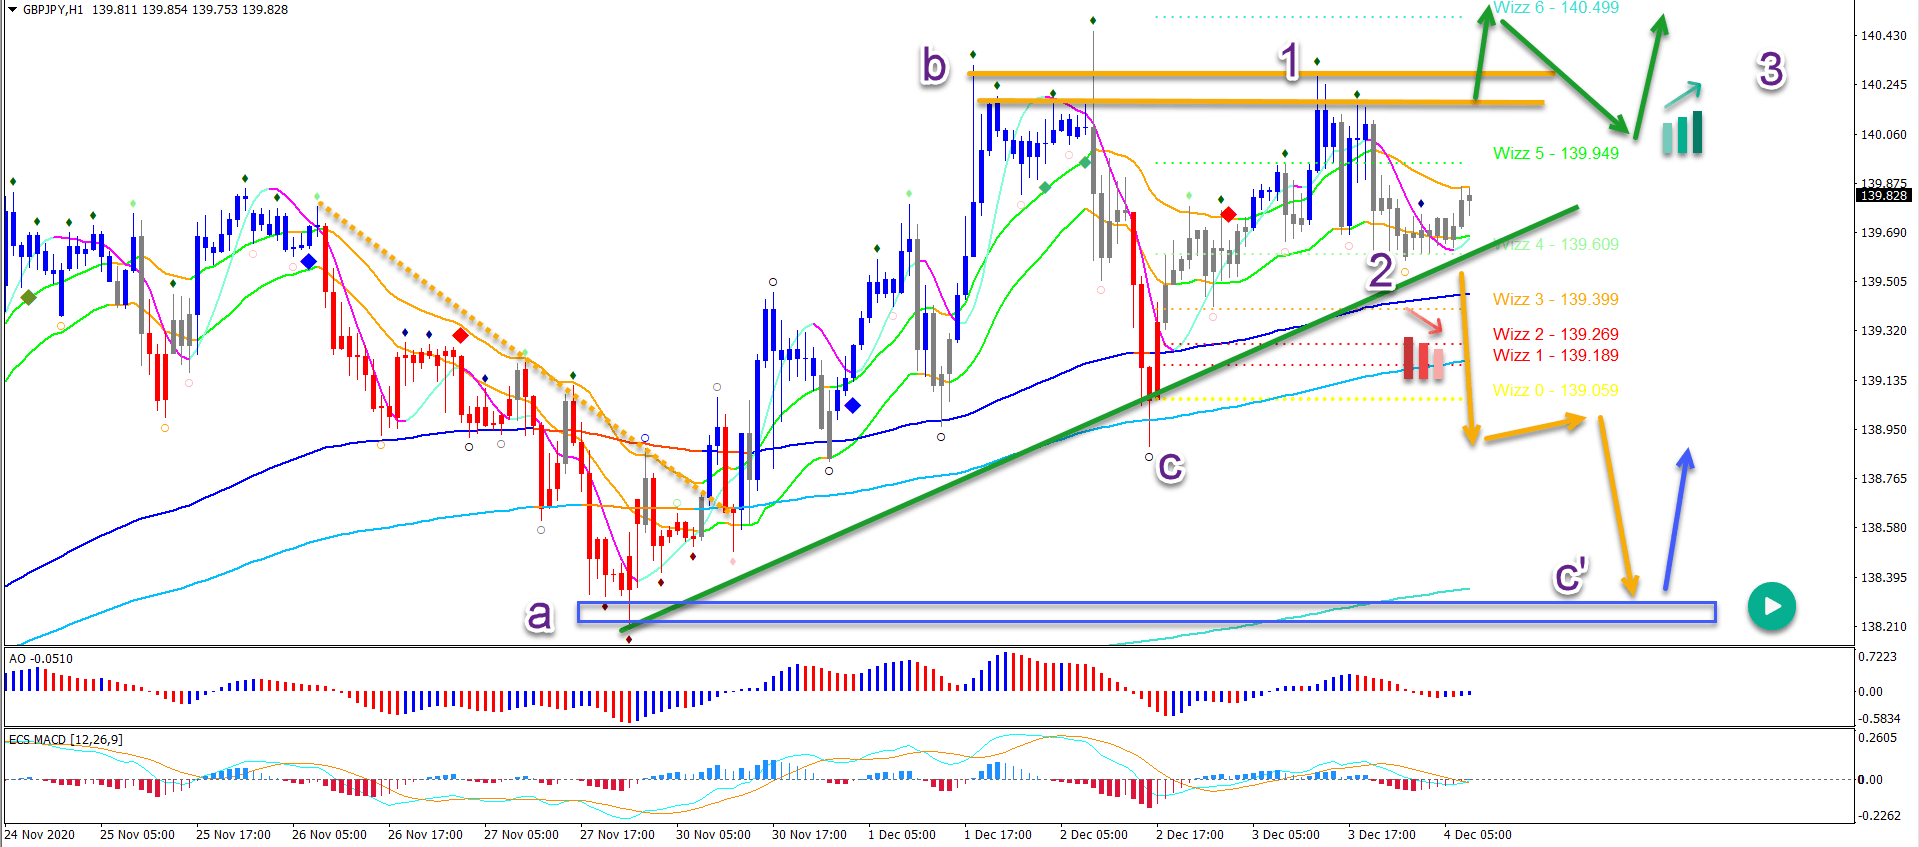
On the 1 hour chart, price action is waiting to breakout the top or the bottom. This could confirm a third price swing, either up or down.
The chart pattern is currently developing as an ascending wedge pattern, which is a bullish signal. In the bullish scenario, it would be a wave 3 (purple). For the bears, it’s an extended wave C (C’).